Podstawowe statystyki
| Właściciele instytucjonalni | 547 total, 515 long only, 1 short only, 31 long/short - change of -13,81% MRQ |
| Cena akcji | 16,25 |
| Średnia alokacja portfela | 0.2405 % - change of -26,49% MRQ |
| Akcje instytucjonalne (długie) | 606 106 232 (ex 13D/G) - change of -190,09MM shares -21,91% MRQ |
| Wartość instytucjonalna (długa) | $ 7 026 321 USD ($1000) |
Własność instytucjonalna i akcjonariusze
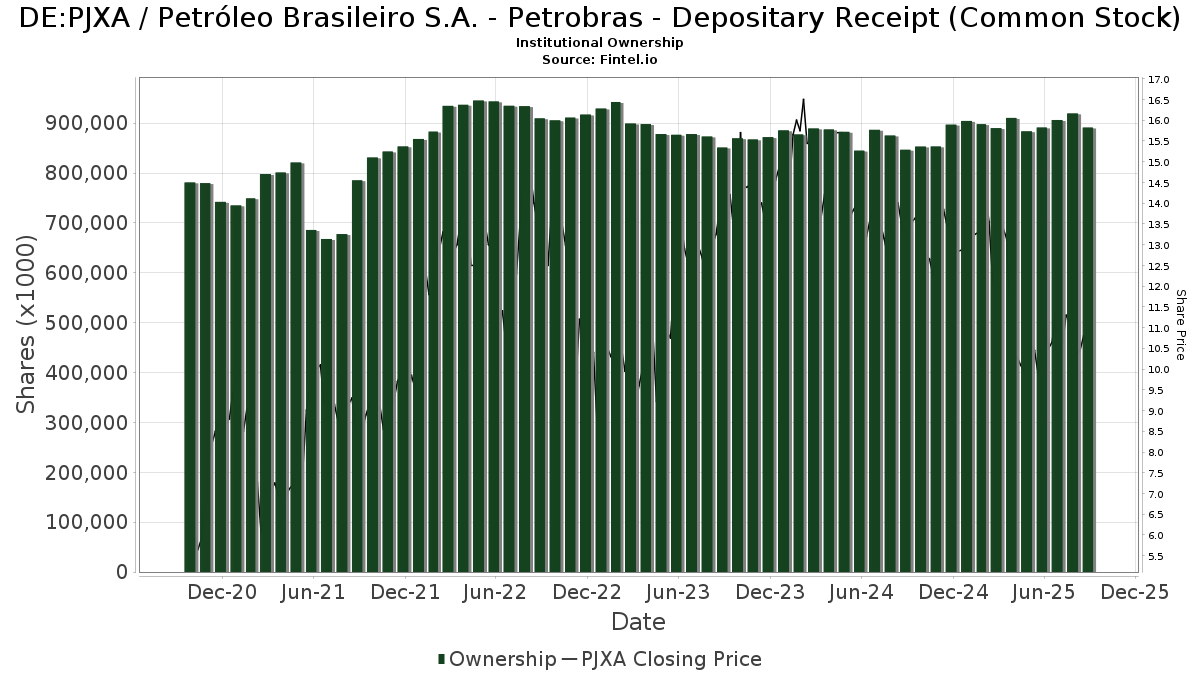
Petróleo Brasileiro S.A. - Petrobras - Depositary Receipt (Common Stock) (DE:PJXA) posiada 547 właściciele instytucjonalni i akcjonariusze, którzy złożyli formularze 13D/G lub 13F w Komisji Papierów Wartościowych (SEC). Instytucje te posiadają łącznie 606,106,232 akcji. Do największych akcjonariuszy należą GQG Partners LLC, Capital International Investors, Baillie Gifford & Co, Invesco Ltd., Schroder Investment Management Group, Lazard Asset Management Llc, Itau Unibanco Holding S.A., ARGA Investment Management, LP, Fisher Asset Management, LLC, and Bank Of America Corp /de/ .
Petróleo Brasileiro S.A. - Petrobras - Depositary Receipt (Common Stock) (DB:PJXA) instytucjonalna struktura własności pokazuje aktualne pozycje w firmie według instytucji i funduszy, a także najnowsze zmiany w wielkości stanowisk. Głównymi akcjonariuszami mogą być inwestorzy indywidualni, fundusze inwestycyjne, fundusze hedgingowe lub instytucje. Załącznik 13D wskazuje, że inwestor posiada (lub posiadał) więcej niż 5% udziałów w spółce i zamierza (lub zamierzał) aktywnie dążyć do zmiany strategii biznesowej. Załącznik 13G wskazuje na inwestycję pasywną na poziomie ponad 5%.
The share price as of March 20, 2026 is 16,25 / share. Previously, on March 24, 2025, the share price was 12,90 / share. This represents an increase of 25,97% over that period.
Ocena sentymentu funduszu
Wskaźnik sentymentu funduszu (fka Ownership Accumulation Score) pozwala określić akcje, które są najczęściej kupowane przez fundusze. Jest to wynik zaawansowanego, wieloczynnikowego modelu ilościowego, który identyfikuje spółki o najwyższym poziomie akumulacji instytucjonalnej. Model oceny wykorzystuje kombinację całkowitego wzrostu liczby ujawnionych właścicieli, zmian w alokacji portfela wśród tych właścicieli i innych wskaźników. Liczba waha się od 0 do 100, przy czym wyższe liczby wskazują na wyższy poziom akumulacji w stosunku do innych spółek, a 50 oznacza średnią.
Częstotliwość aktualizacji: codziennie
Sprawdź Ownership Explorer, który zawiera listę firm o najwyższym rankingu.
AI+ Ask Fintel’s AI assistant about Petróleo Brasileiro S.A. - Petrobras - Depositary Receipt (Common Stock).
Select a question to share a public post with an AI-crafted answer.
Thinking of good questions…
Zgłoszenia 13F i NPORT
Szczegółowe dane dotyczące zgłoszeń 13F są bezpłatne. Szczegółowe dane dotyczące zgłoszeń NP wymagają członkostwa premium. Zielone rzędy wskazują nowe pozycje. Czerwone rzędy wskazują pozycje zamknięte. Kliknij w ikonę linku, aby zobaczyć pełną historię transakcji.
Aktualizacja
aby odblokować dane premium i eksportować do Excela ![]() .
.
| Data pliku | Źródło | Inwestor | Typ | Średnia cena (Est) |
Akcje | Akcje; Δ (%) |
Zgłoszono Wartość ($1000) |
Wartość; Δ (%) |
Przydział portu (%) |
|
|---|---|---|---|---|---|---|---|---|---|---|
| 2025-11-05 | 13F | Wellington Shields Capital Management, LLC | 0 | -100,00 | 0 | |||||
| 2026-02-17 | 13F | Citadel Advisors Llc | Put | 1 703 300 | 22,67 | 20 184 | 14,83 | |||
| 2026-01-14 | 13F | Jfs Wealth Advisors, Llc | 508 | 9,01 | 6 | 20,00 | ||||
| 2026-01-22 | 13F | V-Square Quantitative Management LLC | 6 489 | 77 | ||||||
| 2026-02-17 | 13F | Optiver Holding B.V. | 2 223 170 | -12,33 | 26 345 | -17,94 | ||||
| 2026-02-05 | 13F | Park Square Financial Group, LLC | 513 | 7 | ||||||
| 2026-02-17 | 13F | Optiver Holding B.V. | Call | 7 063 400 | -9,11 | 83 701 | -14,92 | |||
| 2026-01-20 | 13F | Ascent Group, LLC | 14 014 | -22,26 | 166 | -27,19 | ||||
| 2026-02-14 | 13F | Silver Grove Financial Group, Inc. | 2 000 | 24 | ||||||
| 2026-02-17 | 13F | Hilltop Holdings Inc. | 12 146 | -4,29 | 144 | -10,62 | ||||
| 2025-11-14 | 13F | Turim 21 Investimentos Ltda. | 0 | -100,00 | 0 | |||||
| 2026-01-26 | 13F | Moran Wealth Management, LLC | 535 044 | 17,99 | 6 340 | 10,43 | ||||
| 2026-02-17 | 13F | First Manhattan Co | 0 | -100,00 | 0 | |||||
| 2026-02-02 | 13F | Qrg Capital Management, Inc. | 36 280 | 1,08 | 430 | -5,51 | ||||
| 2026-02-11 | 13F | X-Square Capital, LLC | 11 463 | -46,59 | 0 | |||||
| 2025-11-17 | 13F | Perritt Capital Management Inc | 0 | -100,00 | 0 | -100,00 | ||||
| 2026-02-10 | 13F/A | Northwestern Mutual Wealth Management Co | 79 081 | -28,17 | 937 | -32,74 | ||||
| 2026-02-10 | 13F | KERR FINANCIAL PLANNING Corp | 14 | 0 | ||||||
| 2026-02-17 | 13F | Citadel Advisors Llc | 70 241 | 80,18 | 832 | 68,76 | ||||
| 2026-02-13 | 13F | Venture Visionary Partners LLC | 264 118 | 6,93 | 3 130 | 0,06 | ||||
| 2026-02-13 | 13F | Ieq Capital, Llc | 57 671 | 23,82 | 683 | 15,96 | ||||
| 2026-02-17 | 13F | Optiver Holding B.V. | Put | 10 087 400 | 27 920,56 | 119 536 | 28 025,88 | |||
| 2025-09-25 | NP | Dfa Investment Trust Co - The Emerging Markets Series This fund is a listed as child fund of Dimensional Fund Advisors Lp and if that institution has disclosed ownership in this security, then these positions will not be double counted when calculating total shares and total value | 142 561 | 0,00 | 1 816 | 12,87 | ||||
| 2026-01-21 | 13F | Newbridge Financial Services Group, Inc. | 1 725 | 6,15 | 20 | 0,00 | ||||
| 2026-02-13 | 13F | Journey Strategic Wealth Llc | 86 262 | -2,02 | 1 022 | -8,26 | ||||
| 2026-02-17 | 13F | Citadel Advisors Llc | Call | 1 312 600 | -32,80 | 15 554 | -37,10 | |||
| 2026-01-12 | 13F | Abound Wealth Management | 24 | 0,00 | 0 | |||||
| 2026-02-06 | 13F | Gsa Capital Partners Llp | 0 | -100,00 | 0 | |||||
| 2026-02-13 | 13F | Walleye Trading LLC | Call | 369 200 | 341,10 | 4 375 | 313,13 | |||
| 2026-01-15 | 13F | Allspring Global Investments Holdings, LLC | 1 395 841 | 5,63 | 16 638 | -0,23 | ||||
| 2026-01-28 | 13F | DekaBank Deutsche Girozentrale | 30 000 | 0,00 | 1 | |||||
| 2026-02-13 | 13F | Walleye Trading LLC | Put | 197 900 | 380,34 | 2 345 | 350,10 | |||
| 2025-10-30 | 13F | Simplicity Wealth,LLC | 0 | -100,00 | 0 | -100,00 | ||||
| 2026-02-06 | 13F | EverSource Wealth Advisors, LLC | 2 059 | -11,29 | 24 | -17,24 | ||||
| 2026-02-12 | 13F | Scotia Capital Inc. | 0 | -100,00 | 0 | |||||
| 2025-11-13 | 13F | Riggs Asset Managment Co. Inc. | 0 | -100,00 | 0 | |||||
| 2026-02-13 | 13F | USS Investment Management Ltd | 894 094 | 0,00 | 10 591 | -6,40 | ||||
| 2026-02-12 | 13F | Marex Group plc | 122 937 | 198,22 | 1 457 | 288,27 | ||||
| 2026-02-13 | 13F | Flow Traders U.s. Llc | 22 715 | 87,60 | 0 | |||||
| 2026-02-12 | 13F | StoneX Group Inc. | 15 442 | 185 | ||||||
| 2025-10-31 | 13F | Whittier Trust Co | 0 | -100,00 | 0 | -100,00 | ||||
| 2026-01-23 | 13F | Westside Investment Management, Inc. | 745 | 5,67 | 9 | 0,00 | ||||
| 2026-02-17 | 13F | one8zero8, LLC | 70 273 | 17 468,25 | 833 | 20 700,00 | ||||
| 2026-02-17 | 13F | Advisory Services Network, LLC | 29 984 | 2 507,30 | 355 | 2 630,77 | ||||
| 2026-02-06 | 13F | Payden & Rygel | 10 210 | 0,00 | 0 | |||||
| 2025-09-25 | NP | VEU - Vanguard FTSE All-World ex-US Index Fund ETF Shares | 995 895 | 0,00 | 12 688 | 12,84 | ||||
| 2026-02-09 | 13F | Mondrian Investment Partners LTD | 12 655 094 | 14,09 | 149 963 | 6,79 | ||||
| 2026-01-30 | 13F | Camden Capital, LLC | 250 000 | 0,00 | 2 962 | -6,41 | ||||
| 2026-02-02 | 13F | Ping Capital Management, Inc. | 392 100 | 46,31 | 4 646 | 36,97 | ||||
| 2025-11-14 | 13F | Consultiva Wealth Management, Corp. | 0 | -100,00 | 0 | |||||
| 2025-09-26 | NP | RTNAX - Tax-Managed International Equity Fund Class A | 709 831 | 24,00 | 9 043 | 39,94 | ||||
| 2026-02-17 | 13F | Masters Capital Management Llc | 0 | -100,00 | 0 | |||||
| 2026-02-13 | 13F | First National Bank Of Omaha | 347 795 | 4 125 | ||||||
| 2026-02-20 | 13F | Larch Capital Partners Llc | 632 032 | 7 714 | ||||||
| 2025-09-26 | NP | EPIN - Harbor International Equity ETF | 4 296 | 55 | ||||||
| 2026-02-13 | 13F | Clear Street Group Inc. | 41 348 | 490 | ||||||
| 2025-09-24 | NP | IMRFX - Columbia Global Opportunities Fund Class A | 35 368 | 44,86 | 451 | 63,64 | ||||
| 2026-02-04 | 13F | Pensionmark Financial Group, Llc | 19 365 | 26,39 | 186 | -4,15 | ||||
| 2026-02-11 | 13F | Group One Trading, L.p. | 1 535 545 | 9,35 | 18 196 | 2,36 | ||||
| 2026-02-13 | 13F | Wealth Alliance | 48 125 | -6,43 | 570 | -12,44 | ||||
| 2026-01-14 | 13F | Generali Investments CEE, investicni spolecnost, a.s. | 149 600 | -2,48 | 1 773 | -8,75 | ||||
| 2026-02-11 | 13F | Group One Trading, L.p. | Call | 2 074 400 | 51,48 | 24 582 | 41,79 | |||
| 2026-02-17 | 13F | Public Employees Retirement System Of Ohio | 1 645 932 | 1,62 | 19 504 | -4,88 | ||||
| 2026-02-13 | 13F | Resources Investment Advisors, LLC. | 10 874 | -10,73 | 129 | -16,88 | ||||
| 2026-02-17 | 13F | Banco Bilbao Vizcaya Argentaria, S.a. | 0 | -100,00 | 0 | |||||
| 2026-01-21 | 13F | SJS Investment Consulting Inc. | 659 | 0,92 | 8 | -12,50 | ||||
| 2026-02-11 | 13F | Group One Trading, L.p. | Put | 139 000 | -92,83 | 1 567 | -93,62 | |||
| 2025-09-26 | NP | FSGEX - Fidelity Series Global ex U.S. Index Fund This fund is a listed as child fund of Fmr Llc and if that institution has disclosed ownership in this security, then these positions will not be double counted when calculating total shares and total value | 9 | 0,00 | 0 | |||||
| 2026-02-11 | 13F | Comprehensive Financial Planning, Inc./PA | 100 | 1 | ||||||
| 2026-02-06 | 13F | Lsv Asset Management | 22 000 | 0,00 | 0 | |||||
| 2026-02-04 | 13F | HighPoint Advisor Group LLC | 0 | -100,00 | 0 | |||||
| 2026-02-13 | 13F | Sei Investments Co | 3 172 343 | 8,12 | 37 592 | 1,21 | ||||
| 2025-11-05 | 13F | Fullcircle Wealth Llc | 0 | -100,00 | 0 | |||||
| 2026-01-07 | 13F | Sovereign Financial Group, Inc. | 10 617 | 0,00 | 126 | -6,72 | ||||
| 2026-02-11 | 13F | Ameraudi Asset Management, Inc. | 13 850 | 0,00 | 164 | -6,29 | ||||
| 2026-02-03 | 13F | We Are One Seven, LLC | 56 274 | 10,62 | 667 | 3,42 | ||||
| 2026-02-18 | 13F/A | Empowered Funds, LLC | 17 079 | 39,53 | 202 | 31,17 | ||||
| 2026-02-17 | 13F | Advisor Group Holdings, Inc. | 194 642 | -32,39 | 2 306 | -36,07 | ||||
| 2026-02-11 | 13F | Simplex Trading, Llc | Call | 0 | -100,00 | 0 | ||||
| 2026-02-13 | 13F | Dodge & Cox | 31 200 | -4,59 | 370 | -10,65 | ||||
| 2026-02-11 | 13F | Simplex Trading, Llc | 0 | -100,00 | 0 | |||||
| 2025-10-16 | 13F | Kingstone Capital Partners Texas, LLC | 0 | -100,00 | 0 | -100,00 | ||||
| 2026-01-28 | 13F | Retirement Planning Co of New England, Inc. | 48 376 | 15,46 | 573 | 8,11 | ||||
| 2026-02-09 | 13F | Huntington National Bank | 5 695 | -2,50 | 67 | -8,22 | ||||
| 2026-02-11 | 13F | Simplex Trading, Llc | Put | 0 | -100,00 | 0 | ||||
| 2026-02-12 | 13F | SWAN Capital LLC | 350 | 0,00 | 4 | 0,00 | ||||
| 2026-01-22 | 13F | Massachusetts Financial Services Co /ma/ | 9 664 426 | -11,90 | 114 523 | -17,54 | ||||
| 2026-01-26 | 13F | Ckw Financial Group | 59 | 0,00 | 0 | |||||
| 2026-02-11 | 13F | Capital International Investors | 30 637 308 | 51,58 | 363 052 | 41,88 | ||||
| 2026-02-03 | 13F | Anfield Capital Management, LLC | 7 322 | 0,00 | 87 | -6,52 | ||||
| 2025-09-25 | NP | TWAAX - Thrivent International Allocation Fund Class A | 14 110 | 90,16 | 180 | 115,66 | ||||
| 2026-01-27 | 13F | GHP Investment Advisors, Inc. | 2 164 | 26 | ||||||
| 2026-02-12 | 13F | Hollencrest Capital Management | 28 | 0,00 | 0 | |||||
| 2026-02-19 | 13F | Atomi Financial Group, Inc. | 48 415 | -3,30 | 574 | -9,48 | ||||
| 2026-02-17 | 13F | Brevan Howard Capital Management LP | 0 | -100,00 | 0 | |||||
| 2026-02-13 | 13F | Rhumbline Advisers | 99 156 | -8,08 | 1 175 | -13,99 | ||||
| 2026-02-18 | 13F | Beacon Pointe Advisors, LLC | 23 289 | -36,52 | 276 | -40,73 | ||||
| 2026-02-04 | 13F | Summit Wealth Group Llc / Co | 0 | -100,00 | 0 | |||||
| 2025-09-25 | NP | Elevation Series Trust - The Opal International Dividend Income ETF | 231 416 | 16,91 | 2 948 | 31,96 | ||||
| 2026-02-17 | 13F | Farringdon Capital, Ltd. | 49 661 | -69,32 | 588 | -71,29 | ||||
| 2026-02-13 | 13F | Macquarie Group Ltd | 0 | -100,00 | 0 | |||||
| 2026-02-11 | 13F | Fore Capital, LLC | 80 000 | 948 | ||||||
| 2026-02-13 | 13F | Transamerica Financial Advisors, Inc. | 1 797 | 21 | ||||||
| 2026-02-17 | 13F | Voloridge Investment Management, Llc | 1 633 914 | -31,71 | 19 362 | -36,08 | ||||
| 2025-09-26 | NP | FTCEX - Fidelity Total International Equity Fund Fidelity Advisor Total International Equity Fund: Class C This fund is a listed as child fund of Fmr Llc and if that institution has disclosed ownership in this security, then these positions will not be double counted when calculating total shares and total value | 199 183 | 4,68 | 2 538 | 18,11 | ||||
| 2026-02-10 | 13F | Acadian Asset Management Llc | 57 234 | 141,76 | 1 | |||||
| 2026-02-17 | 13F | Fearnley Asset Management As | 399 595 | 17 590 | ||||||
| 2026-02-12 | 13F | CoreCommodity Management, LLC | 12 064 | 0,00 | 143 | -6,58 | ||||
| 2026-02-11 | 13F | Accuvest Global Advisors | 27 250 | 323 | ||||||
| 2026-02-17 | 13F | Stokes Family Office, LLC | 10 271 | 2,71 | 122 | -3,97 | ||||
| 2026-02-17 | 13F | Qube Research & Technologies Ltd | 909 787 | -30,13 | 10 781 | -34,60 | ||||
| 2026-02-02 | 13F | Chung Wu Investment Group, LLC | 3 000 | 0,00 | 36 | -5,41 | ||||
| 2026-02-17 | 13F | Capital Fund Management S.a. | 176 798 | 95,17 | 2 095 | 82,81 | ||||
| 2026-02-13 | 13F | Y-Intercept (Hong Kong) Ltd | 1 654 678 | 7,28 | 19 608 | 0,41 | ||||
| 2026-02-11 | 13F | Janney Montgomery Scott LLC | 32 965 | 4,77 | 0 | |||||
| 2026-01-15 | 13F | Founders Capital Management | 5 000 | 0,00 | 59 | -6,35 | ||||
| 2025-11-14 | 13F | AXA Investment Managers S.A. | 144 159 | 1 825 | ||||||
| 2026-01-06 | 13F | Investors Research Corp | 1 034 | -6,76 | 12 | -14,29 | ||||
| 2026-01-14 | 13F | Wolff Wiese Magana Llc | 5 000 | 0,00 | 59 | -6,35 | ||||
| 2025-09-25 | NP | DEHP - Dimensional Emerging Markets High Profitability ETF | 15 308 | 89,93 | 195 | 116,67 | ||||
| 2026-02-04 | 13F | Legacy Financial Advisors, Inc. | 0 | -100,00 | 0 | |||||
| 2026-02-17 | 13F | Cetera Investment Advisers | 434 723 | -4,76 | 5 151 | -10,85 | ||||
| 2026-02-12 | 13F | Campbell & CO Investment Adviser LLC | 63 510 | -48,50 | 753 | -51,83 | ||||
| 2026-02-13 | 13F | Cohen & Steers, Inc. | 289 410 | 51,97 | 3 | 50,00 | ||||
| 2025-09-26 | NP | UUPIX - Ultraemerging Markets Profund Investor Class | 9 082 | 18,49 | 116 | 33,72 | ||||
| 2026-02-13 | 13F | Capula Management Ltd | 164 470 | 1 949 | ||||||
| 2026-02-13 | 13F | Walleye Capital LLC | Call | 93 500 | 734,82 | 1 108 | 685,11 | |||
| 2026-02-13 | 13F | Walleye Capital LLC | Put | 99 300 | 204,60 | 1 177 | 185,44 | |||
| 2026-02-13 | 13F | Walleye Capital LLC | 154 783 | 19,77 | 1 834 | 12,10 | ||||
| 2026-01-28 | 13F | Atwood & Palmer Inc | 327 | 0,00 | 4 | -25,00 | ||||
| 2025-11-14 | 13F | Point72 Europe (London) LLP | 945 166 | -26,23 | 11 966 | -25,34 | ||||
| 2026-02-13 | 13F | Integrated Wealth Concepts LLC | 57 199 | -7,31 | 678 | -13,32 | ||||
| 2026-01-14 | 13F | TrueMark Investments, LLC | 291 680 | 14,95 | 3 456 | 7,60 | ||||
| 2026-02-13 | 13F | SRS Capital Advisors, Inc. | 9 241 | 47,31 | 110 | 37,97 | ||||
| 2026-02-09 | 13F | MQS Management LLC | 16 771 | 199 | ||||||
| 2026-02-17 | 13F | Cape Investment Advisory, Inc. | 229 | 3 | ||||||
| 2026-02-04 | 13F | Nwam Llc | 25 811 | -4,82 | 370 | 16,72 | ||||
| 2026-02-05 | 13F | Elyxium Wealth, LLC | 1 525 | 18 | ||||||
| 2026-01-30 | 13F | R Squared Ltd | 43 842 | 10,28 | 520 | 3,18 | ||||
| 2026-02-13 | 13F | BNP Paribas Asset Management Holding S.A. | 154 320 | 2 | ||||||
| 2025-09-25 | NP | DFEV - Dimensional Emerging Markets Value ETF | 247 256 | 3 150 | ||||||
| 2026-02-12 | 13F | North of South Capital LLP | 265 853 | -6,84 | 3 150 | -12,79 | ||||
| 2026-01-05 | 13F | Rosenberg Matthew Hamilton | 1 447 | 0,00 | 17 | -5,56 | ||||
| 2026-02-11 | 13F | Erste Asset Management GmbH | 0 | 0 | ||||||
| 2026-02-12 | 13F | ICICI Prudential Asset Management Co Ltd | 0 | -100,00 | 0 | |||||
| 2026-02-05 | 13F | Stephens Inc /ar/ | 41 714 | 494 | ||||||
| 2026-02-11 | 13F | Parallel Advisors, LLC | 22 125 | -5,60 | 262 | -11,49 | ||||
| 2026-02-17 | 13F | Tower Research Capital LLC (TRC) | 819 | 8,76 | 10 | 0,00 | ||||
| 2026-02-13 | 13F | Kestra Advisory Services, LLC | 0 | -100,00 | 0 | |||||
| 2025-09-25 | NP | EEMGX - MFS Emerging Markets Equity Research Fund R4 | 1 412 | 80,10 | 18 | 112,50 | ||||
| 2026-01-26 | 13F | Drum Hill Capital, LLC | 131 646 | -0,95 | 1 560 | -7,25 | ||||
| 2025-10-30 | 13F | Ridgewood Investments LLC | 74 910 | 59,09 | 656 | 11,21 | ||||
| 2026-02-10 | 13F | Goldman Sachs Group Inc | Put | 2 295 000 | 70,63 | 27 196 | 59,72 | |||
| 2026-01-05 | 13F | Park Avenue Securities Llc | 19 738 | 7,96 | 0 | |||||
| 2026-02-13 | 13F | Colony Group, LLC | 43 544 | 30,83 | 519 | 23,28 | ||||
| 2026-02-17 | 13F | Virtus Investment Advisers, Inc. | 0 | -100,00 | 0 | |||||
| 2026-02-06 | 13F | HighTower Advisors, LLC | 123 418 | 19,92 | 1 463 | 12,29 | ||||
| 2026-02-10 | 13F | Goldman Sachs Group Inc | Call | 2 070 000 | 0,00 | 24 530 | -6,40 | |||
| 2026-02-17 | 13F | Laird Norton Trust Company, Llc | 52 156 | 637 | ||||||
| 2026-02-10 | 13F | Goldman Sachs Group Inc | 13 016 686 | 93,94 | 154 248 | 81,54 | ||||
| 2026-02-12 | 13F | Steward Partners Investment Advisory, Llc | 96 646 | -17,70 | 1 145 | -22,95 | ||||
| 2026-01-09 | 13F | Park Place Capital Corp | 884 | 0,00 | 10 | -9,09 | ||||
| 2026-01-13 | 13F | Kathmere Capital Management, LLC | 35 496 | -11,13 | 421 | -16,83 | ||||
| 2026-01-29 | 13F | UMA Financial Services, Inc. | 65 | 1 | ||||||
| 2026-02-11 | 13F | Ramirez Asset Management, Inc. | 87 | 1 | ||||||
| 2026-02-13 | 13F | Natixis | 160 063 | 83,04 | 1 897 | 71,27 | ||||
| 2026-02-17 | 13F | Cresset Asset Management, LLC | 0 | -100,00 | 0 | |||||
| 2026-02-17 | 13F | Capital Fund Management S.a. | Call | 345 100 | -0,35 | 4 089 | -6,73 | |||
| 2026-02-06 | 13F | Radnor Capital Management, LLC | 16 300 | -58,52 | 193 | -61,17 | ||||
| 2026-02-13 | 13F | Evelyn Partners Investment Management LLP | 650 | 0,00 | 8 | -12,50 | ||||
| 2026-02-06 | 13F | Pnc Financial Services Group, Inc. | 56 034 | 35,66 | 664 | 27,20 | ||||
| 2026-02-11 | 13F | Cerity Partners LLC | 67 744 | 67,43 | 803 | 56,64 | ||||
| 2025-11-12 | 13F | Quantbot Technologies LP | 0 | -100,00 | 0 | -100,00 | ||||
| 2026-01-28 | 13F | Geneos Wealth Management Inc. | 2 000 | 0,00 | 24 | -8,00 | ||||
| 2026-02-17 | 13F | Capital Fund Management S.a. | Put | 200 300 | 9,16 | 2 374 | 2,15 | |||
| 2026-02-09 | 13F | Harbour Investments, Inc. | 1 256 | 0,00 | 15 | -6,67 | ||||
| 2026-02-12 | 13F | JBF Capital, Inc. | 62 000 | 3,33 | 699 | -1,55 | ||||
| 2025-09-23 | NP | VVIFX - Voya VACS Series EME Fund | 130 950 | -23,93 | 1 668 | -14,15 | ||||
| 2026-02-17 | 13F | Jump Financial, LLC | 774 182 | 389,99 | 9 174 | 358,70 | ||||
| 2026-01-15 | 13F | Highline Wealth Partners Llc | 1 053 | 18,45 | 12 | 9,09 | ||||
| 2026-02-04 | 13F | D'Orazio & Associates, Inc. | 12 498 | -14,43 | 148 | -19,57 | ||||
| 2026-02-12 | 13F | BlackRock, Inc. | 11 573 196 | 3,67 | 137 142 | -2,96 | ||||
| 2026-02-11 | 13F | Capital Wealth Planning, LLC | 257 372 | 37,62 | 3 068 | 29,57 | ||||
| 2026-02-05 | 13F | May Hill Capital, LLC | 0 | -100,00 | 0 | |||||
| 2026-03-06 | 13F | Hsbc Holdings Plc | Call | 0 | -100,00 | 0 | ||||
| 2026-03-06 | 13F | Hsbc Holdings Plc | Put | 0 | -100,00 | 0 | ||||
| 2026-02-13 | 13F | Vontobel Holding Ltd. | 85 551 | 98,69 | 1 014 | 85,87 | ||||
| 2025-10-08 | 13F | Retirement Wealth Solutions LLC | 0 | -100,00 | 0 | -100,00 | ||||
| 2025-11-13 | 13F | Eisler Capital Management Ltd. | 0 | -100,00 | 0 | -100,00 | ||||
| 2026-01-27 | 13F | BankPlus Trust Department | 44 000 | 521 | ||||||
| 2025-10-30 | 13F | Twin Peaks Wealth Advisors, LLC | 0 | -100,00 | 0 | |||||
| 2026-02-17 | 13F | SageView Advisory Group, LLC | 725 | 9 | ||||||
| 2026-01-16 | 13F | Standard Life Aberdeen plc | 608 893 | 112,85 | 7 215 | 96,27 | ||||
| 2026-02-13 | 13F | Inspire Advisors, LLC | 11 502 | 0,75 | 136 | -5,56 | ||||
| 2026-02-13 | 13F | Citigroup Inc | 1 738 958 | 80,30 | 20 607 | 68,76 | ||||
| 2026-02-13 | 13F | Citigroup Inc | Call | 977 800 | 14,31 | 11 587 | 6,99 | |||
| 2025-11-13 | 13F | Total Investment Management Inc | 0 | -100,00 | 0 | |||||
| 2025-09-25 | NP | IPAYX - Integrity Dividend Summit Fund Class I | 23 000 | 0,00 | 293 | 13,13 | ||||
| 2026-01-22 | 13F | Lesa Sroufe & Co | 288 600 | -8,09 | 3 | 0,00 | ||||
| 2026-02-13 | 13F | Citigroup Inc | Put | 2 435 000 | 14,32 | 28 855 | 7,01 | |||
| 2026-02-17 | 13F | Quantitative Investment Management, LLC | 0 | -100,00 | 0 | |||||
| 2026-01-12 | 13F | Seacrest Wealth Management, Llc | 66 311 | 21,77 | 765 | 15,21 | ||||
| 2026-01-30 | 13F | Sigma Planning Corp | 27 179 | -3,36 | 325 | -9,22 | ||||
| 2026-01-29 | 13F | Nbc Securities, Inc. | 1 063 | 1,14 | 13 | -14,29 | ||||
| 2026-01-30 | 13F | ARGA Investment Management, LP | 18 975 177 | 0,89 | 224 856 | -5,57 | ||||
| 2026-02-17 | 13F | CWM Advisors, LLC | 6 488 | 77 | ||||||
| 2026-01-23 | 13F | Nbt Bank N A /ny | 2 000 | 0,00 | 24 | -8,00 | ||||
| 2025-09-25 | NP | DAADX - Emerging Markets ex China Core Equity Portfolio Institutional Class | 0 | -100,00 | 0 | -100,00 | ||||
| 2026-01-07 | 13F | St. Louis Financial Planners Asset Management, LLC | 0 | -100,00 | 0 | |||||
| 2025-10-30 | 13F | Mizuho Securities Co. Ltd. | 0 | -100,00 | 0 | |||||
| 2026-02-12 | 13F | Provida Pension Fund Administrator | 0 | -100,00 | 0 | |||||
| 2026-02-10 | 13F | State of Wyoming | 59 672 | 1,93 | 707 | -4,59 | ||||
| 2026-02-11 | 13F | Winton Capital Group Ltd | 86 000 | 1 019 | ||||||
| 2026-02-12 | 13F | Groupe la Francaise | 0 | -100,00 | 0 | |||||
| 2026-02-11 | 13F | Longfellow Investment Management Co Llc | 182 307 | -13,28 | 2 160 | -18,83 | ||||
| 2026-02-17 | 13F | Signature Equity Partners, LLC | 227 | 3 | ||||||
| 2026-02-13 | 13F | Verition Fund Management LLC | 0 | -100,00 | 0 | -100,00 | ||||
| 2026-02-09 | 13F/A | Fideuram - Intesa Sanpaolo Private Banking S.p.a. | 282 562 | 3 348 | ||||||
| 2026-02-13 | 13F | Stifel Financial Corp | 248 079 | 32,71 | 2 940 | 24,22 | ||||
| 2025-09-25 | NP | Thrivent Core Funds - Thrivent Core Emerging Markets Equity Fund | 104 169 | 90,97 | 1 327 | 115,77 | ||||
| 2026-01-20 | 13F | Stratos Wealth Advisors, LLC | 0 | -100,00 | 0 | |||||
| 2026-02-18 | 13F | EP Wealth Advisors, Inc. | 0 | -100,00 | 0 | |||||
| 2026-01-15 | 13F | Shrier Wealth Management, Llc | 48 104 | 570 | ||||||
| 2025-10-22 | 13F | Hennion & Walsh Asset Management, Inc. | 0 | -100,00 | 0 | -100,00 | ||||
| 2025-09-29 | NP | TIIV - AAM Todd International Intrinsic Value ETF | 23 169 | 295 | ||||||
| 2026-02-12 | 13F | Principal Securities, Inc. | 36 379 | 27,78 | 431 | 19,72 | ||||
| 2026-01-26 | 13F | Annex Advisory Services, LLC | 2 108 579 | 5,73 | 24 987 | -1,03 | ||||
| 2025-11-14 | 13F | Sofos Investments, Inc. | 0 | -100,00 | 0 | |||||
| 2026-01-20 | 13F | Signaturefd, Llc | 31 038 | 6,58 | 368 | -0,27 | ||||
| 2026-02-06 | 13F | Profund Advisors Llc | 92 364 | 10,34 | 1 095 | 3,31 | ||||
| 2026-02-05 | 13F | Bessemer Group Inc | 13 746 | -1,11 | 0 | |||||
| 2026-02-05 | 13F | Allworth Financial LP | 12 248 | 0,60 | 145 | -5,84 | ||||
| 2025-11-14 | 13F | Binnacle Investments Inc | 634 | -5,65 | 8 | 0,00 | ||||
| 2026-02-09 | 13F | Beck Bode, LLC | Call | 0 | -100,00 | 0 | -100,00 | |||
| 2025-09-26 | NP | PCEMX - PACE International Emerging Markets Equity Investments Class P | 364 545 | 0,51 | 4 644 | 13,43 | ||||
| 2026-01-15 | 13F | Lodestone Wealth Management LLC | 1 | 0 | ||||||
| 2026-02-11 | 13F | West Family Investments, Inc. | 21 406 | -22,13 | 254 | -27,30 | ||||
| 2026-02-17 | 13F | Tudor Investment Corp Et Al | Put | 22 500 | -34,21 | 267 | -38,43 | |||
| 2026-02-17 | 13F | Tudor Investment Corp Et Al | Call | 35 500 | 85,86 | 421 | 74,27 | |||
| 2025-09-25 | NP | SEMVX - Hartford Schroders Emerging Markets Equity Fund Class A | 4 629 234 | 6,59 | 58 976 | 20,28 | ||||
| 2026-02-13 | 13F | Verition Fund Management LLC | Put | 500 600 | 0,00 | 5 932 | -6,39 | |||
| 2025-09-26 | NP | MSTSX - Morningstar Unconstrained Allocation Fund | 69 278 | 15,22 | 883 | 30,09 | ||||
| 2026-02-12 | 13F | Renaissance Technologies Llc | 9 555 200 | -9,41 | 113 229 | -15,20 | ||||
| 2026-01-30 | 13F | Cullinan Associates Inc | 33 200 | 0,00 | 393 | -6,43 | ||||
| 2026-02-13 | 13F | Cloverfields Capital Group, Lp | 226 694 | 1,53 | 2 686 | -4,95 | ||||
| 2026-02-09 | 13F | Todd Asset Management Llc | 3 059 639 | -2,47 | 36 257 | -8,71 | ||||
| 2025-09-25 | NP | PRIJX - T. Rowe Price Emerging Markets Discovery Stock Fund This fund is a listed as child fund of Price T Rowe Associates Inc /md/ and if that institution has disclosed ownership in this security, then these positions will not be double counted when calculating total shares and total value | 2 240 600 | 28 545 | ||||||
| 2026-02-11 | 13F | Metis Global Partners, LLC | 111 668 | 1,76 | 1 323 | -4,75 | ||||
| 2026-01-16 | 13F | Ronald Blue Trust, Inc. | 27 048 | -18,21 | 321 | -23,44 | ||||
| 2026-02-12 | 13F | Federation des caisses Desjardins du Quebec | 23 150 | -79,13 | 274 | -80,48 | ||||
| 2026-02-17 | 13F | Old West Investment Management, LLC | 78 040 | 925 | ||||||
| 2025-09-25 | NP | EMGAX - Wells Fargo Emerging Markets Equity Fund Class A | 522 079 | 0,00 | 6 651 | 12,84 | ||||
| 2026-02-06 | 13F | New Millennium Group LLC | 13 246 | 185,23 | 157 | 168,97 | ||||
| 2026-02-10 | 13F | Nomura Asset Management Co Ltd | 29 762 | -50,96 | 353 | -54,17 | ||||
| 2026-02-17 | 13F | Nomura Holdings Inc | 94 508 | 28,22 | 1 120 | 19,94 | ||||
| 2026-01-23 | 13F | Rsm Us Wealth Management Llc | 11 377 | -18,26 | 135 | -23,86 | ||||
| 2026-02-17 | 13F | Nomura Holdings Inc | Put | 95 000 | 0,00 | 1 126 | -6,41 | |||
| 2026-02-10 | 13F | Connor, Clark & Lunn Investment Management Ltd. | 120 783 | 1 431 | ||||||
| 2026-02-13 | 13F | Barclays Plc | Put | 0 | -100,00 | 0 | ||||
| 2026-02-11 | 13F | J.Safra Asset Management Corp | 27 797 | 98,59 | 329 | 85,88 | ||||
| 2026-02-10 | 13F | Bank of New York Mellon Corp | 92 146 | 0,20 | 1 092 | -6,27 | ||||
| 2026-01-30 | 13F | Pekin Hardy Strauss, Inc. | 42 352 | 32,96 | 502 | 24,32 | ||||
| 2026-02-12 | 13F | Barings Llc | 73 545 | 0,00 | 872 | -6,44 | ||||
| 2026-02-13 | 13F | Pinnacle Wealth Planning Services, Inc. | 2 159 | 26 | ||||||
| 2026-02-17 | 13F | SummitTX Capital, L.P. | 64 220 | 340,38 | 761 | 313,59 | ||||
| 2026-01-29 | 13F | Obermeyer Wood Investment Counsel, Lllp | 18 423 | -58,74 | 218 | -61,42 | ||||
| 2026-02-24 | 13F | DGS Capital Management, LLC | 24 067 | -47,83 | 285 | -51,20 | ||||
| 2026-02-02 | 13F | Oppenheimer & Co Inc | 0 | -100,00 | 0 | |||||
| 2026-02-11 | 13F | Capital International Sarl | 39 177 | 0,00 | 464 | -6,26 | ||||
| 2026-02-17 | 13F | Sagefield Capital LP | 433 731 | 354,04 | 5 140 | 325,06 | ||||
| 2026-01-29 | 13F | RMG Wealth Management LLC | 10 | 0,00 | 0 | |||||
| 2026-02-13 | 13F | Umb Bank N A/mo | 0 | -100,00 | 0 | -100,00 | ||||
| 2026-01-21 | 13F | Westfuller Advisors, LLC | 6 888 | -0,88 | 84 | -5,62 | ||||
| 2026-02-17 | 13F | Schonfeld Strategic Advisors LLC | 116 030 | -50,80 | 1 375 | -53,97 | ||||
| 2026-02-13 | 13F/A | Virtus ETF Advisers LLC | 0 | -100,00 | 0 | |||||
| 2026-02-09 | 13F | Employees Retirement System of Texas | 65 509 | -69,83 | 1 | -100,00 | ||||
| 2026-02-17 | 13F | Abel Hall, LLC | 20 500 | 0,00 | 243 | -6,56 | ||||
| 2025-11-06 | 13F | Ameritas Advisory Services, LLC | 0 | -100,00 | 0 | -100,00 | ||||
| 2026-02-05 | 13F | Tucker Asset Management Llc | 50 | 1 | ||||||
| 2026-02-05 | 13F | Td Private Client Wealth Llc | 21 902 | -1,82 | 260 | -8,16 | ||||
| 2026-01-22 | 13F | HHM Wealth Advisors, LLC | 500 | 0,00 | 6 | -16,67 | ||||
| 2025-09-26 | NP | INVESCO ACTIVELY MANAGED EXCHANGE-TRADED FUND TRUST - Invesco Global Equity Net Zero ETF | 6 564 | 84 | ||||||
| 2026-02-14 | 13F | Rockefeller Capital Management L.P. | 23 986 | 42,86 | 284 | 33,96 | ||||
| 2026-01-26 | 13F | SeaBridge Investment Advisors LLC | 0 | -100,00 | 0 | -100,00 | ||||
| 2026-02-17 | 13F | Wiley Bros.-aintree Capital, Llc | 31 298 | 36,15 | 371 | 26,28 | ||||
| 2026-02-05 | 13F | Blume Capital Management, Inc. | 300 | 0,00 | 4 | 0,00 | ||||
| 2026-02-06 | 13F | Kilter Group LLC | 0 | -100,00 | 0 | |||||
| 2026-02-02 | 13F | Fifth Third Bancorp | 43 162 | -6,25 | 511 | -12,20 | ||||
| 2026-01-23 | 13F | Ritholtz Wealth Management | 183 891 | -6,95 | 2 179 | -12,87 | ||||
| 2026-01-27 | 13F | Regions Financial Corp | 53 799 | -2,01 | 638 | -8,35 | ||||
| 2026-02-17 | 13F | Warren Averett Asset Management, LLC | 14 735 | 25,00 | 175 | 16,78 | ||||
| 2025-09-24 | NP | EMQAX - Ashmore Emerging Markets Active Equity Fund CLASS A | 0 | -100,00 | 0 | -100,00 | ||||
| 2026-02-09 | 13F | Fisher Asset Management, LLC | 13 982 981 | -2,18 | 165 698 | -8,44 | ||||
| 2026-02-13 | 13F | VPR Management LLC | 132 846 | 0,00 | 1 574 | -6,37 | ||||
| 2026-02-17 | 13F | Ameriprise Financial Inc | 3 775 081 | 7,19 | 44 742 | 0,34 | ||||
| 2026-02-12 | 13F | Advisors Asset Management, Inc. | 179 867 | 13,45 | 2 131 | 6,18 | ||||
| 2026-01-29 | 13F | Nbc Securities, Inc. | Put | 10 | 1 | |||||
| 2026-02-10 | 13F | Avestar Capital, LLC | 14 523 | -40,31 | 172 | -44,16 | ||||
| 2026-01-29 | 13F | Sava Infond d.o.o. | 23 000 | 0,00 | 273 | -6,53 | ||||
| 2026-01-21 | 13F | Provident Living Financial Services, Inc. | 88 360 | 1 047 | ||||||
| 2026-01-28 | 13F | Cranbrook Wealth Management, LLC | 600 | 0,00 | 7 | 0,00 | ||||
| 2026-01-20 | 13F | Perpetual Ltd | 3 313 257 | 0,55 | 39 262 | -5,88 | ||||
| 2026-02-17 | 13F | Wellington Management Group Llp | 935 559 | 40,12 | 11 086 | 31,15 | ||||
| 2026-02-28 | 13F | Corecam Pte. Ltd. | 12 111 | 0,00 | 144 | -6,54 | ||||
| 2026-01-08 | 13F | Tuttle Tactical Management LLC | 23 055 | 273 | ||||||
| 2026-02-17 | 13F | Redwood Park Advisors LLC | 6 818 | 60,50 | 81 | 50,94 | ||||
| 2026-01-08 | 13F | Wealth Enhancement Advisory Services, Llc | 79 806 | -9,15 | 923 | -14,38 | ||||
| 2025-11-14 | 13F | Wetherby Asset Management Inc | 38 247 | -4,98 | 484 | -3,78 | ||||
| 2026-02-13 | 13F | Blueshift Asset Management, LLC | 0 | -100,00 | 0 | |||||
| 2026-02-20 | 13F | Sunbelt Securities, Inc. | 6 | 0,00 | 0 | |||||
| 2026-02-10 | 13F | Natixis Advisors, L.p. | 1 231 385 | -6,68 | 15 | -12,50 | ||||
| 2026-01-27 | 13F | Zurcher Kantonalbank (Zurich Cantonalbank) | 58 400 | -2,33 | 692 | -8,47 | ||||
| 2026-02-13 | 13F | Aigen Investment Management, Lp | 0 | -100,00 | 0 | |||||
| 2025-11-14 | 13F | Mount Yale Investment Advisors, LLC | 0 | -100,00 | 0 | -100,00 | ||||
| 2025-10-22 | 13F | D.a. Davidson & Co. | 0 | -100,00 | 0 | -100,00 | ||||
| 2026-02-18 | 13F | GWM Advisors LLC | 12 668 | -5,09 | 150 | -10,71 | ||||
| 2026-02-17 | 13F | EFG International AG | 36 790 | 436 | ||||||
| 2026-01-22 | 13F | City Holding Co | 6 773 | 0,00 | 80 | -5,88 | ||||
| 2026-02-12 | 13F | Sprott Inc. | 0 | -100,00 | 0 | |||||
| 2026-02-05 | 13F | Everstar Asset Management, LLC | 13 177 | 17,94 | 156 | 10,64 | ||||
| 2025-09-25 | NP | DEXC - Dimensional Emerging Markets ex China Core Equity ETF | 57 550 | 18,78 | 733 | 34,00 | ||||
| 2026-02-05 | 13F | Atria Investments Llc | 25 140 | 0,89 | 298 | -5,71 | ||||
| 2026-02-20 | 13F/A | CMT Capital Markets Trading GmbH | 31 702 | -79,09 | 0 | -100,00 | ||||
| 2026-02-13 | 13F | Nfj Investment Group, Llc | 130 | 0,00 | 2 | 0,00 | ||||
| 2026-02-17 | 13F | Delaware Management Holdings, Inc. | 1 759 423 | 20 849 | ||||||
| 2025-11-14 | 13F | XTX Topco Ltd | 0 | -100,00 | 0 | -100,00 | ||||
| 2026-02-13 | 13F | Absolute Gestao de Investimentos Ltda. | 72 841 | 863 | ||||||
| 2026-02-17 | 13F | Rwc Asset Advisors (us) Llc | 0 | -100,00 | 0 | |||||
| 2026-02-12 | 13F | Rossby Financial, LCC | 11 798 | 9,16 | 140 | 2,21 | ||||
| 2026-02-12 | 13F | Skopos Labs, Inc. | 52 920 | 132,02 | 613 | 117,38 | ||||
| 2026-02-13 | 13F | Candriam Luxembourg S.C.A. | 25 741 | 0,00 | 305 | -6,15 | ||||
| 2026-02-03 | 13F | Lumbard & Kellner, LLC | 707 365 | 39,29 | 8 382 | 30,38 | ||||
| 2025-09-29 | NP | VRAI - Virtus Real Asset Income ETF | 13 126 | 19,38 | 167 | 34,68 | ||||
| 2025-11-25 | 13F | Alexander Labrunerie & Co., Inc. | 10 050 | 0,00 | 127 | 1,60 | ||||
| 2025-10-30 | 13F | Migdal Insurance & Financial Holdings Ltd. | 0 | -100,00 | 0 | |||||
| 2025-11-14 | 13F | Parallax Volatility Advisers, L.P. | 0 | -100,00 | 0 | -100,00 | ||||
| 2025-09-25 | NP | VMMSX - Vanguard Emerging Markets Select Stock Fund Investor Shares | 474 901 | -13,32 | 6 050 | -2,18 | ||||
| 2026-01-28 | 13F | WPG Advisers, LLC | 144 | 0,00 | 2 | 0,00 | ||||
| 2026-02-13 | 13F | MAI Capital Management | 3 945 | -15,78 | 47 | -22,03 | ||||
| 2025-11-14 | 13F | Vennlight Capital Management, LP | 0 | -100,00 | 0 | -100,00 | ||||
| 2025-09-25 | NP | MFWTX - MFS Global Total Return Fund A | 151 477 | -1,24 | 1 930 | 11,44 | ||||
| 2026-02-11 | 13F | J.w. Cole Advisors, Inc. | 12 671 | -9,19 | 102 | -42,61 | ||||
| 2025-11-13 | 13F | Contrarian Capital Management, L.l.c. | 0 | -100,00 | 0 | -100,00 | ||||
| 2025-09-25 | NP | Dimensional Emerging Markets Value Fund - Dimensional Emerging Markets Value Fund This fund is a listed as child fund of Dimensional Fund Advisors Lp and if that institution has disclosed ownership in this security, then these positions will not be double counted when calculating total shares and total value | 1 849 041 | 0,00 | 23 557 | 12,84 | ||||
| 2025-09-29 | NP | MPEMX - MONDRIAN EMERGING MARKETS VALUE EQUITY FUND | 35 064 | 5,43 | 447 | 18,93 | ||||
| 2026-01-08 | 13F | Brave Asset Management Inc | 0 | -100,00 | 0 | |||||
| 2026-02-13 | 13F | Caitong International Asset Management Co., Ltd | 8 351 | 924,66 | 99 | 880,00 | ||||
| 2026-01-22 | 13F | Financial Consulate, Inc | 45 | 1 | ||||||
| 2026-02-17 | 13F | Moneda S.A. Administradora General de Fondos | 394 281 | -12,12 | 4 672 | -10,53 | ||||
| 2026-02-13 | 13F | Itau Unibanco Holding S.A. | 19 828 159 | 146,57 | 234 171 | 130,02 | ||||
| 2026-02-19 | 13F | Invesco Ltd. | 27 974 691 | 55,29 | 331 500 | 45,35 | ||||
| 2026-01-15 | 13F | Foster & Motley Inc | 60 230 | -36,00 | 1 | -100,00 | ||||
| 2026-01-29 | 13F | UBS Group AG | 4 673 458 | 20,75 | 55 380 | 13,03 | ||||
| 2026-02-03 | 13F | International Assets Investment Management, Llc | 21 749 | 88,56 | 258 | 77,24 | ||||
| 2026-02-10 | 13F | Channing Global Advisors, Llc | 0 | -100,00 | 0 | |||||
| 2026-02-17 | 13F | Strategic Investment Advisors / MI | 13 741 | -18,31 | 163 | -23,58 | ||||
| 2026-02-09 | 13F | Fidelis Capital Partners, LLC | 0 | -100,00 | 0 | |||||
| 2026-02-10 | 13F | Eurizon Capital SGR S.p.A. | 83 759 | 992 | ||||||
| 2026-02-12 | 13F | New York State Common Retirement Fund | 2 579 822 | -4,54 | 30 571 | -10,65 | ||||
| 2026-01-27 | 13F | WealthCollab, LLC | 1 301 | -1,74 | 15 | -6,25 | ||||
| 2026-02-06 | 13F | Verde Servicos Internacionais S.A. | 2 400 | 0 | ||||||
| 2026-02-13 | 13F | NLB Skladi, upravljanje premozenja, d.o.o. | 312 384 | 3 702 | ||||||
| 2025-11-14 | 13F | Credit Agricole S A | 0 | -100,00 | 0 | |||||
| 2025-11-14 | 13F | Axa S.a. | 0 | -100,00 | 0 | |||||
| 2026-02-03 | 13F | NewEdge Wealth, LLC | 16 083 | -13,81 | 191 | -15,93 | ||||
| 2026-02-11 | 13F | BI Asset Management Fondsmaeglerselskab A/S | 0 | -100,00 | 0 | |||||
| 2026-01-07 | 13F | Sagespring Wealth Partners, Llc | 10 241 | -5,86 | 121 | -11,68 | ||||
| 2025-09-26 | NP | FAMKX - Fidelity Advisor Emerging Markets Fund Class A This fund is a listed as child fund of Fmr Llc and if that institution has disclosed ownership in this security, then these positions will not be double counted when calculating total shares and total value | 9 691 147 | -11,16 | 123 465 | 0,25 | ||||
| 2026-02-17 | 13F | Massar Capital Management, LP | 0 | -100,00 | 0 | |||||
| 2026-02-06 | 13F | Global Retirement Partners, LLC | 18 998 | -75,05 | 225 | -76,66 | ||||
| 2025-10-17 | 13F | Matthews International Capital Management Llc | 0 | -100,00 | 0 | -100,00 | ||||
| 2026-01-29 | 13F | UBS Group AG | Put | 3 530 900 | -2,75 | 41 841 | -8,98 | |||
| 2026-01-29 | 13F | UBS Group AG | Call | 10 211 190 | 8,05 | 121 003 | 1,13 | |||
| 2026-02-12 | 13F | Hudock, Inc. | 15 498 | 0,73 | 184 | -5,67 | ||||
| 2026-02-17 | 13F | Lazard Asset Management Llc | 23 170 764 | 7,42 | 274 574 | 0,55 | ||||
| 2026-01-15 | 13F | Nisa Investment Advisors, Llc | 1 500 | -31,82 | 19 | -35,71 | ||||
| 2026-02-17 | 13F | Price T Rowe Associates Inc /md/ | 10 389 475 | 51,54 | 123 | 43,02 | ||||
| 2026-02-13 | 13F | JustInvest LLC | 13 470 | 10,23 | 160 | 3,25 | ||||
| 2026-02-12 | 13F | Advocate Investing Services LLC | 12 400 | 147 | ||||||
| 2026-02-13 | 13F | Mml Investors Services, Llc | 57 806 | -4,66 | 685 | -10,69 | ||||
| 2026-02-17 | 13F | Snowden Capital Advisors LLC | 13 607 | 162 | ||||||
| 2026-02-17 | 13F | Engineers Gate Manager LP | 189 726 | -0,10 | 2 248 | -6,49 | ||||
| 2026-02-13 | 13F | Hudson Portfolio Management LLC | 39 650 | 26,88 | 470 | 18,73 | ||||
| 2026-02-17 | 13F | Jones Financial Companies Lllp | 24 509 | 7,42 | 290 | -2,68 | ||||
| 2026-02-18 | 13F | Mackenzie Financial Corp | 381 560 | -65,19 | 4 516 | -67,45 | ||||
| 2026-01-29 | 13F | Teachers Retirement System Of The State Of Kentucky | 1 969 030 | 0,00 | 23 | -4,17 | ||||
| 2026-02-17 | 13F | Royal Bank Of Canada | Put | 261 000 | 3 093 | |||||
| 2025-11-07 | 13F | Sierra Ocean, Llc | 0 | -100,00 | 0 | -100,00 | ||||
| 2026-02-17 | 13F | Royal Bank Of Canada | Call | 25 000 | 0,00 | 296 | -6,62 | |||
| 2025-11-04 | 13F | High Note Wealth, LLC | 0 | -100,00 | 0 | |||||
| 2026-02-17 | 13F | Royal Bank Of Canada | 512 246 | 20,54 | 6 070 | 12,83 | ||||
| 2026-02-02 | 13F | Principal Financial Group Inc | 137 994 | 18,22 | 1 635 | 10,70 | ||||
| 2026-01-26 | 13F | United Advisor Group, LLC | 19 434 | 0,03 | 230 | -6,12 | ||||
| 2026-02-13 | 13F | Cullen Capital Management, LLC | 2 271 269 | 44,09 | 26 915 | 34,87 | ||||
| 2026-02-17 | 13F | Northern Trust Corp | 1 724 470 | -9,98 | 20 435 | -15,75 | ||||
| 2025-09-26 | NP | MSTFX - Morningstar International Equity Fund | 81 481 | -64,45 | 1 038 | -64,45 | ||||
| 2026-02-17 | 13F | Limestone Investment Advisors LP | 88 461 | 24,57 | 1 048 | 16,70 | ||||
| 2026-02-13 | 13F | FORA Capital, LLC | 0 | -100,00 | 0 | |||||
| 2025-09-26 | NP | FEMSX - Fidelity Series Emerging Markets Opportunities Fund This fund is a listed as child fund of Fmr Llc and if that institution has disclosed ownership in this security, then these positions will not be double counted when calculating total shares and total value | 3 710 035 | 0,00 | 47 266 | 12,84 | ||||
| 2025-11-13 | 13F | Eisler Capital Management Ltd. | Put | 600 000 | 0,00 | 7 740 | 3,12 | |||
| 2025-11-13 | 13F | Eisler Capital Management Ltd. | Call | 300 000 | 0,00 | 3 870 | 3,12 | |||
| 2026-02-12 | 13F | Jane Street Group, Llc | Put | 3 317 500 | 216,77 | 39 312 | 196,52 | |||
| 2026-02-12 | 13F | Jane Street Group, Llc | Call | 985 600 | 96,14 | 11 679 | 83,60 | |||
| 2025-11-25 | 13F | Briaud Financial Planning, Inc | 0 | -100,00 | 0 | |||||
| 2026-02-17 | 13F | Private Advisor Group, LLC | 159 116 | -3,92 | 1 886 | -10,07 | ||||
| 2025-11-13 | 13F | Banque Cantonale Vaudoise | 0 | -100,00 | 0 | |||||
| 2026-02-12 | 13F | Jane Street Group, Llc | 1 455 710 | -28,43 | 17 250 | -33,01 | ||||
| 2026-02-13 | 13F | Hurley Capital, LLC | Call | 45 | 0,00 | 8 | -33,33 | |||
| 2026-02-13 | 13F | Wells Fargo & Company/mn | 1 157 480 | 24,40 | 13 716 | 16,44 | ||||
| 2026-02-17 | 13F | Parkwood LLC | 760 484 | 28,13 | 9 | 28,57 | ||||
| 2025-11-03 | 13F | Ballentine Partners, LLC | 0 | -100,00 | 0 | -100,00 | ||||
| 2026-02-02 | 13F | Sachetta, LLC | 0 | -100,00 | 0 | |||||
| 2026-01-21 | 13F | Yousif Capital Management, Llc | 24 063 | 0,00 | 309 | 1,32 | ||||
| 2025-11-12 | 13F | Victory Capital Management Inc | 0 | -100,00 | 0 | |||||
| 2026-02-06 | 13F | Axxcess Wealth Management, Llc | 18 055 | -2,75 | 214 | -9,36 | ||||
| 2026-02-17 | 13F | Parvin Asset Management, LLC | 12 325 | 54,06 | 146 | 44,55 | ||||
| 2026-02-20 | 13F/A | Capital Markets Trading UK LLP | 440 351 | 99,01 | 5 | 150,00 | ||||
| 2026-01-29 | 13F | Sanctuary Advisors, LLC | 109 739 | 5,86 | 1 300 | -0,91 | ||||
| 2026-02-02 | 13F | Horizon Investments, LLC | 55 | 1 | ||||||
| 2026-02-11 | 13F | Capital International Inc /ca/ | 1 942 862 | 100,73 | 23 023 | 87,89 | ||||
| 2026-02-13 | 13F | Segall Bryant & Hamill, Llc | 36 200 | 0,00 | 429 | -6,55 | ||||
| 2026-02-13 | 13F | Squarepoint Ops LLC | Put | 218 000 | -65,93 | 2 583 | -68,11 | |||
| 2026-02-13 | 13F | Squarepoint Ops LLC | 657 453 | 93,54 | 7 791 | 81,16 | ||||
| 2025-11-14 | 13F | Cubist Systematic Strategies, LLC | Call | 354 800 | 5,97 | 4 492 | 7,23 | |||
| 2025-11-14 | 13F | Cubist Systematic Strategies, LLC | 1 932 399 | 508,33 | 24 464 | 515,76 | ||||
| 2026-02-17 | 13F | Kerrisdale Advisers, LLC | 111 126 | 0,00 | 1 317 | -6,40 | ||||
| 2026-02-03 | 13F | Wesbanco Bank Inc | 0 | -100,00 | 0 | |||||
| 2026-02-17 | 13F | Balyasny Asset Management Llc | 122 559 | 1 452 | ||||||
| 2026-02-17 | 13F | Balyasny Asset Management Llc | Call | 209 300 | 8,61 | 2 480 | 1,68 | |||
| 2026-02-18 | 13F | Caitlin John, LLC | 0 | -100,00 | 0 | |||||
| 2026-01-13 | 13F | CoreCap Advisors, LLC | 461 | -69,95 | 5 | -73,68 | ||||
| 2026-02-04 | 13F | Altman Advisors, Inc. | 122 811 | -6,46 | 1 455 | -12,45 | ||||
| 2026-02-11 | 13F | Franklin Resources Inc | 635 707 | -24,35 | 7 533 | -29,19 | ||||
| 2026-02-03 | 13F | Sumitomo Mitsui DS Asset Management Company, Ltd | 11 000 | -31,25 | 130 | -35,64 | ||||
| 2026-02-05 | 13F | Cambridge Investment Research Advisors, Inc. | 165 484 | -6,96 | 2 | -50,00 | ||||
| 2026-02-17 | 13F | Balyasny Asset Management Llc | Put | 64 000 | -34,09 | 758 | -38,32 | |||
| 2026-02-17 | 13F | PharVision Advisers, LLC | 38 680 | 93,81 | 458 | 94,89 | ||||
| 2026-01-21 | 13F | Ameliora Wealth Management Ltd. | 4 000 | 0,00 | 47 | -6,00 | ||||
| 2026-02-17 | 13F | Millennium Management Llc | Call | 429 300 | 1,35 | 5 087 | -5,13 | |||
| 2026-02-17 | 13F | Millennium Management Llc | 204 714 | -46,03 | 2 426 | -49,50 | ||||
| 2026-02-11 | 13F | Fox Run Management, L.l.c. | 46 842 | -9,79 | 555 | -15,53 | ||||
| 2026-02-17 | 13F | Millennium Management Llc | Put | 25 200 | -74,85 | 299 | -76,50 | |||
| 2025-09-26 | NP | RTXAX - Tax-Managed Real Assets Fund Class A | 49 430 | 104,19 | 630 | 130,40 | ||||
| 2026-01-30 | 13F/A | M&t Bank Corp | 21 581 | 0,00 | 256 | -6,59 | ||||
| 2026-02-06 | 13F/A | Rathbone Brothers plc | 0 | -100,00 | 0 | -100,00 | ||||
| 2026-02-09 | 13F | Beck Bode, LLC | 1 232 786 | -0,59 | 14 609 | -6,96 | ||||
| 2026-01-30 | 13F | Mitsubishi UFJ Trust & Banking Corp | 320 149 | -37,26 | 3 794 | -41,28 | ||||
| 2026-02-23 | 13F | Virtu Financial LLC | 41 883 | 0 | ||||||
| 2026-01-15 | 13F | Frank, Rimerman Advisors LLC | 35 055 | -15,67 | 415 | -21,10 | ||||
| 2025-11-05 | 13F | Wellington Shields & Co., LLC | 0 | -100,00 | 0 | |||||
| 2026-02-05 | 13F | Gabelli Funds Llc | 35 000 | 0,00 | 415 | -6,55 | ||||
| 2026-01-27 | 13F | Checchi Capital Advisers, LLC | 23 434 | -3,74 | 278 | -10,06 | ||||
| 2026-01-29 | 13F | Rakuten Securities, Inc. | 149 213 | 41,55 | 1 768 | 32,53 | ||||
| 2026-02-06 | 13F | Abn Amro Investment Solutions | 42 100 | 312,75 | 499 | 286,05 | ||||
| 2026-02-12 | 13F | JPL Wealth Management, LLC | 0 | -100,00 | 0 | |||||
| 2025-09-23 | NP | SLANX - DWS Latin America Equity Fund Class A | 407 672 | 41,50 | 5 194 | 59,69 | ||||
| 2025-09-26 | NP | UBPIX - Ultralatin America Profund Investor Class | 37 208 | 0,30 | 474 | 13,40 | ||||
| 2025-09-25 | NP | VT - Vanguard Total World Stock Index Fund ETF Shares | 179 623 | 0,00 | 2 288 | 12,88 | ||||
| 2026-01-23 | 13F | Tyche Wealth Partners LLC | 23 963 | -6,82 | 284 | -12,92 | ||||
| 2026-02-17 | 13F | Clear Street Markets Llc | 10 900 | 0,93 | 129 | -5,15 | ||||
| 2025-09-26 | NP | FHKFX - Fidelity Series Emerging Markets Fund This fund is a listed as child fund of Fmr Llc and if that institution has disclosed ownership in this security, then these positions will not be double counted when calculating total shares and total value | 762 315 | -6,38 | 9 712 | 5,63 | ||||
| 2026-02-10 | 13F | NINE MASTS CAPITAL Ltd | 410 245 | 4 861 | ||||||
| 2025-10-28 | 13F | MAS Advisors LLC | 34 542 | 19,01 | 437 | 20,39 | ||||
| 2026-02-04 | 13F | Oxbow Advisors, LLC | 418 136 | 4 955 | ||||||
| 2026-02-10 | 13F | Hazlett, Burt & Watson, Inc. | 974 | 0,00 | 0 | |||||
| 2026-01-12 | 13F | Salem Investment Counselors Inc | 502 831 | -6,46 | 5 962 | -12,39 | ||||
| 2026-01-27 | 13F | Fundamenta Capital S.A. | 1 355 652 | 16 064 | ||||||
| 2026-02-13 | 13F | Banco Santander, S.A. | 434 136 | 196,57 | 5 145 | 177,60 | ||||
| 2026-02-02 | 13F | Truist Financial Corp | 32 726 | 2,60 | 388 | -3,97 | ||||
| 2026-01-23 | 13F | Robeco Institutional Asset Management B.V. | 6 013 197 | 3,26 | 71 256 | -3,35 | ||||
| 2026-01-23 | 13F | Assetmark, Inc | 1 174 976 | 8,71 | 13 923 | 1,75 | ||||
| 2026-01-15 | 13F | Victory Financial Group, Llc | 21 048 | -0,01 | 249 | -6,39 | ||||
| 2025-10-09 | 13F | Bartlett & Co. Wealth Management Llc | 0 | -100,00 | 0 | |||||
| 2025-09-25 | NP | DFEM - Dimensional Emerging Markets Core Equity 2 ETF | 59 036 | -24,19 | 752 | -14,45 | ||||
| 2026-01-05 | 13F | GAMMA Investing LLC | 946 | -37,31 | 11 | -42,11 | ||||
| 2026-02-17 | 13F | Advisor Group Holdings, Inc. | Call | 2 | 0 | |||||
| 2025-09-29 | NP | CVY - Invesco Zacks Multi-Asset Income ETF This fund is a listed as child fund of Invesco Ltd. and if that institution has disclosed ownership in this security, then these positions will not be double counted when calculating total shares and total value | 0 | -100,00 | 0 | -100,00 | ||||
| 2026-02-06 | 13F | Poehling Capital Management, LLC | 239 046 | 1,35 | 2 833 | -5,16 | ||||
| 2026-02-03 | 13F | Horrell Capital Management, Inc. | 500 | 0,00 | 6 | -16,67 | ||||
| 2026-02-17 | 13F | Two Sigma Advisers, Lp | 145 700 | 250,24 | 1 727 | 228,14 | ||||
| 2025-11-04 | 13F | Centric Wealth Management | 0 | -100,00 | 0 | |||||
| 2026-02-09 | 13F | Cypress Capital Management LLC (WY) | 4 | 0,00 | 0 | |||||
| 2026-01-14 | 13F | Spire Wealth Management | 7 035 | 15,75 | 83 | 9,21 | ||||
| 2026-02-11 | 13F | IMA Wealth, Inc. | 118 | 1 | ||||||
| 2026-01-14 | 13F | ORG Partners LLC | 52 283 | 2 273,26 | 619 | 2 192,59 | ||||
| 2025-11-03 | 13F | Kapitalo Investimentos Ltda | 0 | -100,00 | 0 | |||||
| 2026-01-26 | 13F | Abbington Investment Group | 309 572 | 8,06 | 3 668 | 1,16 | ||||
| 2026-02-17 | 13F | Aqr Capital Management Llc | 132 396 | 27,47 | 1 569 | 19,33 | ||||
| 2026-02-12 | 13F | Quadrant Capital Group Llc | 20 624 | -46,32 | 244 | -49,79 | ||||
| 2025-11-17 | 13F | FSA Wealth Management LLC | 68 | 0,00 | 1 | |||||
| 2025-11-14 | 13F | Gotham Asset Management, LLC | 0 | -100,00 | 0 | |||||
| 2026-01-21 | 13F | Prime Capital Investment Advisors, LLC | 93 798 | -1,29 | 1 112 | -7,57 | ||||
| 2026-02-12 | 13F | Tocqueville Asset Management L.p. | 25 675 | -7,56 | 304 | -13,39 | ||||
| 2026-02-05 | 13F | Thrivent Financial For Lutherans | 170 304 | 9,44 | 2 | 100,00 | ||||
| 2026-02-17 | 13F | Capstone Investment Advisors, Llc | 0 | -100,00 | 0 | -100,00 | ||||
| 2026-01-21 | 13F | Step Capital Management Pte. Ltd. | 60 000 | 676 | ||||||
| 2026-01-29 | 13F | DecisionPoint Financial, LLC | 0 | -100,00 | 0 | |||||
| 2026-02-10 | 13F | CIBC World Markets Inc. | 67 577 | 38,46 | 801 | 29,66 | ||||
| 2026-02-17 | 13F | D. E. Shaw & Co., Inc. | Put | 525 000 | 62,74 | 6 221 | 52,33 | |||
| 2026-02-17 | 13F | D. E. Shaw & Co., Inc. | 300 303 | -93,80 | 3 559 | -94,20 | ||||
| 2026-02-17 | 13F | D. E. Shaw & Co., Inc. | Call | 235 000 | -69,35 | 2 785 | -71,32 | |||
| 2026-02-17 | 13F | Janus Henderson Group Plc | 282 958 | 3 352 | ||||||
| 2026-02-05 | 13F | DnB Asset Management AS | 1 837 813 | 21 778 | ||||||
| 2026-01-29 | 13F | James Investment Research Inc | 23 219 | -12,63 | 275 | -18,15 | ||||
| 2026-02-20 | 13F/A | CMT Capital Markets Trading GmbH | Put | 779 900 | -29,76 | 9 | -35,71 | |||
| 2026-01-28 | 13F | Old National Bancorp /in/ | 0 | -100,00 | 0 | |||||
| 2026-01-29 | 13F | Deltec Asset Management Llc | 71 000 | 9,23 | 841 | 2,31 | ||||
| 2026-02-20 | 13F/A | CMT Capital Markets Trading GmbH | Call | 1 269 400 | -18,95 | 15 | -21,05 | |||
| 2025-10-06 | 13F | NWF Advisory Services Inc. | 0 | -100,00 | 0 | -100,00 | ||||
| 2026-02-05 | 13F | Sapient Capital Llc | 0 | -100,00 | 0 | |||||
| 2026-02-17 | 13F | Blair William & Co/il | 10 861 | 1 314,19 | 129 | 1 322,22 | ||||
| 2026-01-21 | 13F | Baker Ellis Asset Management LLC | 18 000 | 93,55 | 213 | 74,59 | ||||
| 2026-02-03 | 13F | Sequoia Financial Advisors, LLC | 22 507 | 15,49 | 267 | 8,13 | ||||
| 2026-02-06 | 13F | Leonteq Securities AG | Put | 600 000 | 200,00 | 7 110 | 180,81 | |||
| 2026-02-06 | 13F | Leonteq Securities AG | 215 413 | -63,77 | 2 553 | -66,10 | ||||
| 2026-02-03 | 13F | Crossmark Global Holdings, Inc. | 66 312 | -21,21 | 786 | -26,29 | ||||
| 2026-02-10 | 13F | Ted Buchan & Co | 191 403 | -25,04 | 2 268 | -29,83 | ||||
| 2025-11-10 | 13F | Kovitz Investment Group Partners, LLC | 0 | -100,00 | 0 | |||||
| 2026-02-17 | 13F | Dark Forest Capital Management Lp | 0 | -100,00 | 0 | -100,00 | ||||
| 2026-02-17 | 13F | Susquehanna International Group, Llp | 2 323 782 | 87,14 | 27 537 | 75,17 | ||||
| 2026-02-17 | 13F | Susquehanna International Group, Llp | Put | 9 523 000 | -2,44 | 112 848 | -8,68 | |||
| 2026-01-08 | 13F | True Wealth Design, LLC | 519 | 41,42 | 6 | 50,00 | ||||
| 2026-02-17 | 13F | Point72 Asset Management, L.P. | 4 895 056 | 9,02 | 58 006 | 2,05 | ||||
| 2026-02-05 | 13F | Intrua Financial, LLC | 28 785 | 3,75 | 341 | -2,85 | ||||
| 2026-02-17 | 13F | PACK Private Wealth, LLC | 10 767 | -21,18 | 128 | -26,16 | ||||
| 2026-02-05 | 13F | Financial Security Advisor, Inc. | 0 | -100,00 | 0 | |||||
| 2026-02-17 | 13F | Point72 Asset Management, L.P. | Put | 372 100 | 135,36 | 4 409 | 120,34 | |||
| 2026-02-17 | 13F | Susquehanna International Group, Llp | Call | 8 866 200 | 57,85 | 105 064 | 47,75 | |||
| 2026-02-17 | 13F | Point72 Asset Management, L.P. | Call | 939 500 | 268,58 | 11 133 | 245,00 | |||
| 2026-02-06 | 13F | Larson Financial Group LLC | 3 487 | -12,82 | 41 | -18,00 | ||||
| 2025-10-07 | 13F | Sonora Investment Management Group, LLC | 17 065 | -0,03 | 216 | 1,41 | ||||
| 2025-09-26 | NP | REMSX - Emerging Markets Fund Class S | 0 | -100,00 | 0 | -100,00 | ||||
| 2026-02-10 | 13F | Daiwa Securities Group Inc. | 157 123 | 182,10 | 2 | -66,67 | ||||
| 2026-02-13 | 13F | Thornburg Investment Management Inc | 344 876 | -0,42 | 4 087 | -6,80 | ||||
| 2026-02-02 | 13F | Artemis Investment Management LLP | 2 009 324 | -25,00 | 23 810 | -29,80 | ||||
| 2026-01-28 | 13F | B. Metzler seel. Sohn & Co. AG | 220 671 | -42,27 | 2 615 | -45,98 | ||||
| 2026-01-27 | 13F | Bayforest Capital Ltd | 3 259 | 39 | ||||||
| 2026-02-13 | 13F | Morgan Stanley | 12 087 833 | 23,65 | 143 241 | 15,74 | ||||
| 2025-09-25 | NP | DFCEX - Emerging Markets Core Equity Portfolio - Institutional Class This fund is a listed as child fund of Dimensional Fund Advisors Lp and if that institution has disclosed ownership in this security, then these positions will not be double counted when calculating total shares and total value | 297 124 | 0,00 | 3 785 | 12,85 | ||||
| 2025-09-25 | NP | HFCVX - Hennessy Cornerstone Value Fund Investor Class | 398 900 | 0,00 | 5 082 | 12,84 | ||||
| 2026-01-29 | 13F | Pictet Asset Management Holding SA | 0 | -100,00 | 0 | |||||
| 2026-02-13 | 13F | Level Four Advisory Services, Llc | 27 255 | -34,12 | 323 | -38,43 | ||||
| 2026-02-13 | 13F | HITE Hedge Asset Management LLC | 45 725 | -51,91 | 542 | -55,03 | ||||
| 2026-01-15 | 13F | J. Safra Sarasin Holding AG | 106 000 | 0,00 | 1 256 | -6,34 | ||||
| 2025-11-14 | 13F | Jain Global LLC | 0 | -100,00 | 0 | |||||
| 2026-01-16 | 13F | FNY Investment Advisers, LLC | 11 420 | 1 868,97 | 0 | |||||
| 2026-02-12 | 13F | Commonwealth Equity Services, Llc | 134 046 | -10,39 | 1 588 | 158 700,00 | ||||
| 2026-01-27 | 13F | TD Waterhouse Canada Inc. | 849 | 30,82 | 10 | 25,00 | ||||
| 2025-09-26 | 13F | Capital A Wealth Management, LLC | 0 | -100,00 | 0 | |||||
| 2026-02-13 | 13F | Pathstone Holdings, LLC | 27 694 | -8,32 | 328 | -14,14 | ||||
| 2026-01-27 | 13F | Evergreen Capital Management Llc | 39 541 | -38,02 | 476 | -41,43 | ||||
| 2026-01-15 | 13F | 25 Llc | 15 645 | 0,00 | 185 | -6,57 | ||||
| 2026-01-21 | 13F | Flagship Harbor Advisors, Llc | 1 209 | 14 | ||||||
| 2026-01-30 | 13F | Activest Wealth Management | 12 400 | 80,65 | 147 | 69,77 | ||||
| 2025-11-14 | 13F | Peak6 Llc | Call | 0 | -100,00 | 0 | ||||
| 2026-02-12 | 13F | Earnest Partners Llc | 5 335 330 | 9,50 | 63 224 | 2,49 | ||||
| 2026-02-06 | 13F | Ignite Planners, LLC | 0 | -100,00 | 0 | |||||
| 2025-11-14 | 13F | Graham Capital Management, L.P. | 0 | -100,00 | 0 | -100,00 | ||||
| 2026-01-06 | 13F | Nelson, Van Denburg & Campbell Wealth Management Group, LLC | 15 638 | -13,19 | 185 | -18,86 | ||||
| 2025-10-30 | 13F | Ridgewood Investments LLC | Call | 0 | -100,00 | 0 | -100,00 | |||
| 2025-09-25 | NP | NEWFX - NEW WORLD FUND INC Class A | 6 518 409 | 12,40 | 83 045 | 26,83 | ||||
| 2026-01-30 | 13F | State of New Jersey Common Pension Fund D | 706 825 | -8,73 | 8 376 | -14,57 | ||||
| 2026-01-08 | 13F | Traveka Wealth, LLC | 0 | -100,00 | 0 | |||||
| 2026-01-30 | 13F | Caldwell Trust Co | 115 | 1 | ||||||
| 2026-02-17 | 13F/A | RBF Capital, LLC | 100 000 | -16,67 | 1 185 | -21,99 | ||||
| 2026-01-05 | 13F | Union Bancaire Privee, UBP SA | 44 068 | 26,58 | 497 | 9,23 | ||||
| 2026-01-23 | 13F | Baillie Gifford & Co | 29 523 522 | -7,99 | 349 854 | -13,88 | ||||
| 2026-02-17 | 13F | Man Group plc | 598 768 | 344,18 | 7 095 | 315,89 | ||||
| 2026-02-17 | 13F | Bank Of America Corp /de/ | 13 767 405 | 61,61 | 163 144 | 51,27 | ||||
| 2026-02-09 | 13F | Hartland & Co., LLC | 2 330 | 273,40 | 28 | 285,71 | ||||
| 2026-02-17 | 13F | United Capital Financial Advisers, Llc | 19 234 | 7,96 | 228 | 0,89 | ||||
| 2026-02-04 | 13F | Abc Arbitrage Sa | 25 949 | -86,80 | 307 | -87,67 | ||||
| 2025-12-18 | 13F | Danske Bank A/s | 0 | -100,00 | 0 | |||||
| 2026-02-02 | 13F | Strs Ohio | 31 899 | -14,86 | 378 | -20,25 | ||||
| 2026-01-12 | 13F | Legacy Wealth Asset Management, LLC | 40 534 | 1,14 | 480 | -5,33 | ||||
| 2026-02-13 | 13F | Neuberger Berman Group LLC | 103 826 | -19,03 | 1 230 | -24,21 | ||||
| 2026-02-17 | 13F | Russell Investments Group, Ltd. | 613 801 | -50,31 | 7 274 | -53,49 | ||||
| 2026-03-06 | 13F | Hsbc Holdings Plc | 1 283 495 | 9,91 | 15 208 | 10,18 | ||||
| 2026-01-29 | 13F | Aprio Wealth Management, LLC | 19 928 | 8,26 | 236 | 1,29 | ||||
| 2026-02-10 | 13F | Bnp Paribas Arbitrage, Sa | Call | 11 231 | 34,55 | 13 309 | 25,94 | |||
| 2026-02-17 | 13F | Limestone Investment Advisors LP | Put | 0 | -100,00 | 0 | ||||
| 2026-02-10 | 13F | Bnp Paribas Arbitrage, Sa | 580 110 | 196,37 | 6 874 | 177,40 | ||||
| 2026-02-02 | 13F | Advisors Preferred, LLC | 20 609 | -89,50 | 246 | -90,10 | ||||
| 2026-02-05 | 13F | Bank Julius Baer & Co. Ltd, Zurich | 163 600 | -3,76 | 1 939 | -9,94 | ||||
| 2026-02-09 | 13F | IPG Investment Advisors LLC | 185 185 | -51,28 | 2 260 | -53,92 | ||||
| 2026-02-10 | 13F | Bnp Paribas Arbitrage, Sa | Put | 11 042 | 5,95 | 13 085 | -0,83 | |||
| 2026-02-13 | 13F | American Century Companies Inc | 3 423 333 | 13,42 | 40 566 | 6,16 | ||||
| 2025-10-10 | 13F | Viking Fund Management Llc | 0 | -100,00 | 0 | |||||
| 2026-02-04 | 13F | Fourth Dimension Wealth, LLC | 600 | 0,00 | 7 | 0,00 | ||||
| 2026-02-17 | 13F | Creative Planning | 185 973 | 32,84 | 2 204 | 24,32 | ||||
| 2026-01-22 | 13F | Comprehensive Money Management Services LLC | 20 725 | 1,32 | 246 | -5,04 | ||||
| 2026-02-13 | 13F | Toroso Investments, LLC | 135 675 | 42,66 | 1 608 | 33,47 | ||||
| 2026-02-03 | 13F | Plan Group Financial, LLC | 0 | -100,00 | 0 | |||||
| 2026-02-17 | 13F | Quadrature Capital Ltd | 372 338 | 59,87 | 4 412 | 49,71 | ||||
| 2026-02-11 | 13F | LPL Financial LLC | 462 738 | 33,21 | 5 483 | 24,70 | ||||
| 2026-01-26 | 13F | Mirae Asset Global Investments Co., Ltd. | 105 031 | 3,04 | 1 245 | -3,57 | ||||
| 2026-02-12 | 13F | CIBC Private Wealth Group, LLC | 765 | 6,55 | 9 | 0,00 | ||||
| 2025-11-21 | 13F | Bell Investment Advisors, Inc | 0 | -100,00 | 0 | -100,00 | ||||
| 2026-02-05 | 13F | Baader Bank INC | 0 | -100,00 | 0 | |||||
| 2025-09-26 | NP | RMYAX - Multi-Strategy Income Fund Class A | 11 551 | -34,79 | 147 | -26,13 | ||||
| 2026-02-12 | 13F | Sagil Capital Llp | 611 224 | 7 243 | ||||||
| 2026-02-12 | 13F | Sagil Capital Llp | Call | 350 000 | 4 148 | |||||
| 2025-10-31 | 13F | Whittier Trust Co Of Nevada Inc | 0 | -100,00 | 0 | |||||
| 2026-02-11 | 13F | Deutsche Bank Ag\ | 6 661 | 9,52 | 79 | 2,63 | ||||
| 2026-02-17 | 13F | Grantham, Mayo, Van Otterloo & Co. LLC | 24 048 | -16,46 | 285 | -21,98 | ||||
| 2026-02-13 | 13F | Maven Securities LTD | 54 818 | 650 | ||||||
| 2026-02-17 | 13F | Breakout Capital Partners, LP | 1 182 589 | 14 014 | ||||||
| 2026-02-12 | 13F | Ci Investments Inc. | 582 509 | -64,77 | 6 903 | 34 410,00 | ||||
| 2026-02-13 | 13F | GQG Partners LLC | 136 003 212 | -35,83 | 1 611 638 | -39,94 | ||||
| 2026-02-13 | 13F | Parkside Financial Bank & Trust | 4 544 | 264,10 | 54 | 253,33 | ||||
| 2026-02-13 | 13F | PCM Encore, LLC | 20 028 | 237 | ||||||
| 2026-02-17 | 13F | Limestone Investment Advisors LP | Call | 0 | -100,00 | 0 | ||||
| 2026-02-09 | 13F | Key FInancial Inc | 453 | 5 | ||||||
| 2026-01-29 | 13F | Quest 10 Wealth Builders, Inc. | 0 | -100,00 | 0 | |||||
| 2025-09-25 | NP | TIER - T. Rowe Price International Equity Research ETF | 2 058 | 26 | ||||||
| 2026-02-13 | 13F | Smartleaf Asset Management LLC | 712 | 0,00 | 8 | -11,11 | ||||
| 2026-02-10 | 13F | Rothschild Investment Llc | 450 | 0,00 | 5 | 0,00 | ||||
| 2025-11-14 | 13F | Hrt Financial Lp | 0 | -100,00 | 0 | |||||
| 2025-11-14 | 13F | Wood Tarver Financial Group, LLC | 0 | -100,00 | 0 | |||||
| 2026-02-10 | 13F | Envestnet Asset Management Inc | 1 004 074 | -7,63 | 11 898 | -13,54 | ||||
| 2026-02-18 | 13F | Vident Advisory, LLC | 116 497 | -9,16 | 1 380 | -14,97 | ||||
| 2026-02-13 | 13F | Centiva Capital, LP | 0 | -100,00 | 0 | |||||
| 2026-02-10 | 13F | Bnp Paribas | 4 240 | 0,00 | 50 | -5,66 | ||||
| 2026-02-12 | 13F | DRW Securities, LLC | 203 796 | 207,50 | 2 415 | 188,41 | ||||
| 2025-11-14 | 13F | Wolverine Trading, Llc | Put | 396 600 | 366,59 | 5 096 | 384,41 | |||
| 2026-01-20 | 13F | SOA Wealth Advisors, LLC. | 600 | 0,00 | 7 | 0,00 | ||||
| 2026-01-23 | 13F | U.S. Capital Wealth Advisors, LLC | 14 200 | -1,39 | 168 | -7,69 | ||||
| 2026-02-12 | 13F | Brinker Capital Investments, LLC | 101 951 | 9,54 | 1 208 | 2,55 | ||||
| 2026-01-15 | 13F | Archford Capital Strategies, LLC | 88 934 | -18,16 | 1 054 | -23,42 | ||||
| 2026-02-06 | 13F | IFP Advisors, Inc | 1 003 | 0,00 | 12 | -8,33 | ||||
| 2025-09-25 | NP | JEMA - JPMorgan Emerging Markets Equity Core ETF | 665 768 | -3,20 | 8 482 | 9,22 | ||||
| 2026-02-12 | 13F/A | Pinebridge Investments Llc | 161 949 | 1 919 | ||||||
| 2026-02-12 | 13F | Dimensional Fund Advisors Lp | 3 184 306 | 1,60 | 37 734 | -5,00 | ||||
| 2026-02-14 | 13F | Whipplewood Advisors, LLC | 177 | 2 | ||||||
| 2025-11-14 | 13F | Wolverine Trading, Llc | 106 785 | 53,29 | 1 372 | 59,16 | ||||
| 2026-02-09 | 13F | Hantz Financial Services, Inc. | 40 130 | -5,89 | 0 | |||||
| 2025-11-14 | 13F | Wolverine Trading, Llc | Call | 195 700 | -28,45 | 2 515 | -25,73 | |||
| 2026-02-03 | 13F | McIlrath & Eck, LLC | 11 287 | 134 | ||||||
| 2026-02-11 | 13F | First Command Advisory Services, Inc. | 134 | 2 | ||||||
| 2026-02-12 | 13F | Resurgent Financial Advisors LLC | 15 526 | -0,60 | 184 | -7,11 | ||||
| 2026-02-09 | 13F | Morningstar Investment Management LLC | 214 987 | -30,04 | 3 | -33,33 | ||||
| 2026-02-17 | 13F | Two Sigma Securities, Llc | 20 194 | -47,36 | 239 | -50,72 | ||||
| 2026-01-09 | 13F | SG Americas Securities, LLC | 46 329 | -41,71 | 1 | -100,00 | ||||
| 2026-02-13 | 13F | National Bank Of Canada /fi/ | 546 | -68,29 | 6 | -71,43 | ||||
| 2025-11-12 | 13F | HAP Trading, LLC | Put | 18 300 | 5 | |||||
| 2026-02-17 | 13F | Mercer Global Advisors Inc /adv | 13 178 | -19,60 | 156 | -24,64 | ||||
| 2026-02-20 | 13F/A | Capital Markets Trading UK LLP | Put | 1 654 300 | 20,72 | 20 | 11,76 | |||
| 2026-02-20 | 13F/A | Capital Markets Trading UK LLP | Call | 1 600 000 | 61,23 | 19 | 58,33 | |||
| 2025-11-06 | 13F | Midwest Trust Co | 0 | -100,00 | 0 | |||||
| 2025-11-12 | 13F | HAP Trading, LLC | Call | 14 100 | 7 | |||||
| 2026-02-10 | 13F | Savant Capital, LLC | 15 699 | 4,49 | 186 | -2,11 | ||||
| 2026-02-13 | 13F | Mariner, LLC | 81 131 | 110,24 | 961 | 96,93 | ||||
| 2026-01-28 | 13F | Eagle Global Advisors Llc | 0 | -100,00 | 0 | |||||
| 2026-02-17 | 13F | Raymond James Financial Inc | 503 374 | 11,84 | 5 965 | 4,69 | ||||
| 2025-09-25 | NP | PRLAX - T. Rowe Price Latin America Fund This fund is a listed as child fund of Price T Rowe Associates Inc /md/ and if that institution has disclosed ownership in this security, then these positions will not be double counted when calculating total shares and total value | 696 277 | 9,62 | 8 871 | 23,69 | ||||
| 2026-02-13 | 13F | Schroder Investment Management Group | 23 380 819 | -17,03 | 277 063 | -22,34 | ||||
| 2026-02-12 | 13F | Qtron Investments LLC | 0 | -100,00 | 0 | |||||
| 2026-02-17 | 13F | Trexquant Investment LP | 656 749 | -34,65 | 7 782 | -38,84 | ||||
| 2025-11-14 | 13F | PineBridge Investments, L.P. | 202 110 | 0,00 | 2 559 | 1,19 | ||||
| 2026-02-12 | 13F | Brown Brothers Harriman & Co | 586 | 75,45 | 7 | 50,00 | ||||
| 2026-02-04 | 13F | LRI Investments, LLC | 1 000 | 0,00 | 12 | -8,33 | ||||
| 2025-10-27 | 13F | Kiker Wealth Management, LLC | 0 | -100,00 | 0 | -100,00 | ||||
| 2026-01-29 | 13F | Vanguard Group Inc | 1 221 885 | 5,68 | 14 479 | -1,08 | ||||
| 2025-09-24 | NP | DAINX - Dunham International Stock Fund Class A | 0 | -100,00 | 0 | -100,00 | ||||
| 2026-01-16 | 13F | Ellsworth Advisors, LLC | 458 421 | 5 781 | ||||||
| 2025-11-13 | 13F | Diametric Capital, LP | 0 | -100,00 | 0 | |||||
| 2026-02-13 | 13F | Marshall Wace, Llp | 0 | -100,00 | 0 | |||||
| 2025-09-24 | NP | EQNAX - MFS Equity Income Fund A | 165 730 | 0,00 | 2 111 | 12,83 | ||||
| 2026-01-29 | 13F | Kestra Private Wealth Services, Llc | 12 037 | 0,74 | 143 | -5,96 | ||||
| 2026-02-19 | 13F | CI Private Wealth, LLC | 48 623 | -17,10 | 563 | -24,26 | ||||
| 2026-01-23 | 13F | Farther Finance Advisors, LLC | 34 460 | 25,44 | 408 | 17,58 | ||||
| 2026-02-17 | 13F | Quantinno Capital Management LP | 138 736 | 64,04 | 1 644 | 53,64 | ||||
| 2025-09-26 | NP | RAZAX - Multi-Asset Growth Strategy Fund Class A | 28 548 | -32,83 | 364 | -24,22 | ||||
| 2026-01-27 | 13F | Krilogy Financial LLC | 0 | -100,00 | 0 | |||||
| 2026-02-11 | 13F | RWC Asset Management LLP | 494 705 | -46,48 | 5 862 | -49,90 | ||||
| 2026-01-30 | 13F | Samalin Investment Counsel, LLC | 16 256 | 17,28 | 193 | 9,71 | ||||
| 2025-10-10 | 13F | Sound Income Strategies, LLC | 0 | -100,00 | 0 | |||||
| 2026-02-12 | 13F | Bank Of Montreal /can/ | 49 454 | -30,65 | 586 | -35,03 | ||||
| 2026-01-20 | 13F | AdvisorNet Financial, Inc | 1 768 | 0,00 | 21 | -9,09 | ||||
| 2026-01-23 | 13F | Lester Murray Antman dba SimplyRich | 34 094 | 17,70 | 0 | |||||
| 2026-02-12 | 13F | Raiffeisen Bank International AG | 90 000 | 1 067 | ||||||
| 2026-02-17 | 13F | LMR Partners LLP | 175 000 | 2 074 | ||||||
| 2026-02-17 | 13F | LMR Partners LLP | Call | 40 700 | 482 | |||||
| 2026-02-17 | 13F | LMR Partners LLP | Put | 188 900 | 2 238 | |||||
| 2026-02-17 | 13F | Aspen Grove Capital, LLC | 0 | -100,00 | 0 | |||||
| 2026-02-06 | 13F | Cullen/frost Bankers, Inc. | 578 | 1,76 | 7 | -14,29 | ||||
| 2026-02-13 | 13F | SPX Equities Gestao de Recursos Ltda | 4 887 558 | -38,26 | 57 918 | -42,21 | ||||
| 2026-02-12 | 13F | BRYN MAWR TRUST Co | 0 | -100,00 | 0 | -100,00 | ||||
| 2026-02-12 | 13F | Wealthspire Advisors, LLC | 0 | -100,00 | 0 | |||||
| 2026-01-28 | 13F | CAPROCK Group, Inc. | 104 497 | -5,18 | 1 272 | -10,55 | ||||
| 2026-01-27 | 13F | Hennessy Advisors Inc | 372 000 | -5,30 | 4 408 | -11,34 | ||||
| 2025-11-14 | 13F | Cubist Systematic Strategies, LLC | Put | 118 300 | -50,56 | 1 498 | -49,98 | |||
| 2026-02-06 | 13F | Kingdom Financial Group LLC. | 0 | 0 | ||||||
| 2026-02-13 | 13F | Allie Family Office LLC | 13 860 | 0,00 | 164 | -6,82 | ||||
| 2026-02-17 | 13F | Guggenheim Capital Llc | 148 453 | 7,88 | 1 759 | 0,98 | ||||
| 2025-10-08 | 13F | FCG Investment Co | 0 | -100,00 | 0 | |||||
| 2026-02-17 | 13F | Opal Capital Llc | 291 680 | 3 456 | ||||||
| 2025-09-29 | NP | AIM INVESTMENT FUNDS (INVESCO INVESTMENT FUNDS) - Invesco Oppenheimer Developing Markets Fund Class R6 | 12 644 649 | 75,60 | 161 093 | 98,15 | ||||
| 2026-01-30 | 13F | Bogart Wealth, LLC | 350 | 0,00 | 4 | 0,00 | ||||
| 2026-02-09 | 13F | Prospera Financial Services Inc | 24 235 | -20,28 | 287 | -25,26 | ||||
| 2026-02-11 | 13F | O'shaughnessy Asset Management, Llc | 936 025 | -6,75 | 11 092 | -12,72 | ||||
| 2026-02-13 | 13F | Edgestream Partners, L.P. | 18 791 | 223 | ||||||
| 2026-02-13 | 13F | Ubs Asset Management Americas Inc | 995 | 12 | ||||||
| 2026-02-17 | 13F | Ancora Advisors, LLC | 836 | 77,12 | 10 | 80,00 | ||||
| 2026-02-17 | 13F | Evergreen Quality Fund GP, Ltd. | 472 600 | 5 600 | ||||||
| 2026-01-21 | 13F | Naviter Wealth, LLC | 24 224 | -5,73 | 296 | -10,88 | ||||
| 2026-02-11 | 13F | Vise Technologies, Inc. | 44 031 | 2,95 | 522 | -3,70 | ||||
| 2026-01-14 | 13F | Net Worth Advisory Group | 13 942 | 4,49 | 165 | -1,79 | ||||
| 2025-09-26 | NP | EPEM - Harbor Emerging Markets Equity ETF | 4 390 | 56 | ||||||
| 2026-02-11 | 13F | Jpmorgan Chase & Co | 12 624 850 | 41,02 | 149 604 | 32,00 | ||||
| 2026-02-11 | 13F | Jpmorgan Chase & Co | Call | 3 050 000 | 154,17 | 36 142 | 137,90 | |||
| 2026-01-28 | 13F | Financial Perspectives, Inc | 1 764 | 0,00 | 21 | -9,09 | ||||
| 2026-02-09 | 13F | Arista Wealth Management, LLC | 0 | -100,00 | 0 | |||||
| 2026-02-11 | 13F | Jpmorgan Chase & Co | Put | 4 766 800 | 128,35 | 56 487 | 113,74 | |||
| 2026-01-29 | 13F | IMC-Chicago, LLC | 81 351 | -47,91 | 964 | -51,24 | ||||
| 2026-02-13 | 13F | Arkadios Wealth Advisors | 26 579 | 6,32 | 315 | -0,63 | ||||
| 2025-09-26 | NP | AEMGX - Acadian Emerging Markets Portfolio Investor Class Shares | 221 386 | 354,79 | 2 820 | 306,34 | ||||
| 2026-01-29 | 13F | IMC-Chicago, LLC | Put | 283 300 | -24,35 | 3 357 | -29,19 | |||
| 2026-01-29 | 13F | IMC-Chicago, LLC | Call | 253 700 | 508,39 | 3 006 | 470,40 | |||
| 2026-02-13 | 13F | Barclays Plc | 1 326 699 | 114,83 | 15 721 | 101,09 | ||||
| 2026-02-04 | 13F | Colonial River Wealth Management, LLC | 18 055 | -2,75 | 214 | -9,36 | ||||
| 2026-02-17 | 13F | Amundi | 441 659 | 5 234 | ||||||
| 2026-02-12 | 13F | Robotti Robert | 50 000 | 0,00 | 592 | -6,48 | ||||
| 2025-09-25 | NP | DFAE - Dimensional Emerging Core Equity Market ETF | 103 050 | 0,00 | 1 313 | 12,81 | ||||
| 2026-01-30 | 13F | Us Bancorp \de\ | 30 696 | -20,25 | 364 | -25,46 | ||||
| 2026-01-26 | 13F | Cwm, Llc | 9 212 | -17,77 | 0 | |||||
| 2026-02-02 | 13F | Oppenheimer Asset Management Inc. | 320 131 | -6,83 | 3 794 | -12,78 | ||||
| 2026-02-17 | 13F | Zacks Investment Management | 10 323 | 0,00 | 122 | -6,15 | ||||
| 2025-09-23 | NP | IEMGX - Voya Multi-Manager Emerging Markets Equity Fund Class I | 114 534 | -17,33 | 1 459 | -6,71 | ||||
| 2025-10-08 | 13F | Patriot Financial Group Insurance Agency, LLC | 0 | -100,00 | 0 | -100,00 | ||||
| 2026-01-30 | 13F | Archer Investment Corp | 0 | -100,00 | 0 | |||||
| 2025-09-24 | NP | SNTKX - Steward International Enhanced Index Fund Class A | 25 860 | 0,00 | 329 | 13,06 | ||||
| 2026-01-30 | 13F | Glenorchy Capital Ltd | 47 161 | 8,12 | 559 | 1,09 | ||||
| 2026-02-13 | 13F | State Street Corp | 5 485 921 | -2,73 | 66 958 | -6,76 | ||||
| 2025-09-25 | NP | HFIGX - Hartford Schroders Diversified Growth Fund Class I | 3 983 | -1,97 | 51 | 11,11 | ||||
| 2025-09-25 | NP | HRLIX - The Hartford Global Real Asset Fund Class I | 20 829 | -41,67 | 265 | -34,24 | ||||
| 2026-02-02 | 13F | Robertson Stephens Wealth Management, LLC | 36 506 | 143,28 | 444 | 133,16 | ||||
| 2026-01-28 | 13F | N.E.W. Advisory Services LLC | 400 | 0,00 | 5 | -20,00 | ||||
| 2026-01-29 | 13F | Nbc Securities, Inc. | Call | 0 | -100,00 | 0 | ||||
| 2026-02-17 | 13F | MIRAE ASSET GLOBAL ETFS HOLDINGS Ltd. | 81 175 | 18,26 | 962 | 10,71 | ||||
| 2026-02-13 | 13F | Walleye Trading LLC | 0 | -100,00 | 0 | -100,00 | ||||
| 2026-02-17 | 13F | Fmr Llc | 4 173 476 | -86,29 | 49 456 | -87,17 | ||||
| 2026-02-17 | 13F | Aquatic Capital Management LLC | 0 | -100,00 | 0 | |||||
| 2026-02-12 | 13F | Insigneo Advisory Services, Llc | 157 519 | -25,34 | 1 867 | -30,11 | ||||
| 2025-09-29 | NP | AIM INVESTMENT FUNDS (INVESCO INVESTMENT FUNDS) - Invesco Oppenheimer Global Allocation Fund Class R | 0 | -100,00 | 0 | -100,00 |