Podstawowe statystyki
| Właściciele instytucjonalni | 368 total, 358 long only, 0 short only, 10 long/short - change of 4,35% MRQ |
| Średnia alokacja portfela | 0.5209 % - change of -1,91% MRQ |
| Akcje instytucjonalne (długie) | 180 556 611 (ex 13D/G) - change of 12,12MM shares 5,46% MRQ |
| Wartość instytucjonalna (długa) | $ 4 360 374 USD ($1000) |
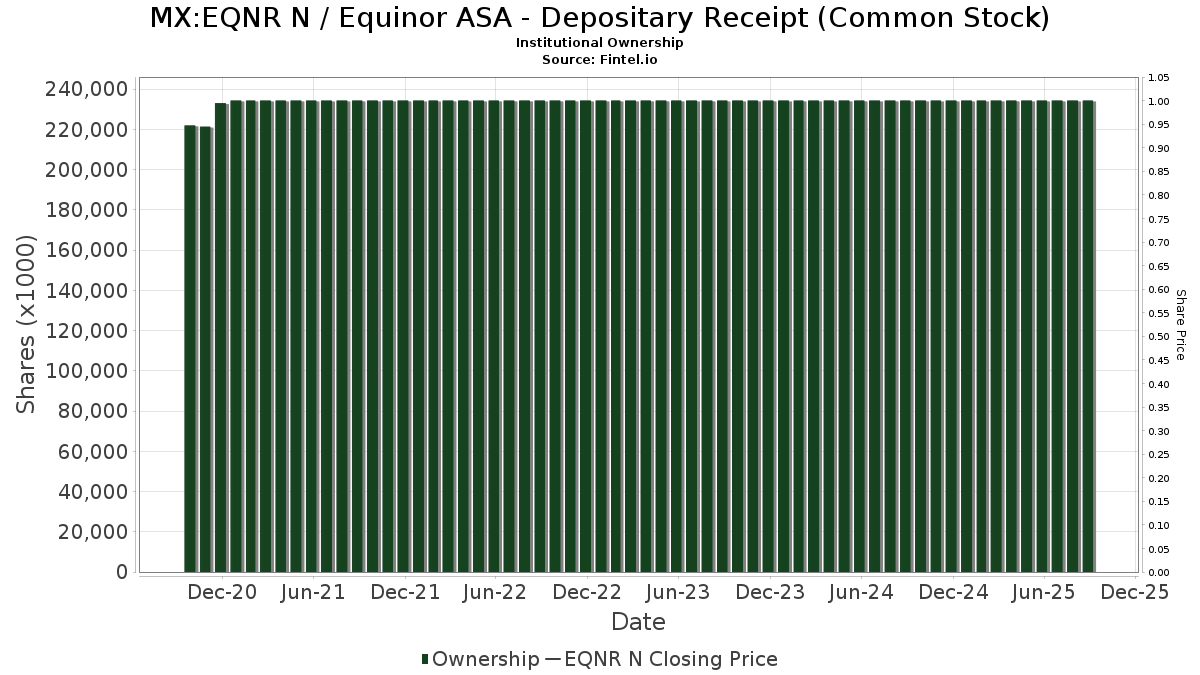
Własność instytucjonalna i akcjonariusze
Equinor ASA - Depositary Receipt (Common Stock) (MX:EQNR N) posiada 368 właściciele instytucjonalni i akcjonariusze, którzy złożyli formularze 13D/G lub 13F w Komisji Papierów Wartościowych (SEC). Instytucje te posiadają łącznie 180,556,611 akcji. Do największych akcjonariuszy należą Folketrygdfondet, Bank Of America Corp /de/, Morgan Stanley, Goldman Sachs Group Inc, Earnest Partners Llc, Wellington Management Group Llp, Fmr Llc, Arrowstreet Capital, Limited Partnership, Jpmorgan Chase & Co, and BlackRock, Inc. .
Equinor ASA - Depositary Receipt (Common Stock) (BMV:EQNR N) instytucjonalna struktura własności pokazuje aktualne pozycje w firmie według instytucji i funduszy, a także najnowsze zmiany w wielkości stanowisk. Głównymi akcjonariuszami mogą być inwestorzy indywidualni, fundusze inwestycyjne, fundusze hedgingowe lub instytucje. Załącznik 13D wskazuje, że inwestor posiada (lub posiadał) więcej niż 5% udziałów w spółce i zamierza (lub zamierzał) aktywnie dążyć do zmiany strategii biznesowej. Załącznik 13G wskazuje na inwestycję pasywną na poziomie ponad 5%.
Ocena sentymentu funduszu
Wskaźnik sentymentu funduszu (fka Ownership Accumulation Score) pozwala określić akcje, które są najczęściej kupowane przez fundusze. Jest to wynik zaawansowanego, wieloczynnikowego modelu ilościowego, który identyfikuje spółki o najwyższym poziomie akumulacji instytucjonalnej. Model oceny wykorzystuje kombinację całkowitego wzrostu liczby ujawnionych właścicieli, zmian w alokacji portfela wśród tych właścicieli i innych wskaźników. Liczba waha się od 0 do 100, przy czym wyższe liczby wskazują na wyższy poziom akumulacji w stosunku do innych spółek, a 50 oznacza średnią.
Częstotliwość aktualizacji: codziennie
Sprawdź Ownership Explorer, który zawiera listę firm o najwyższym rankingu.
AI+ Ask Fintel’s AI assistant about Equinor ASA - Depositary Receipt (Common Stock).
Select a question to share a public post with an AI-crafted answer.
Thinking of good questions…
Zgłoszenia 13F i NPORT
Szczegółowe dane dotyczące zgłoszeń 13F są bezpłatne. Szczegółowe dane dotyczące zgłoszeń NP wymagają członkostwa premium. Zielone rzędy wskazują nowe pozycje. Czerwone rzędy wskazują pozycje zamknięte. Kliknij w ikonę linku, aby zobaczyć pełną historię transakcji.
Aktualizacja
aby odblokować dane premium i eksportować do Excela ![]() .
.
| Data pliku | Źródło | Inwestor | Typ | Średnia cena (Est) |
Akcje | Akcje; Δ (%) |
Zgłoszono Wartość ($1000) |
Wartość; Δ (%) |
Przydział portu (%) |
|
|---|---|---|---|---|---|---|---|---|---|---|
| 2026-01-27 | 13F | Elevated Capital Advisors, LLC | 91 | 2 | ||||||
| 2025-11-26 | 13F | Lantern Wealth Advisors, LLC | 11 675 | 0,00 | 285 | -3,07 | ||||
| 2025-08-26 | NP | EQ ADVISORS TRUST - EQ/International Core Managed Volatility Portfolio Class IB | 60 990 | 134,10 | 1 533 | 132,63 | ||||
| 2025-11-14 | 13F | Mml Investors Services, Llc | 24 380 | 1,57 | 594 | |||||
| 2025-10-24 | 13F | Hemington Wealth Management | 22 | 0 | ||||||
| 2025-08-11 | 13F | Hexagon Capital Partners LLC | 0 | -100,00 | 0 | -100,00 | ||||
| 2026-01-29 | 13F | Aprio Wealth Management, LLC | 0 | -100,00 | 0 | |||||
| 2025-11-14 | 13F | Jane Street Group, Llc | 243 721 | -40,78 | 5 942 | -42,58 | ||||
| 2025-11-14 | 13F | Jane Street Group, Llc | Call | 134 000 | -28,23 | 3 267 | -30,41 | |||
| 2025-11-14 | 13F | Mariner Investment Group Llc | Call | 100 000 | 98 | |||||
| 2025-08-21 | NP | HAP - VanEck Vectors Natural Resources ETF | 19 514 | 5,82 | 491 | 0,62 | ||||
| 2025-11-14 | 13F | XTX Topco Ltd | 0 | -100,00 | 0 | -100,00 | ||||
| 2025-11-14 | 13F | Morgan Stanley | 8 757 132 | -1,38 | 213 499 | -4,36 | ||||
| 2025-11-13 | 13F | Van Eck Associates Corp | 20 173 | 3,14 | 0 | |||||
| 2026-01-29 | 13F | UMA Financial Services, Inc. | 35 | -67,89 | 1 | -100,00 | ||||
| 2025-11-12 | 13F | Rodgers Brothers Inc. | 24 900 | -8,79 | 607 | -11,52 | ||||
| 2025-11-14 | 13F | Jane Street Group, Llc | Put | 61 100 | -4,53 | 1 490 | -7,40 | |||
| 2026-02-05 | 13F | Gabelli Funds Llc | 367 500 | 0,00 | 8 684 | -3,07 | ||||
| 2026-02-05 | 13F | AlphaCore Capital LLC | 11 431 | -30,67 | 270 | -32,67 | ||||
| 2026-02-04 | 13F | Pure Financial Advisors, Inc. | 8 465 | 200 | ||||||
| 2025-08-26 | NP | GLBIX - Leuthold Global Fund Institutional Class | 2 516 | 63 | ||||||
| 2025-11-17 | 13F | GWM Advisors LLC | 19 968 | 4 240,87 | 487 | 4 318,18 | ||||
| 2026-02-06 | 13F | Intrust Bank Na | 34 073 | -3,53 | 805 | -6,50 | ||||
| 2026-01-15 | 13F | Nisa Investment Advisors, Llc | 300 | 0,00 | 7 | 0,00 | ||||
| 2026-01-21 | 13F | Seed Wealth Management, Inc. | 9 260 | 0,00 | 219 | -3,11 | ||||
| 2025-11-10 | 13F | MAI Capital Management | 106 | -95,47 | 3 | -96,55 | ||||
| 2026-01-16 | 13F | Perigon Wealth Management, LLC | 16 416 | 29,86 | 388 | 25,65 | ||||
| 2025-11-14 | 13F | ICONIQ Capital, LLC | 0 | -100,00 | 0 | -100,00 | ||||
| 2025-08-14 | 13F | Two Sigma Investments, Lp | 0 | -100,00 | 0 | |||||
| 2026-02-03 | 13F | Ballentine Partners, LLC | 0 | -100,00 | 0 | |||||
| 2026-01-29 | 13F | Cherokee Insurance Co | 18 944 | 0,00 | 448 | -3,04 | ||||
| 2026-02-09 | 13F | Malaga Cove Capital, LLC | 11 625 | 275 | ||||||
| 2025-11-14 | 13F | Vident Advisory, LLC | 109 986 | -1,25 | 2 681 | -4,25 | ||||
| 2025-08-13 | 13F | Employees Retirement System of Texas | 0 | -100,00 | 0 | |||||
| 2025-11-14 | 13F | Strategic Wealth Partners, Ltd. | 250 | 0,00 | 6 | 0,00 | ||||
| 2025-11-07 | 13F | Sierra Ocean, Llc | 0 | -100,00 | 0 | -100,00 | ||||
| 2026-01-29 | 13F | Ashton Thomas Private Wealth, LLC | 200 349 | 4 734 | ||||||
| 2025-11-14 | 13F | Gts Securities Llc | 116 968 | 209,87 | 2 852 | 200,74 | ||||
| 2026-01-30 | 13F | Us Bancorp \de\ | 33 206 | -38,52 | 785 | -40,43 | ||||
| 2025-11-12 | 13F | Barclays Plc | 0 | -100,00 | 0 | |||||
| 2025-11-13 | 13F | Arrowstreet Capital, Limited Partnership | 2 516 147 | -39,60 | 61 344 | -41,43 | ||||
| 2025-08-14 | 13F | Schonfeld Strategic Advisors LLC | 0 | -100,00 | 0 | |||||
| 2025-11-03 | 13F | Townsquare Capital Llc | 0 | -100,00 | 0 | -100,00 | ||||
| 2025-08-27 | NP | RYEIX - Energy Fund Investor Class | 5 488 | -14,20 | 138 | -18,93 | ||||
| 2025-11-12 | 13F | Neuberger Berman Group LLC | 53 435 | 1,23 | 1 303 | -1,88 | ||||
| 2025-11-14 | 13F | Jain Global LLC | 11 751 | -75,70 | 286 | -76,46 | ||||
| 2026-01-26 | 13F | Asset Dedication, LLC | 750 | 0,00 | 18 | -5,56 | ||||
| 2025-08-14 | 13F | Millennium Management Llc | Put | 0 | -100,00 | 0 | -100,00 | |||
| 2026-02-10 | 13F | Acadian Asset Management Llc | 0 | -100,00 | 0 | |||||
| 2025-08-26 | NP | Profunds - Profund Vp Europe 30 | 23 605 | 2,98 | 593 | -2,15 | ||||
| 2025-11-12 | 13F | Principal Securities, Inc. | 1 801 | -4,35 | 44 | -8,51 | ||||
| 2025-11-14 | 13F | Walleye Capital LLC | Call | 0 | -100,00 | 0 | -100,00 | |||
| 2026-02-05 | 13F | Elyxium Wealth, LLC | 131 | 3 | ||||||
| 2025-10-16 | 13F | Ellsworth Advisors, LLC | 0 | -100,00 | 0 | -100,00 | ||||
| 2025-11-14 | 13F | Walleye Capital LLC | 0 | -100,00 | 0 | -100,00 | ||||
| 2025-10-10 | 13F | Fiduciary Financial Group, Llc | 0 | -100,00 | 0 | |||||
| 2025-11-14 | 13F | Walleye Capital LLC | Put | 0 | -100,00 | 0 | -100,00 | |||
| 2025-11-13 | 13F | Guggenheim Capital Llc | 49 860 | 23,15 | 1 216 | 19,47 | ||||
| 2026-01-05 | 13F | GAMMA Investing LLC | 6 148 | 7,80 | 145 | 4,32 | ||||
| 2025-11-14 | 13F | Credit Agricole S A | 0 | -100,00 | 0 | -100,00 | ||||
| 2025-11-21 | 13F | Bell Investment Advisors, Inc | 213 | 22,41 | 5 | 25,00 | ||||
| 2025-11-13 | 13F | O'shaughnessy Asset Management, Llc | 722 816 | 0,23 | 17 622 | -2,80 | ||||
| 2025-11-19 | 13F | Sunbelt Securities, Inc. | 184 | 4 | ||||||
| 2025-11-14 | 13F | Ameriprise Financial Inc | 60 466 | -32,58 | 1 474 | -34,61 | ||||
| 2026-01-14 | 13F | Hunter Perkins Capital Management, LLC | 0 | -100,00 | 0 | |||||
| 2025-11-05 | 13F | J.w. Cole Advisors, Inc. | 0 | -100,00 | 0 | |||||
| 2025-11-14 | 13F | Bank Of Nova Scotia | 10 950 | -7,12 | 267 | -10,14 | ||||
| 2025-11-04 | 13F | Umb Bank N A/mo | 67 | -19,28 | 2 | -50,00 | ||||
| 2026-02-06 | 13F | Redmont Wealth Advisors Llc | 171 | 0,00 | 4 | 0,00 | ||||
| 2026-01-06 | 13F | Investors Research Corp | 12 108 | 0,00 | 286 | -3,05 | ||||
| 2025-11-04 | 13F | Callan Family Office, LLC | 28 256 | 7,87 | 689 | 4,56 | ||||
| 2025-11-07 | 13F | Zions Bancorporation, National Association /ut/ | 33 | 10,00 | 1 | |||||
| 2026-02-03 | 13F | Crossmark Global Holdings, Inc. | 72 615 | -14,91 | 1 716 | -17,55 | ||||
| 2026-01-05 | 13F | Park Avenue Securities Llc | 16 365 | 52,23 | 0 | |||||
| 2025-11-12 | 13F | American Century Companies Inc | 387 216 | 26,21 | 9 440 | 22,41 | ||||
| 2025-11-14 | 13F | Binnacle Investments Inc | 35 | 0,00 | 1 | |||||
| 2026-02-03 | 13F/A | Bank Of America Corp /de/ | 15 759 942 | 30,24 | 384 227 | 26,31 | ||||
| 2026-02-02 | 13F | CENTRAL TRUST Co | 55 | 3,77 | 1 | 0,00 | ||||
| 2026-01-29 | 13F | UBS Group AG | 477 273 | -71,50 | 11 278 | -72,38 | ||||
| 2025-09-25 | NP | DFAI - Dimensional International Core Equity Market ETF | 21 846 | 0,00 | 563 | 15,64 | ||||
| 2026-01-21 | 13F | Steadtrust LLC | 0 | -100,00 | 0 | -100,00 | ||||
| 2025-11-12 | 13F | GW&K Investment Management, LLC | 130 | 0,00 | 0 | |||||
| 2025-11-14 | 13F | Beacon Pointe Advisors, LLC | 11 415 | -7,41 | 278 | -10,03 | ||||
| 2025-09-26 | NP | KEAT - Keating Active ETF | 115 010 | 2,19 | 2 962 | 18,06 | ||||
| 2026-01-30 | 13F | Kiker Wealth Management, LLC | 0 | -100,00 | 0 | |||||
| 2025-11-12 | 13F | BlackRock, Inc. | 2 010 564 | 21,51 | 49 018 | 17,83 | ||||
| 2025-11-14 | 13F | SALT Holding Corp. | 20 136 | 491 | ||||||
| 2026-01-14 | 13F | LVW Advisors, LLC | 10 714 | 253 | ||||||
| 2026-01-20 | 13F | Toth Financial Advisory Corp | 4 | 0 | ||||||
| 2026-01-26 | 13F | Drum Hill Capital, LLC | 169 584 | -3,30 | 4 007 | -6,27 | ||||
| 2025-11-17 | 13F | Pin Oak Investment Advisors Inc | 0 | -100,00 | 0 | |||||
| 2026-01-23 | 13F | Assetmark, Inc | 450 | -26,71 | 11 | -28,57 | ||||
| 2026-02-03 | 13F | Chesapeake Capital Corp /il/ | 0 | -100,00 | 0 | |||||
| 2026-01-30 | 13F | Ares Financial Consulting, LLC | 20 | 0 | ||||||
| 2026-02-10 | 13F | Principia Wealth Advisory, LLC | 12 | -47,83 | 0 | |||||
| 2026-01-20 | 13F | Signaturefd, Llc | 22 804 | -15,98 | 539 | -18,61 | ||||
| 2025-11-14 | 13F | Quantinno Capital Management LP | 164 579 | 23,22 | 4 012 | 19,51 | ||||
| 2025-09-29 | NP | ICOW - Pacer Developed Markets International Cash Cows 100 ETF | 0 | -100,00 | 0 | -100,00 | ||||
| 2025-11-12 | 13F | Blair William & Co/il | 14 448 | 67,38 | 352 | 62,21 | ||||
| 2025-11-14 | 13F | Gotham Asset Management, LLC | 10 466 | -0,15 | 255 | -3,04 | ||||
| 2025-11-12 | 13F | West Family Investments, Inc. | 14 905 | 0,00 | 363 | -2,94 | ||||
| 2025-11-14 | 13F | Virtu Financial LLC | 35 607 | 25,75 | 1 | |||||
| 2025-11-13 | 13F | Capital Fund Management S.a. | 232 687 | 75,41 | 5 673 | 70,13 | ||||
| 2026-01-27 | 13F | Evergreen Capital Management Llc | 14 412 | -43,23 | 341 | -44,98 | ||||
| 2025-11-14 | 13F | Ieq Capital, Llc | 38 435 | 25,01 | 937 | 21,37 | ||||
| 2025-11-12 | 13F | Insigneo Advisory Services, Llc | 0 | -100,00 | 0 | |||||
| 2025-10-17 | 13F | Hm Payson & Co | 2 474 | 0,00 | 60 | -3,23 | ||||
| 2026-02-10 | 13F | CIBC Asset Management Inc | 12 093 | 10,56 | 286 | 7,14 | ||||
| 2026-01-30 | 13F | Oakworth Capital, Inc. | 226 | 5 | ||||||
| 2026-02-06 | 13F | Global Retirement Partners, LLC | 1 318 | 86,16 | 31 | 82,35 | ||||
| 2025-10-31 | 13F | Y-Intercept (Hong Kong) Ltd | 285 097 | -50,04 | 6 951 | -51,55 | ||||
| 2025-08-12 | 13F | Pacer Advisors, Inc. | 0 | -100,00 | 0 | -100,00 | ||||
| 2026-02-10 | 13F | Bruce G. Allen Investments, LLC | 2 419 | -3,32 | 57 | -5,00 | ||||
| 2026-01-22 | 13F/A | Cresset Asset Management, LLC | 27 415 | 0,01 | 668 | -3,05 | ||||
| 2025-09-26 | NP | EPIN - Harbor International Equity ETF | 2 590 | 67 | ||||||
| 2025-11-14 | 13F | Hrt Financial Lp | 312 501 | 39,69 | 8 | 40,00 | ||||
| 2025-11-14 | 13F | Wealthspire Advisors, LLC | 0 | 0 | ||||||
| 2025-08-26 | NP | UPAR - UPAR Ultra Risk Parity ETF | 6 459 | -2,55 | 162 | -7,43 | ||||
| 2026-01-30 | 13F/A | M&t Bank Corp | 11 735 | -27,85 | 277 | -30,30 | ||||
| 2025-10-15 | 13F | Stephens Consulting, LLC | 0 | -100,00 | 0 | |||||
| 2025-11-14 | 13F | Mercer Global Advisors Inc /adv | 80 682 | -10,80 | 1 967 | -13,46 | ||||
| 2026-01-20 | 13F | Lazari Capital Management, Inc. | 0 | -100,00 | 0 | |||||
| 2026-02-05 | 13F | May Hill Capital, LLC | 12 398 | 40,23 | 293 | 35,81 | ||||
| 2026-02-06 | 13F | Harvest Portfolios Group Inc. | 77 102 | 11,45 | 1 822 | 8,01 | ||||
| 2025-08-26 | NP | EQ ADVISORS TRUST - 1290 VT SmartBeta Equity Portfolio Class IB | 13 171 | -61,56 | 331 | -61,82 | ||||
| 2026-02-10 | 13F | Grandfield & Dodd, Llc | 10 000 | 0,00 | 236 | -2,88 | ||||
| 2026-01-06 | 13F | Sanctuary Advisors, LLC | 24 687 | 653 | ||||||
| 2025-11-05 | 13F | Smartleaf Asset Management LLC | 5 518 | 22,38 | 137 | 20,35 | ||||
| 2025-11-14 | 13F | D. E. Shaw & Co., Inc. | 512 221 | 44,84 | 12 488 | 40,46 | ||||
| 2025-11-13 | 13F | Quadrant Capital Group Llc | 53 978 | -1,58 | 1 316 | -4,57 | ||||
| 2025-11-14 | 13F | Northern Trust Corp | 810 764 | -2,80 | 19 766 | -5,74 | ||||
| 2025-11-13 | 13F | Twin Tree Management, LP | Call | 0 | -100,00 | 0 | -100,00 | |||
| 2025-11-14 | 13F | Citadel Advisors Llc | Put | 180 400 | -25,21 | 4 398 | -27,46 | |||
| 2026-02-03 | 13F | Anfield Capital Management, LLC | 224 | 0,00 | 5 | 0,00 | ||||
| 2025-11-14 | 13F | Alliancebernstein L.p. | 0 | -100,00 | 0 | |||||
| 2026-02-04 | 13F | Pandora Wealth, Inc. | 250 | 0,00 | 6 | -16,67 | ||||
| 2025-11-14 | 13F | Citadel Advisors Llc | Call | 261 500 | 208,74 | 6 375 | 199,44 | |||
| 2025-11-17 | 13F | Palisade Asset Management, LLC | 12 | 0 | ||||||
| 2025-11-14 | 13F | Citadel Advisors Llc | 397 612 | -25,60 | 9 694 | -27,85 | ||||
| 2025-11-14 | 13F | Wealth Preservation Advisors, LLC | 93 | 0,00 | 2 | 0,00 | ||||
| 2026-01-12 | 13F | CVA Family Office, LLC | 0 | -100,00 | 0 | |||||
| 2025-11-14 | 13F/A | Skopos Labs, Inc. | 31 003 | -1,09 | 778 | -1,27 | ||||
| 2026-02-03 | 13F | Navigoe, LLC | 531 | 0,00 | 0 | |||||
| 2025-09-26 | NP | CVAR - Cultivar ETF | 9 970 | 0,79 | 257 | 16,36 | ||||
| 2025-11-14 | 13F | Aquatic Capital Management LLC | 270 630 | 31,61 | 6 598 | 27,63 | ||||
| 2026-02-09 | 13F | Schwarz Dygos Wheeler Investment Advisors Llc | 11 390 | 0,26 | 269 | -2,54 | ||||
| 2025-08-27 | NP | TPIAX - Timothy Plan International Fund Class A | 135 000 | -5,59 | 3 394 | -10,29 | ||||
| 2026-02-10 | 13F | State of Wyoming | 4 296 | -4,66 | 102 | -7,34 | ||||
| 2025-08-11 | 13F | Bradley Foster & Sargent Inc/ct | 0 | -100,00 | 0 | |||||
| 2026-02-10 | 13F | Private Wealth Asset Management, LLC | 0 | -100,00 | 0 | |||||
| 2026-01-16 | 13F | FNY Investment Advisers, LLC | 0 | -100,00 | 0 | |||||
| 2026-01-29 | 13F | Rakuten Securities, Inc. | 683 | -8,20 | 16 | -11,11 | ||||
| 2026-02-03 | 13F | Manske Wealth Management | 10 160 | -4,20 | 240 | -6,98 | ||||
| 2025-08-14 | 13F | DRW Securities, LLC | 0 | -100,00 | 0 | -100,00 | ||||
| 2026-01-30 | 13F | North Star Investment Management Corp. | 99 | 2 | ||||||
| 2026-01-23 | 13F | Farther Finance Advisors, LLC | 11 712 | -39,27 | 277 | -41,28 | ||||
| 2025-11-06 | 13F | Essex Investment Management Co Llc | 10 773 | 0,00 | 263 | -2,96 | ||||
| 2026-02-10 | 13F | Goldman Sachs Group Inc | 8 281 960 | 29,58 | 195 703 | 25,59 | ||||
| 2026-02-10 | 13F | Goldman Sachs Group Inc | Call | 45 000 | 1 063 | |||||
| 2025-10-31 | 13F | Chilton Capital Management Llc | 0 | -100,00 | 0 | -100,00 | ||||
| 2026-01-14 | 13F | Jfs Wealth Advisors, Llc | 374 | 0,00 | 9 | -11,11 | ||||
| 2026-02-06 | 13F | Profund Advisors Llc | 27 151 | 23,90 | 642 | 20,04 | ||||
| 2025-11-13 | 13F | Capital Fund Management S.a. | Put | 26 000 | 157,43 | 634 | 150,20 | |||
| 2025-11-13 | 13F | Capital Fund Management S.a. | Call | 63 400 | 14,03 | 1 546 | 10,59 | |||
| 2026-01-22 | 13F | Financial Consulate, Inc | 12 | 0 | ||||||
| 2026-01-16 | 13F | Linden Thomas Advisory Services, LLC | 26 533 | 2,13 | 627 | -1,11 | ||||
| 2026-01-20 | 13F | Ascent Group, LLC | 0 | -100,00 | 0 | -100,00 | ||||
| 2025-11-14 | 13F | Peak6 Llc | 4 017 | -88,10 | 98 | -88,56 | ||||
| 2025-11-26 | 13F/A | Jpmorgan Chase & Co | 2 286 328 | 1 437,69 | 55 741 | 1 391,57 | ||||
| 2026-01-20 | 13F | Independence Bank of Kentucky | 37 | 1 | ||||||
| 2025-11-14 | 13F | Peak6 Llc | Call | 288 100 | -48,16 | 7 024 | -49,73 | |||
| 2026-02-06 | 13F | HighTower Advisors, LLC | 113 255 | -66,47 | 2 676 | -67,50 | ||||
| 2025-11-13 | 13F | Jump Financial, LLC | 420 400 | 6,12 | 10 249 | 2,91 | ||||
| 2025-11-13 | 13F | Private Advisor Group, LLC | 15 004 | -6,17 | 366 | -9,20 | ||||
| 2025-11-17 | 13F | FSA Wealth Management LLC | 117 | 0,00 | 3 | 0,00 | ||||
| 2025-11-06 | 13F | Wedbush Securities Inc | 16 899 | -28,39 | 0 | |||||
| 2025-08-14 | 13F | Banque Transatlantique SA | 0 | -100,00 | 0 | -100,00 | ||||
| 2026-02-05 | 13F | Allworth Financial LP | 3 399 | 8,25 | 80 | 5,26 | ||||
| 2026-01-28 | 13F | CAPROCK Group, Inc. | 55 642 | -45,55 | 1 315 | -47,73 | ||||
| 2025-09-29 | NP | CVY - Invesco Zacks Multi-Asset Income ETF This fund is a listed as child fund of Invesco Ltd. and if that institution has disclosed ownership in this security, then these positions will not be double counted when calculating total shares and total value | 26 586 | -30,81 | 685 | -20,09 | ||||
| 2025-08-13 | 13F | Continuum Advisory, LLC | 0 | -100,00 | 0 | -100,00 | ||||
| 2026-01-27 | 13F | Zurcher Kantonalbank (Zurich Cantonalbank) | 1 620 | 0,00 | 38 | -2,56 | ||||
| 2025-08-14 | 13F | Price T Rowe Associates Inc /md/ | 0 | -100,00 | 0 | -100,00 | ||||
| 2025-08-11 | 13F | Frank, Rimerman Advisors LLC | 0 | -100,00 | 0 | |||||
| 2026-01-12 | 13F | Brucke Financial, Inc. | 12 036 | -17,89 | 284 | -19,09 | ||||
| 2025-08-27 | NP | TPDAX - Timothy Plan Defensive Strategies Fund Class A | 6 311 | 0,00 | 159 | -4,82 | ||||
| 2025-11-14 | 13F | Toroso Investments, LLC | 74 475 | -8,64 | 1 816 | -11,42 | ||||
| 2026-01-29 | 13F | Dunhill Financial, LLC | 533 | 0,00 | 13 | 0,00 | ||||
| 2026-02-09 | 13F | Todd Asset Management Llc | 15 944 | 0,00 | 377 | -3,09 | ||||
| 2026-02-02 | 13F | CX Institutional | 0 | -100,00 | 0 | |||||
| 2025-11-14 | 13F | Cetera Investment Advisers | 102 879 | -5,30 | 2 508 | -8,17 | ||||
| 2025-11-14 | 13F | Earnest Partners Llc | 3 887 088 | -1,51 | 94 767 | -4,49 | ||||
| 2025-11-17 | 13F | Parvin Asset Management, LLC | 21 990 | -18,68 | 536 | -21,06 | ||||
| 2025-11-14 | 13F | WealthTrust Axiom LLC | 26 250 | -1,69 | 640 | -4,77 | ||||
| 2026-02-03 | 13F | Costello Asset Management, INC | 3 140 | -17,65 | 74 | -19,57 | ||||
| 2026-02-10 | 13F/A | Northwestern Mutual Wealth Management Co | 3 079 | -2,99 | 73 | -6,49 | ||||
| 2026-02-06 | 13F | Larson Financial Group LLC | 88 | 266,67 | 2 | |||||
| 2025-08-26 | NP | GMOI - GMO International Value ETF | 153 954 | 35,94 | 3 870 | 29,22 | ||||
| 2026-02-02 | 13F | Fifth Third Bancorp | 576 | 112,55 | 14 | 116,67 | ||||
| 2026-01-08 | 13F | Gryphon Financial Partners LLC | 0 | -100,00 | 0 | |||||
| 2026-01-30 | 13F | Keating Investment Counselors Inc | 248 975 | 1,29 | 5 883 | -1,82 | ||||
| 2026-01-21 | 13F | SJS Investment Consulting Inc. | 258 | 6 | ||||||
| 2026-02-06 | 13F | New Millennium Group LLC | 6 950 | 195,37 | 164 | 187,72 | ||||
| 2025-11-14 | 13F | Axa S.a. | 0 | -100,00 | 0 | -100,00 | ||||
| 2025-09-25 | NP | DFAX - Dimensional World ex U.S. Core Equity 2 ETF | 21 493 | 0,00 | 553 | 15,45 | ||||
| 2025-08-14 | 13F | Old Mission Capital Llc | 0 | -100,00 | 0 | -100,00 | ||||
| 2025-11-04 | 13F | Jones Financial Companies Lllp | 13 043 | 104,34 | 333 | 108,13 | ||||
| 2026-02-09 | 13F | Frazier Financial Advisors, LLC | 176 | 576,92 | 4 | |||||
| 2025-08-27 | NP | RYDEX VARIABLE TRUST - Energy Fund Variable Annuity | 3 421 | -22,07 | 86 | -25,86 | ||||
| 2026-02-10 | 13F | Westpac Banking Corp | 4 917 | 0,00 | 116 | -2,52 | ||||
| 2025-11-12 | 13F | LPL Financial LLC | Put | 0 | -100,00 | 0 | -100,00 | |||
| 2025-11-14 | 13F | Millennium Management Llc | Call | 91 800 | 55,59 | 2 238 | 50,91 | |||
| 2025-12-09 | 13F/A | Tudor Investment Corp Et Al | Call | 23 200 | 31,82 | 566 | 27,83 | |||
| 2026-01-27 | 13F | Checchi Capital Advisers, LLC | 23 403 | -15,29 | 553 | -17,83 | ||||
| 2025-10-30 | 13F | Parkside Financial Bank & Trust | 660 | -5,31 | 16 | -5,88 | ||||
| 2026-01-20 | 13F | Analyst IMS Investment Management Services Ltd. | 9 020 | 0,00 | 0 | |||||
| 2025-11-06 | 13F | Ameritas Advisory Services, LLC | 0 | -100,00 | 0 | -100,00 | ||||
| 2026-01-23 | 13F | Freestone Capital Holdings, LLC | 39 574 | -0,24 | 935 | -3,31 | ||||
| 2025-11-14 | 13F | Squarepoint Ops LLC | Put | 0 | -100,00 | 0 | -100,00 | |||
| 2026-01-21 | 13F | Aaron Wealth Advisors LLC | 0 | -100,00 | 0 | |||||
| 2025-11-14 | 13F | Millennium Management Llc | 96 604 | -74,59 | 2 355 | -75,36 | ||||
| 2025-12-09 | 13F/A | Tudor Investment Corp Et Al | Put | 10 700 | 261 | |||||
| 2026-02-02 | 13F | Truist Financial Corp | 10 740 | 10,06 | 254 | 6,75 | ||||
| 2025-11-14 | 13F | Aqr Capital Management Llc | 46 000 | 27,60 | 1 121 | 23,73 | ||||
| 2025-08-29 | NP | Gabelli Dividend & Income Trust | 367 500 | -2,78 | 9 239 | -7,60 | ||||
| 2026-01-23 | 13F | Brown, Lisle/cummings, Inc. | 25 | 0,00 | 1 | |||||
| 2025-11-12 | 13F | NewSquare Capital LLC | 0 | -100,00 | 0 | |||||
| 2025-08-14 | 13F | Engineers Gate Manager LP | 0 | -100,00 | 0 | -100,00 | ||||
| 2025-08-26 | NP | EQ ADVISORS TRUST - EQ/Wellington Energy Portfolio Class IB | 38 511 | 0,42 | 968 | -4,54 | ||||
| 2025-11-14 | 13F | Balyasny Asset Management Llc | 115 609 | 1 177,17 | 2 819 | 1 141,41 | ||||
| 2026-02-06 | 13F | Motco | 200 | 0,00 | 5 | 0,00 | ||||
| 2025-10-27 | 13F | Janney Montgomery Scott LLC | 15 634 | -3,36 | 0 | |||||
| 2026-02-09 | 13F | Harbour Investments, Inc. | 113 | -75,96 | 3 | -81,82 | ||||
| 2026-01-21 | 13F | Sowell Financial Services LLC | 11 298 | 15,37 | 267 | 11,76 | ||||
| 2025-11-13 | 13F | Quadrature Capital Ltd | 14 686 | -71,13 | 358 | -72,04 | ||||
| 2025-12-15 | 13F/A | Mirabella Financial Services Llp | 300 000 | 7 314 | ||||||
| 2026-02-03 | 13F | Ethic Inc. | 14 386 | -2,59 | 340 | -5,83 | ||||
| 2025-11-12 | 13F | CIBC Bancorp USA Inc. | 876 391 | 21 366 | ||||||
| 2025-12-09 | 13F/A | Tudor Investment Corp Et Al | 0 | -100,00 | 0 | -100,00 | ||||
| 2025-10-22 | 13F | McIlrath & Eck, LLC | 0 | -100,00 | 0 | -100,00 | ||||
| 2025-10-29 | 13F | Inspire Advisors, LLC | 21 911 | 8,59 | 534 | 5,33 | ||||
| 2025-08-12 | 13F | Atlas Capital Advisors Llc | 7 758 | 38,09 | 195 | 31,76 | ||||
| 2026-02-09 | 13F | Unified Investment Management | 22 183 | 0,96 | 524 | -2,06 | ||||
| 2025-08-14 | 13F | Barometer Capital Management Inc. | 0 | -100,00 | 0 | -100,00 | ||||
| 2025-11-13 | 13F | Glenmede Investment Management, LP | 0 | -100,00 | 0 | |||||
| 2026-02-10 | 13F | Savant Capital, LLC | 13 049 | 308 | ||||||
| 2025-11-12 | 13F | Brinker Capital Investments, LLC | 55 125 | 17,61 | 1 344 | 14,01 | ||||
| 2025-08-12 | 13F | Coldstream Capital Management Inc | 0 | -100,00 | 0 | -100,00 | ||||
| 2025-11-13 | 13F | Total Investment Management Inc | 0 | -100,00 | 0 | -100,00 | ||||
| 2025-11-06 | 13F | Rhumbline Advisers | 29 345 | -13,10 | 715 | -15,68 | ||||
| 2026-01-27 | 13F | Bayforest Capital Ltd | 9 763 | 231 | ||||||
| 2025-09-25 | NP | DXIV - Dimensional International Vector Equity ETF | 137 | 0,00 | 4 | 0,00 | ||||
| 2026-02-09 | 13F | Leavell Investment Management, Inc. | 18 050 | 427 | ||||||
| 2025-11-14 | 13F | DRW Securities, LLC | Put | 16 700 | 402 | |||||
| 2026-02-03 | 13F | SBI Securities Co., Ltd. | 13 412 | 35,60 | 317 | 31,12 | ||||
| 2025-11-14 | 13F | DRW Securities, LLC | Call | 32 400 | 780 | |||||
| 2025-08-14 | 13F | Carolinas Wealth Consulting Llc | 99 | 3 | ||||||
| 2025-11-06 | 13F | Whipplewood Advisors, LLC | 0 | -100,00 | 0 | -100,00 | ||||
| 2026-02-06 | 13F | Pnc Financial Services Group, Inc. | 33 487 | -10,30 | 791 | -13,08 | ||||
| 2026-01-21 | 13F | Albion Financial Group /ut | 33 | 0,00 | 1 | |||||
| 2025-11-14 | 13F | Hollow Brook Wealth Management LLC | 89 310 | 0,60 | 2 177 | -2,42 | ||||
| 2025-11-13 | 13F | Invesco Ltd. | 121 155 | 22,55 | 2 954 | 18,83 | ||||
| 2025-10-07 | 13F | Thurston, Springer, Miller, Herd & Titak, Inc. | 0 | -100,00 | 0 | -100,00 | ||||
| 2025-11-14 | 13F | Raymond James Financial Inc | 64 344 | -32,10 | 1 569 | -34,17 | ||||
| 2025-09-25 | NP | HFCVX - Hennessy Cornerstone Value Fund Investor Class | 219 600 | 0,00 | 5 655 | 15,53 | ||||
| 2025-08-12 | 13F | Trexquant Investment LP | 0 | -100,00 | 0 | -100,00 | ||||
| 2025-09-26 | NP | EPDPX - EuroPac International Dividend Income Fund Class A | 55 000 | 0,00 | 1 416 | 15,59 | ||||
| 2026-02-04 | 13F | Independent Advisor Alliance | 21 468 | 3,38 | 507 | 0,20 | ||||
| 2025-11-13 | 13F | FORA Capital, LLC | 0 | -100,00 | 0 | -100,00 | ||||
| 2025-11-13 | 13F | Pathstone Holdings, LLC | 40 402 | 2,30 | 985 | -0,81 | ||||
| 2026-01-22 | 13F | Bear Mountain Capital, Inc. | 0 | -100,00 | 0 | |||||
| 2026-01-12 | 13F | Roble, Belko & Company, Inc | 100 | 0 | ||||||
| 2026-02-02 | 13F | Millstone Evans Group, LLC | 200 | 0,00 | 5 | 0,00 | ||||
| 2026-02-06 | 13F | Pzena Investment Management Llc | 29 555 | 78,75 | 698 | 73,20 | ||||
| 2026-02-06 | 13F | Cullen/frost Bankers, Inc. | 111 | 3 | ||||||
| 2025-09-26 | NP | FSGEX - Fidelity Series Global ex U.S. Index Fund This fund is a listed as child fund of Fmr Llc and if that institution has disclosed ownership in this security, then these positions will not be double counted when calculating total shares and total value | 37 | 0,00 | 1 | -100,00 | ||||
| 2026-02-03 | 13F | Sequoia Financial Advisors, LLC | 31 744 | 16,01 | 750 | 12,44 | ||||
| 2025-11-14 | 13F | Wellington Management Group Llp | 3 852 448 | 0,66 | 93 923 | -2,38 | ||||
| 2025-11-14 | 13F | Yaupon Capital Management LP | Put | 0 | -100,00 | 0 | -100,00 | |||
| 2026-01-08 | 13F | Wealth Enhancement Advisory Services, Llc | 15 423 | -11,47 | 357 | -19,23 | ||||
| 2025-10-30 | 13F | Ridgewood Investments LLC | 0 | -100,00 | 0 | -100,00 | ||||
| 2026-01-07 | 13F | Retirement Wealth Solutions LLC | 58 | 81,25 | 1 | |||||
| 2026-02-02 | 13F | Cornerstone Planning Group LLC | 17 | 0,00 | 0 | |||||
| 2025-08-26 | NP | BlackRock ESG Capital Allocation Trust This fund is a listed as child fund of BlackRock, Inc. and if that institution has disclosed ownership in this security, then these positions will not be double counted when calculating total shares and total value | 24 000 | 0,00 | 603 | -4,89 | ||||
| 2026-02-05 | 13F | John G Ullman & Associates Inc | 128 809 | 58,71 | 3 044 | 53,84 | ||||
| 2025-10-31 | 13F | JustInvest LLC | 72 655 | 0,23 | 1 771 | -2,80 | ||||
| 2026-02-05 | 13F | Mission Wealth Management, Lp | 11 555 | 0,10 | 273 | -2,85 | ||||
| 2026-01-05 | 13F | Union Bancaire Privee, UBP SA | 5 100 | 0,00 | 102 | -8,11 | ||||
| 2025-10-27 | 13F | Bogart Wealth, LLC | 0 | -100,00 | 0 | -100,00 | ||||
| 2025-08-21 | NP | MNCSX - Mercer Non-US Core Equity Fund Class I | 0 | -100,00 | 0 | -100,00 | ||||
| 2025-11-03 | 13F | Folketrygdfondet | 105 446 508 | -6,07 | 2 570 786 | -8,91 | ||||
| 2025-08-12 | 13F | Proequities, Inc. | 0 | 0 | ||||||
| 2026-01-27 | 13F | TD Waterhouse Canada Inc. | 1 398 | 28,97 | 33 | 26,92 | ||||
| 2025-11-12 | 13F | Dimensional Fund Advisors Lp | 128 082 | 3,00 | 3 123 | -0,13 | ||||
| 2025-11-14 | 13F | Point72 Asset Management, L.P. | Put | 0 | -100,00 | 0 | -100,00 | |||
| 2025-11-04 | 13F | IMC-Chicago, LLC | 0 | -100,00 | 0 | -100,00 | ||||
| 2025-08-27 | 13F/A | Squarepoint Ops LLC | Call | 0 | -100,00 | 0 | -100,00 | |||
| 2025-11-14 | 13F | Parallax Volatility Advisers, L.P. | Put | 110 000 | 0,00 | 2 682 | -3,04 | |||
| 2025-11-14 | 13F | Parallax Volatility Advisers, L.P. | Call | 61 000 | 0,00 | 1 487 | -3,00 | |||
| 2025-11-06 | 13F | Johnson Investment Counsel Inc | 8 849 | 0,00 | 216 | -3,15 | ||||
| 2025-11-14 | 13F | Parallax Volatility Advisers, L.P. | 7 934 | -44,15 | 193 | -45,94 | ||||
| 2026-01-13 | 13F | Mather Group, Llc. | 14 729 | -0,14 | 348 | -3,06 | ||||
| 2025-11-14 | 13F | Peak6 Llc | Put | 0 | -100,00 | 0 | -100,00 | |||
| 2025-08-13 | 13F | Marshall Wace, Llp | 0 | -100,00 | 0 | |||||
| 2025-08-26 | NP | MFUT - Cambria Chesapeake Pure Trend ETF | 5 297 | 133 | ||||||
| 2025-11-14 | 13F | Summit Trail Advisors, Llc | 21 968 | 88,15 | 536 | 82,59 | ||||
| 2026-01-20 | 13F | AdvisorNet Financial, Inc | 177 | 0,00 | 4 | 0,00 | ||||
| 2026-02-06 | 13F | EverSource Wealth Advisors, LLC | 3 961 | -26,40 | 94 | -29,01 | ||||
| 2025-10-31 | 13F | Fortis Capital Advisors, LLC | 0 | -100,00 | 0 | -100,00 | ||||
| 2026-01-21 | 13F | Naviter Wealth, LLC | 9 501 | -19,90 | 225 | -22,49 | ||||
| 2026-01-12 | 13F | Abound Wealth Management | 18 | 0,00 | 0 | |||||
| 2026-02-09 | 13F | Banco de Sabadell, S.A | 23 101 | -1,02 | 1 | |||||
| 2025-08-13 | 13F | Centiva Capital, LP | 0 | -100,00 | 0 | -100,00 | ||||
| 2026-01-30 | 13F | American Capital Advisory, LLC | 6 | -50,00 | 0 | |||||
| 2025-11-06 | 13F | Advisors Asset Management, Inc. | 101 930 | -2,88 | 2 485 | -5,80 | ||||
| 2025-11-12 | 13F | Simplex Trading, Llc | 24 765 | 1 | ||||||
| 2026-01-21 | 13F | Yousif Capital Management, Llc | 11 453 | 0,00 | 284 | 1,79 | ||||
| 2025-11-14 | 13F | CI Private Wealth, LLC | 49 434 | 6,16 | 1 205 | 2,99 | ||||
| 2025-10-08 | 13F/A | New York State Common Retirement Fund | 0 | -100,00 | 0 | -100,00 | ||||
| 2025-08-14 | 13F | Headlands Technologies LLC | 0 | -100,00 | 0 | -100,00 | ||||
| 2026-01-07 | 13F | CWA Asset Management Group, LLC | 0 | -100,00 | 0 | -100,00 | ||||
| 2026-02-10 | 13F | Bank of New York Mellon Corp | 24 010 | -24,44 | 567 | -26,74 | ||||
| 2025-08-26 | NP | RPAR - RPAR Risk Parity ETF | 41 842 | 7,09 | 1 052 | 1,74 | ||||
| 2026-02-02 | 13F | Mutual Advisors, LLC | 12 779 | 53,12 | 302 | 44,71 | ||||
| 2025-11-13 | 13F | Brown Brothers Harriman & Co | 0 | -100,00 | 0 | -100,00 | ||||
| 2026-01-21 | 13F | Penney Financial, LLC | 13 297 | 0,00 | 314 | -3,09 | ||||
| 2026-01-27 | 13F | Forum Financial Management, LP | 27 229 | 0,00 | 643 | -3,02 | ||||
| 2026-01-15 | 13F | Highline Wealth Partners Llc | 0 | -100,00 | 0 | |||||
| 2025-11-13 | 13F | Fmr Llc | 2 970 237 | 4,12 | 72 414 | 0,97 | ||||
| 2026-01-29 | 13F | Inscription Capital, LLC | 9 730 | -1,77 | 230 | -4,98 | ||||
| 2025-11-10 | 13F | Citigroup Inc | 552 276 | -62,28 | 13 464 | -63,42 | ||||
| 2025-11-14 | 13F | Kestra Advisory Services, LLC | 0 | -100,00 | 0 | |||||
| 2026-01-28 | 13F | Geneos Wealth Management Inc. | 147 | 0,00 | 3 | 0,00 | ||||
| 2025-11-10 | 13F | Citigroup Inc | Call | 76 500 | 1 865 | |||||
| 2025-11-13 | 13F | Empowered Funds, LLC | 116 418 | 2,79 | 2 838 | -0,32 | ||||
| 2026-01-14 | 13F | Klein Pavlis & Peasley Financial, Inc. | 25 411 | -2,45 | 600 | -5,51 | ||||
| 2026-01-27 | 13F | Belpointe Asset Management LLC | 0 | -100,00 | 0 | |||||
| 2025-11-14 | 13F | Mount Yale Investment Advisors, LLC | 0 | -100,00 | 0 | -100,00 | ||||
| 2025-11-14 | 13F | Ubs Asset Management Americas Inc | 0 | -100,00 | 0 | |||||
| 2026-01-16 | 13F | Crowley Wealth Management, Inc. | 0 | -100,00 | 0 | |||||
| 2026-02-10 | 13F | Godfrey Financial Associates, Inc. | 11 | 0 | ||||||
| 2025-11-10 | 13F | Charles Schwab Investment Management Inc | 83 864 | 6,14 | 2 045 | 2,92 | ||||
| 2025-11-14 | 13F | Royal Bank Of Canada | 116 401 | -75,54 | 2 838 | -76,28 | ||||
| 2026-01-09 | 13F | SG Americas Securities, LLC | 0 | -100,00 | 0 | |||||
| 2025-09-24 | NP | SNTKX - Steward International Enhanced Index Fund Class A | 52 698 | 0,00 | 1 357 | 15,50 | ||||
| 2025-11-14 | 13F | Brown Advisory Inc | 12 593 | 3,69 | 307 | 0,66 | ||||
| 2026-02-10 | 13F | Hillsdale Investment Management Inc. | 18 550 | -2,73 | 438 | -5,60 | ||||
| 2025-08-29 | NP | MPLAX - Praxis International Index Fund Class A | 10 747 | -35,54 | 270 | -38,78 | ||||
| 2026-01-29 | 13F | Quent Capital, LLC | 60 | 0,00 | 1 | 0,00 | ||||
| 2025-10-23 | 13F | Vermillion Wealth Management, Inc. | 389 | 9 | ||||||
| 2025-08-11 | 13F | Integrated Quantitative Investments LLC | 0 | -100,00 | 0 | |||||
| 2025-11-04 | 13F | Thrivent Financial For Lutherans | 0 | -100,00 | 0 | |||||
| 2025-11-14 | 13F | Squarepoint Ops LLC | 10 371 | -39,37 | 253 | -41,40 | ||||
| 2025-11-10 | 13F | Vestmark Advisory Solutions, Inc. | 0 | -100,00 | 0 | -100,00 | ||||
| 2026-02-10 | 13F | Root Financial Partners, LLC | 242 | 34,44 | 6 | 25,00 | ||||
| 2026-01-20 | 13F | American National Bank | 79 | 2 | ||||||
| 2026-02-05 | 13F | Chase Investment Counsel Corp | 0 | -100,00 | 0 | -100,00 | ||||
| 2025-11-14 | 13F | Integrated Wealth Concepts LLC | 15 075 | 5,49 | 368 | 2,23 | ||||
| 2025-11-24 | 13F | CIBC Private Wealth Group, LLC | 877 191 | 4,59 | 21 386 | 1,42 | ||||
| 2025-11-14 | 13F | Two Sigma Advisers, Lp | 18 100 | 10,37 | 441 | 7,04 | ||||
| 2026-02-10 | 13F | Dynasty Wealth Management, Llc | 14 358 | -22,89 | 339 | -25,17 | ||||
| 2025-11-13 | 13F | Russell Investments Group, Ltd. | 39 684 | 160,44 | 967 | 152,48 | ||||
| 2026-01-16 | 13F | Ipswich Investment Management Co., Inc. | 54 796 | -1,08 | 1 295 | -4,15 | ||||
| 2025-08-14 | 13F | Boston Private Wealth Llc | 0 | -100,00 | 0 | -100,00 | ||||
| 2026-02-03 | 13F | Manning & Napier Advisors Llc | 193 | 5 | ||||||
| 2026-01-16 | 13F | Ronald Blue Trust, Inc. | 15 135 | -1,16 | 358 | -4,29 | ||||
| 2025-11-14 | 13F | Aigen Investment Management, Lp | 21 503 | 160,26 | 524 | 153,14 | ||||
| 2025-10-22 | 13F | Cerity Partners LLC | 29 010 | 2,30 | 707 | -0,70 | ||||
| 2026-01-05 | 13F | Roxbury Financial LLC | 101 | 1,00 | 2 | 0,00 | ||||
| 2026-02-05 | 13F | Leuthold Group, Llc | 9 788 | 0,66 | 231 | -2,53 | ||||
| 2025-11-13 | 13F | UBS Group AG | Put | 0 | -100,00 | 0 | -100,00 | |||
| 2025-11-13 | 13F | Bridgewater Associates, LP | 284 620 | -69,32 | 6 939 | -70,24 | ||||
| 2025-11-12 | 13F | Corient IA LLC | 0 | -100,00 | 0 | |||||
| 2026-01-15 | 13F | Trust Co | 25 | 1 | ||||||
| 2025-11-13 | 13F | Beaird Harris Wealth Management, LLC | 63 | 14,55 | 2 | 0,00 | ||||
| 2025-11-10 | 13F | Atomi Financial Group, Inc. | 10 768 | 6,40 | 263 | 3,15 | ||||
| 2026-02-09 | 13F | Huntington National Bank | 19 | 0 | ||||||
| 2025-11-14 | 13F | Two Sigma Securities, Llc | 0 | -100,00 | 0 | -100,00 | ||||
| 2025-11-14 | 13F | AXA Investment Managers S.A. | 166 290 | 4 054 | ||||||
| 2026-02-05 | 13F | Bessemer Group Inc | 2 958 | 15,86 | 0 | |||||
| 2025-11-14 | 13F | Nfj Investment Group, Llc | 42 | -2,33 | 1 | 0,00 | ||||
| 2025-11-13 | 13F | Kayne Anderson Rudnick Investment Management Llc | 0 | -100,00 | 0 | |||||
| 2025-10-30 | 13F | Twin Peaks Wealth Advisors, LLC | 0 | -100,00 | 0 | |||||
| 2026-02-10 | 13F | Quantbot Technologies LP | 4 710 | -32,66 | 111 | -34,71 | ||||
| 2025-11-13 | 13F | Renaissance Technologies Llc | 529 310 | -12,45 | 12 905 | -15,10 | ||||
| 2025-09-29 | NP | VRAI - Virtus Real Asset Income ETF | 6 178 | 1,86 | 159 | 17,78 | ||||
| 2026-01-08 | 13F | True Wealth Design, LLC | 93 | -62,50 | 2 | -66,67 | ||||
| 2025-11-14 | 13F | IHT Wealth Management, LLC | 16 302 | 6,58 | 397 | 3,39 | ||||
| 2025-08-26 | NP | TFPN - Blueprint Chesapeake Multi-Asset Trend ETF | 18 439 | -395,92 | 464 | -382,32 | ||||
| 2026-02-11 | 13F | Vise Technologies, Inc. | 47 591 | -2,95 | 1 125 | -5,94 | ||||
| 2025-11-14 | 13F | National Bank Of Canada /fi/ | 39 045 | 1,13 | 952 | -1,96 | ||||
| 2025-11-14 | 13F | Hilltop Holdings Inc. | 0 | -100,00 | 0 | -100,00 | ||||
| 2025-11-12 | 13F | Steward Partners Investment Advisory, Llc | 10 447 | 1,31 | 255 | -1,93 | ||||
| 2026-02-09 | 13F | Putnam Fl Investment Management Co | 12 636 | -6,48 | 299 | -9,42 | ||||
| 2026-02-09 | 13F | Hantz Financial Services, Inc. | 21 633 | -42,48 | 1 | |||||
| 2025-11-12 | 13F | Foster Dykema Cabot & Partners, Llc | 1 960 | 0,00 | 48 | -4,08 | ||||
| 2026-02-02 | 13F | Advisors Preferred, LLC | 10 490 | -76,95 | 258 | -77,01 | ||||
| 2026-02-06 | 13F | Kilter Group LLC | 8 | 0,00 | 0 | |||||
| 2026-01-28 | 13F | Eagle Global Advisors Llc | 123 000 | -4,65 | 2 906 | -7,60 | ||||
| 2026-01-15 | 13F | Foster & Motley Inc | 76 032 | 1,99 | 2 | 0,00 | ||||
| 2025-11-13 | 13F | Wells Fargo & Company/mn | 181 200 | -4,13 | 4 418 | -7,03 | ||||
| 2026-02-03 | 13F | Gallacher Capital Management LLC | 19 180 | -31,87 | 453 | -33,97 | ||||
| 2026-02-10 | 13F | Bnp Paribas Arbitrage, Sa | Put | 900 | 2 127 | |||||
| 2026-01-30 | 13F | R Squared Ltd | 28 612 | 9,79 | 676 | 6,46 | ||||
| 2026-02-10 | 13F | Bnp Paribas Arbitrage, Sa | 109 380 | -85,73 | 2 585 | -86,18 | ||||
| 2025-11-14 | 13F | Rockefeller Capital Management L.P. | 24 268 | 45,13 | 592 | 40,71 | ||||
| 2025-11-14 | 13F | Verition Fund Management LLC | 614 000 | -58,56 | 14 969 | -59,81 | ||||
| 2025-11-14 | 13F | Mariner, LLC | 60 640 | -10,83 | 1 478 | -13,52 | ||||
| 2026-01-20 | 13F | Cromwell Holdings LLC | 2 743 | 0,00 | 65 | -3,03 | ||||
| 2025-11-20 | 13F/A | BRYN MAWR TRUST Co | 599 | -85,63 | 15 | -86,54 | ||||
| 2025-11-14 | 13F | Wolverine Trading, Llc | Put | 56 100 | 173,66 | 1 389 | 170,23 | |||
| 2026-02-06 | 13F | GPS Wealth Strategies Group, LLC | 0 | -100,00 | 0 | |||||
| 2025-11-14 | 13F | Lazard Asset Management Llc | 0 | -100,00 | 0 | |||||
| 2025-11-10 | 13F | Optiver Holding B.V. | 511 799 | 38 151,05 | 12 478 | 37 709,09 | ||||
| 2025-11-03 | 13F | Annis Gardner Whiting Capital Advisors, LLC | 0 | -100,00 | 0 | |||||
| 2025-11-14 | 13F | Glen Eagle Advisors, LLC | 595 | 532,98 | 14 | 600,00 | ||||
| 2025-11-14 | 13F | Manchester Capital Management LLC | 1 503 | 0,00 | 37 | -2,70 | ||||
| 2025-11-14 | 13F | Wolverine Trading, Llc | Call | 73 000 | -26,78 | 1 807 | -27,81 | |||
| 2025-11-13 | 13F | Twin Tree Management, LP | 0 | -100,00 | 0 | -100,00 | ||||
| 2025-11-13 | 13F | Twin Tree Management, LP | Put | 0 | -100,00 | 0 | -100,00 | |||
| 2025-11-12 | 13F | Ci Investments Inc. | 284 384 | -3,68 | 7 | -14,29 | ||||
| 2025-11-13 | 13F | Clear Street Markets Llc | 123 416 | 117,31 | 3 009 | 110,79 | ||||
| 2026-02-02 | 13F | Montag A & Associates Inc | 0 | -100,00 | 0 | |||||
| 2026-02-11 | 13F | Parallel Advisors, LLC | 6 248 | -36,72 | 148 | -38,75 | ||||
| 2025-11-12 | 13F | Creekmur Asset Management LLC | 0 | 0 | ||||||
| 2025-11-12 | 13F | LPL Financial LLC | 118 050 | -20,20 | 2 878 | -22,59 | ||||
| 2026-02-09 | 13F | Fisher Asset Management, LLC | 1 778 054 | -2,70 | 42 015 | -5,69 | ||||
| 2025-11-18 | 13F | Advisory Services Network, LLC | 567 | 14 | ||||||
| 2025-08-14 | 13F | Bridgefront Capital, LLC | 0 | -100,00 | 0 | -100,00 | ||||
| 2025-11-14 | 13F | CoreCommodity Management, LLC | 9 561 | 233 | ||||||
| 2025-11-14 | 13F | Brevan Howard Capital Management LP | 8 288 | 202 | ||||||
| 2026-02-05 | 13F | Cambridge Investment Research Advisors, Inc. | 54 157 | 130,29 | 1 | |||||
| 2026-01-28 | 13F | Davis Capital Management | 200 | 0,00 | 5 | 0,00 | ||||
| 2025-11-13 | 13F | Grantham, Mayo, Van Otterloo & Co. LLC | 174 517 | 10,49 | 4 255 | 7,15 | ||||
| 2025-11-14 | 13F | Walleye Trading LLC | Put | 59 900 | -48,67 | 1 460 | -50,22 | |||
| 2026-01-16 | 13F | Compagnie Lombard Odier SCmA | 3 500 | 83 | ||||||
| 2025-09-26 | NP | UEPIX - Europe 30 Profund Investor Class | 5 254 | 24,68 | 135 | 45,16 | ||||
| 2025-11-14 | 13F | Walleye Trading LLC | 19 028 | 24,61 | 464 | 20,89 | ||||
| 2025-11-14 | 13F | Logan Capital Management Inc | 228 921 | 39,10 | 5 581 | 34,90 | ||||
| 2025-11-14 | 13F | Walleye Trading LLC | Call | 36 800 | -44,66 | 897 | -46,32 | |||
| 2025-11-14 | 13F | Wetherby Asset Management Inc | 23 514 | 7,46 | 573 | 4,18 | ||||
| 2025-08-12 | 13F | Wayfinding Financial, LLC | 0 | -100,00 | 0 | |||||
| 2025-11-13 | 13F | Sei Investments Co | 1 115 848 | -2,27 | 27 204 | -5,22 | ||||
| 2025-09-25 | NP | DIHP - Dimensional International High Profitability ETF | 12 741 | 1,79 | 328 | 17,56 | ||||
| 2025-10-22 | 13F | Commonwealth Equity Services, Llc | 12 665 | 0 | ||||||
| 2026-02-05 | 13F | Td Private Client Wealth Llc | 3 561 | -51,47 | 84 | -52,81 | ||||
| 2025-11-14 | 13F | XY Capital Ltd | 132 157 | 1 010,56 | 3 222 | 977,26 | ||||
| 2026-01-14 | 13F | Spire Wealth Management | 0 | -100,00 | 0 | |||||
| 2025-11-19 | 13F | Captrust Financial Advisors | 15 066 | -12,49 | 367 | -15,05 | ||||
| 2026-01-16 | 13F | Trust Co Of Vermont | 500 | 0,00 | 12 | -8,33 | ||||
| 2026-02-04 | 13F | Abc Arbitrage Sa | 38 085 | -92,61 | 900 | -92,85 | ||||
| 2026-02-06 | 13F | Bare Financial Services, Inc | 354 | 11,32 | 8 | 14,29 | ||||
| 2026-02-02 | 13F | Qrg Capital Management, Inc. | 125 044 | 38,50 | 2 955 | 34,21 | ||||
| 2026-02-10 | 13F | Td Asset Management Inc | 9 711 | 5,44 | 229 | 2,23 | ||||
| 2025-11-13 | 13F | Bank Of Montreal /can/ | 163 907 | 19,72 | 3 996 | 16,13 | ||||
| 2025-10-06 | 13F | Moody National Bank Trust Division | 0 | -100,00 | 0 | -100,00 | ||||
| 2025-11-12 | 13F | Group One Trading, L.p. | 0 | -100,00 | 0 | -100,00 | ||||
| 2025-11-26 | 13F | Strategic Advocates LLC | 1 000 | 24 | ||||||
| 2026-02-10 | 13F | ESL Trust Services, LLC | 0 | -100,00 | 0 | |||||
| 2025-09-25 | NP | DFIV - Dimensional International Value ETF | 933 | 0,00 | 24 | 20,00 | ||||
| 2026-01-28 | 13F | Columbia Asset Management | 12 885 | 49,22 | 304 | 44,76 | ||||
| 2026-01-23 | 13F | Steigerwald, Gordon & Koch Inc. | 0 | -100,00 | 0 | -100,00 | ||||
| 2026-01-23 | 13F | Ritholtz Wealth Management | 202 025 | -31,78 | 4 774 | -33,88 | ||||
| 2025-11-12 | 13F | First Trust Advisors Lp | 29 207 | 86,60 | 712 | 81,17 | ||||
| 2026-01-26 | 13F | Private Trust Co Na | 667 | 24,91 | 16 | 15,38 | ||||
| 2026-01-08 | 13F | Versant Capital Management, Inc | 10 661 | -4,04 | 252 | -7,04 | ||||
| 2025-11-13 | 13F | UBS Group AG | Call | 0 | -100,00 | 0 | -100,00 | |||
| 2025-09-24 | NP | DAINX - Dunham International Stock Fund Class A | 0 | -100,00 | 0 | -100,00 | ||||
| 2025-10-15 | 13F | CWM Advisors, LLC | 9 804 | 21,35 | 239 | 17,73 | ||||
| 2025-11-14 | 13F | United Capital Financial Advisers, Llc | 23 722 | -0,22 | 578 | -3,18 | ||||
| 2026-01-08 | 13F | Grove Bank & Trust | 2 436 | -11,22 | 58 | -13,64 | ||||
| 2026-02-10 | 13F | Envestnet Asset Management Inc | 148 555 | -8,80 | 3 510 | -11,61 | ||||
| 2026-02-11 | 13F | OneAscent Investment Solutions LLC | 42 563 | 13,05 | 1 006 | 9,60 | ||||
| 2026-01-21 | 13F | Sound Income Strategies, LLC | 1 876 | 119,16 | 48 | 135,00 | ||||
| 2025-11-14 | 13F | Voloridge Investment Management, Llc | 362 285 | -63,34 | 8 833 | -64,45 | ||||
| 2026-01-15 | 13F | Allspring Global Investments Holdings, LLC | 0 | -100,00 | 0 | |||||
| 2025-11-14 | 13F | Creative Planning | 173 877 | 16,28 | 4 239 | 12,77 | ||||
| 2026-01-21 | 13F/A | Euro Pacific Asset Management, LLC | 318 372 | -0,44 | 8 | 0,00 | ||||
| 2025-09-25 | NP | DFIC - Dimensional International Core Equity 2 ETF | 2 932 | 0,00 | 75 | 15,38 | ||||
| 2025-11-14 | 13F | SRS Capital Advisors, Inc. | 1 331 | 95,74 | 32 | 88,24 | ||||
| 2026-01-23 | 13F | Rsm Us Wealth Management Llc | 9 989 | -4,01 | 236 | -7,11 | ||||
| 2026-01-26 | 13F | Cwm, Llc | 3 051 | 20,64 | 0 | |||||
| 2025-11-14 | 13F | Tower Research Capital LLC (TRC) | 338 595 | 725,16 | 8 255 | 700,58 | ||||
| 2026-01-30 | 13F | Turning Point Benefit Group, Inc. | 19 | 0,00 | 0 | |||||
| 2025-11-14 | 13F | Federation des caisses Desjardins du Quebec | 56 | 0,00 | 1 | 0,00 | ||||
| 2026-01-12 | 13F | Legacy Wealth Asset Management, LLC | 22 399 | -9,70 | 529 | -12,42 | ||||
| 2026-02-10 | 13F | Rothschild Investment Llc | 610 | -6,58 | 14 | -6,67 | ||||
| 2026-01-27 | 13F | Hennessy Advisors Inc | 204 800 | -5,27 | 4 839 | -8,18 | ||||
| 2025-11-14 | 13F | Susquehanna International Group, Llp | Call | 725 600 | -15,36 | 17 690 | -17,92 | |||
| 2025-11-05 | 13F | Coston, McIsaac & Partners | 0 | -100,00 | 0 | |||||
| 2025-11-14 | 13F | Susquehanna International Group, Llp | Put | 324 100 | 49,63 | 7 902 | 45,11 | |||
| 2025-11-14 | 13F | Flow Traders U.s. Llc | 8 706 | 0 | ||||||
| 2025-11-14 | 13F | Virtus Investment Advisers, Inc. | 7 067 | 14,39 | 172 | 10,97 | ||||
| 2025-08-13 | 13F/A | StoneX Group Inc. | 0 | -100,00 | 0 | |||||
| 2025-11-12 | 13F | Stifel Financial Corp | 72 332 | -1,55 | 1 763 | -4,55 | ||||
| 2025-11-14 | 13F | Advisor Group Holdings, Inc. | 22 080 | -11,30 | 543 | -13,69 | ||||
| 2026-01-13 | 13F | Kathmere Capital Management, LLC | 15 011 | -41,68 | 355 | -43,54 | ||||
| 2026-01-28 | 13F | Salomon & Ludwin, LLC | 161 | 25,78 | 4 | 0,00 | ||||
| 2026-02-06 | 13F | IFP Advisors, Inc | 736 | 13,41 | 17 | 13,33 | ||||
| 2025-11-19 | 13F | Caitong International Asset Management Co., Ltd | 618 | -86,28 | 15 | -86,73 | ||||
| 2025-10-08 | 13F | Rise Advisors, LLC | 4 | 0,00 | 0 | |||||
| 2025-10-09 | 13F | Voya Investment Management Llc | 170 570 | 0,00 | 4 158 | -3,03 | ||||
| 2025-11-14 | 13F | Semper Augustus Investments Group Llc | 573 731 | 12,45 | 13 988 | 9,05 | ||||
| 2026-02-10 | 13F | Natixis Advisors, L.p. | 69 262 | -17,06 | 2 | -50,00 | ||||
| 2025-11-03 | 13F | Golden State Wealth Management, LLC | 306 | 0,00 | 7 | 0,00 |