Podstawowe statystyki
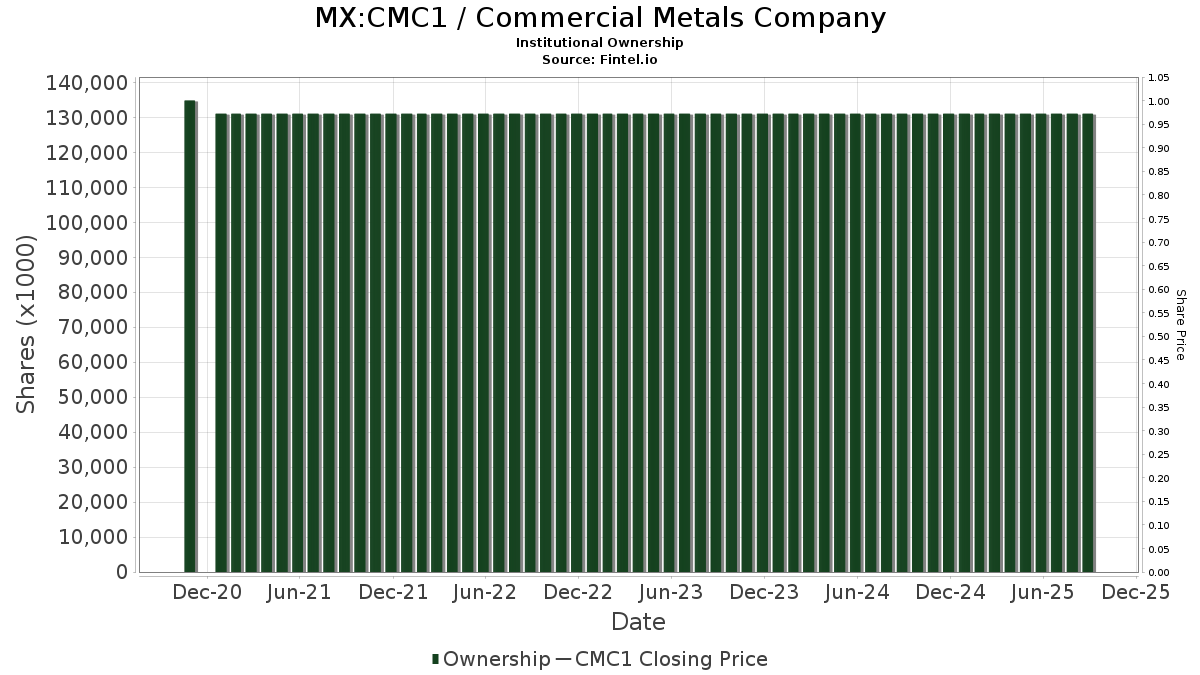
| Akcje instytucjonalne (długie) | 101 361 973 - 84,42% (ex 13D/G) - change of -3,97MM shares -2,94% MRQ |
| Wartość instytucjonalna (długa) | $ 6 761 349 USD ($1000) |
Własność instytucjonalna i akcjonariusze
Commercial Metals Company (MX:CMC1) posiada 486 właściciele instytucjonalni i akcjonariusze, którzy złożyli formularze 13D/G lub 13F w Komisji Papierów Wartościowych (SEC). Instytucje te posiadają łącznie 101,361,973 akcji. Do największych akcjonariuszy należą BlackRock, Inc., Vanguard Group Inc, Dimensional Fund Advisors Lp, State Street Corp, Fuller & Thaler Asset Management, Inc., Fmr Llc, Boston Partners, Geode Capital Management, Llc, Victory Capital Management Inc, and American Century Companies Inc .
Commercial Metals Company (BMV:CMC1) instytucjonalna struktura własności pokazuje aktualne pozycje w firmie według instytucji i funduszy, a także najnowsze zmiany w wielkości stanowisk. Głównymi akcjonariuszami mogą być inwestorzy indywidualni, fundusze inwestycyjne, fundusze hedgingowe lub instytucje. Załącznik 13D wskazuje, że inwestor posiada (lub posiadał) więcej niż 5% udziałów w spółce i zamierza (lub zamierzał) aktywnie dążyć do zmiany strategii biznesowej. Załącznik 13G wskazuje na inwestycję pasywną na poziomie ponad 5%.
Ocena sentymentu funduszu
Wskaźnik sentymentu funduszu (fka Ownership Accumulation Score) pozwala określić akcje, które są najczęściej kupowane przez fundusze. Jest to wynik zaawansowanego, wieloczynnikowego modelu ilościowego, który identyfikuje spółki o najwyższym poziomie akumulacji instytucjonalnej. Model oceny wykorzystuje kombinację całkowitego wzrostu liczby ujawnionych właścicieli, zmian w alokacji portfela wśród tych właścicieli i innych wskaźników. Liczba waha się od 0 do 100, przy czym wyższe liczby wskazują na wyższy poziom akumulacji w stosunku do innych spółek, a 50 oznacza średnią.
Częstotliwość aktualizacji: codziennie
Sprawdź Ownership Explorer, który zawiera listę firm o najwyższym rankingu.
AI+ Ask Fintel’s AI assistant about Commercial Metals Company.
Select a question to share a public post with an AI-crafted answer.
Thinking of good questions…
Zgłoszenia 13F i NPORT
Szczegółowe dane dotyczące zgłoszeń 13F są bezpłatne. Szczegółowe dane dotyczące zgłoszeń NP wymagają członkostwa premium. Zielone rzędy wskazują nowe pozycje. Czerwone rzędy wskazują pozycje zamknięte. Kliknij w ikonę linku, aby zobaczyć pełną historię transakcji.
Aktualizacja
aby odblokować dane premium i eksportować do Excela ![]() .
.
| Data pliku | Źródło | Inwestor | Typ | Średnia cena (Est) |
Akcje | Akcje; Δ (%) |
Zgłoszono Wartość ($1000) |
Wartość; Δ (%) |
Przydział portu (%) |
|
|---|---|---|---|---|---|---|---|---|---|---|
| 2026-02-17 | 13F | Turas Capital Management LP | 46 000 | 3 184 | ||||||
| 2026-04-03 | 13F | Adirondack Trust Co | 1 900 | -40,62 | 117 | -47,51 | ||||
| 2026-04-13 | 13F | Massmutual Trust Co Fsb/adv | 251 | 2,87 | 15 | -6,25 | ||||
| 2026-02-11 | 13F | Deutsche Bank Ag\ | 475 645 | 81,56 | 32 924 | 119,42 | ||||
| 2026-02-13 | 13F | Nfj Investment Group, Llc | 182 031 | 12 600 | ||||||
| 2026-04-20 | 13F | Ritholtz Wealth Management | 6 400 | 2,19 | 393 | -9,24 | ||||
| 2026-02-13 | 13F | Ubs Asset Management Americas Inc | 278 469 | 1,19 | 19 276 | 22,29 | ||||
| 2026-02-09 | 13F | Legal & General Group Plc | 183 023 | -18,27 | 12 669 | -1,24 | ||||
| 2026-02-17 | 13F | Bank Of America Corp /de/ | 870 228 | 31,76 | 60 237 | 59,23 | ||||
| 2026-02-11 | 13F | Inceptionr Llc | 0 | -100,00 | 0 | |||||
| 2026-02-02 | 13F | Danske Bank A/s | 180 786 | 8 939,30 | 12 514 | 10 877,19 | ||||
| 2026-04-21 | 13F | Fruth Investment Management | 17 400 | 0,00 | 1 | 0,00 | ||||
| 2026-02-17 | 13F | VestGen Advisors, LLC | 5 041 | 349 | ||||||
| 2026-04-30 | 13F | Valued Wealth Advisors LLC | 3 | -57,14 | 0 | |||||
| 2026-02-17 | 13F | Cim Investment Mangement Inc | 3 672 | 0,00 | 254 | 20,95 | ||||
| 2025-11-04 | 13F | Raleigh Capital Management Inc. | 0 | -100,00 | 0 | |||||
| 2026-04-10 | 13F | Abound Wealth Management | 4 | 0,00 | 0 | |||||
| 2026-01-29 | 13F | UBS Group AG | 1 185 354 | -22,07 | 82 050 | -5,83 | ||||
| 2026-02-18 | 13F | GWM Advisors LLC | 3 463 | 4 517,33 | 240 | 5 875,00 | ||||
| 2026-02-17 | 13F | Citadel Advisors Llc | Put | 17 700 | -82,68 | 1 225 | -79,07 | |||
| 2026-02-17 | 13F | Captrust Financial Advisors | 6 222 | 27,55 | 431 | 54,12 | ||||
| 2026-02-04 | 13F | Versor Investments LP | 11 277 | -3,43 | 781 | 16,77 | ||||
| 2026-02-17 | 13F | Citadel Advisors Llc | 36 878 | -97,26 | 2 553 | -96,69 | ||||
| 2026-02-17 | 13F | Parallax Volatility Advisers, L.P. | Call | 0 | -100,00 | 0 | ||||
| 2026-04-14 | 13F | Hudson Valley Investment Advisors Inc /adv | 0 | -100,00 | 0 | |||||
| 2026-04-07 | 13F | Mb, Levis & Associates, Llc | 0 | -100,00 | 0 | |||||
| 2026-02-17 | 13F | Citadel Advisors Llc | Call | 36 100 | -74,01 | 2 499 | -68,60 | |||
| 2026-02-10 | 13F | IF Advisors, LLC | 6 155 | 426 | ||||||
| 2026-02-17 | 13F | Bridgeway Capital Management Inc | 63 100 | 23,24 | 4 368 | 48,94 | ||||
| 2025-11-13 | 13F | Total Investment Management Inc | 0 | -100,00 | 0 | |||||
| 2026-02-04 | 13F | Bailard, Inc. | 10 000 | 9,77 | 692 | 32,82 | ||||
| 2026-02-11 | 13F | Manchester Capital Management LLC | 45 | 3 | ||||||
| 2026-04-22 | 13F | Pictet Asset Management Holding SA | 17 699 | 2,90 | 1 087 | -8,66 | ||||
| 2026-02-09 | 13F | Huntington National Bank | 1 | 0,00 | 0 | |||||
| 2026-02-17 | 13F | Jump Financial, LLC | 71 918 | 484,22 | 4 978 | 606,10 | ||||
| 2026-02-05 | 13F | Qsemble Capital Management, LP | 49 885 | 118,57 | 3 453 | 164,19 | ||||
| 2026-02-17 | 13F | Raymond James Financial Inc | 135 699 | -11,45 | 9 393 | 7,01 | ||||
| 2026-02-18 | 13F | Vident Advisory, LLC | 16 077 | 1 113 | ||||||
| 2026-04-29 | 13F | Envestnet Portfolio Solutions, Inc. | 20 268 | 1 245 | ||||||
| 2026-04-08 | 13F | DiNuzzo Private Wealth, Inc. | 28 | -3,45 | 2 | -50,00 | ||||
| 2026-02-06 | 13F | Lsv Asset Management | 340 000 | 27,96 | 24 | 53,33 | ||||
| 2026-02-17 | 13F | Aster Capital Management (DIFC) Ltd | 369 | -71,17 | 26 | -65,75 | ||||
| 2026-02-11 | 13F | Franklin Resources Inc | 1 876 718 | -39,38 | 129 906 | -26,74 | ||||
| 2026-03-09 | 13F | EMC Capital Management | 1 821 | -14,99 | 0 | |||||
| 2026-04-28 | 13F | Harbor Capital Advisors, Inc. | 526 | -20,78 | 0 | |||||
| 2026-02-04 | 13F | First Eagle Investment Management, LLC | 272 349 | 3,07 | 18 852 | 24,54 | ||||
| 2026-04-24 | 13F | Yousif Capital Management, Llc | 35 001 | -4,88 | 2 150 | -22,41 | ||||
| 2026-02-17 | 13F | Moore Capital Management, Lp | 0 | -100,00 | 0 | |||||
| 2026-04-27 | 13F | Fideuram - Intesa Sanpaolo Private Banking S.p.a. | 11 601 | -12,66 | 713 | -22,52 | ||||
| 2026-02-05 | 13F | AlphaCore Capital LLC | 3 072 | 213 | ||||||
| 2026-04-17 | 13F | Bell Investment Advisors, Inc | 52 | -13,33 | 3 | -25,00 | ||||
| 2026-03-26 | 13F/A | Peak6 Llc | Put | 0 | -100,00 | 0 | -100,00 | |||
| 2026-02-11 | 13F | Jpmorgan Chase & Co | 768 050 | -13,18 | 53 164 | 4,92 | ||||
| 2026-02-12 | 13F | MetLife Investment Management, LLC | 113 778 | -6,81 | 7 876 | 12,61 | ||||
| 2026-02-17 | 13F | D. E. Shaw & Co., Inc. | 15 324 | 337,83 | 1 061 | 430,00 | ||||
| 2026-04-29 | 13F | Harbour Capital Advisors, LLC | 11 615 | 0,00 | 808 | -3,12 | ||||
| 2026-02-13 | 13F | Transamerica Financial Advisors, Inc. | 231 | 16 | ||||||
| 2026-04-14 | 13F | Nbc Securities, Inc. | 4 400 | -6,18 | 270 | -16,67 | ||||
| 2026-04-28 | 13F | Bogart Wealth, LLC | 39 | 21,88 | 2 | 0,00 | ||||
| 2026-05-01 | 13F | Wealthspire Advisors, LLC | 4 206 | -32,38 | 258 | -40,00 | ||||
| 2026-02-17 | 13F | SummitTX Capital, L.P. | 56 956 | -38,75 | 3 942 | -25,99 | ||||
| 2026-02-09 | 13F | William Blair Investment Management, Llc | 516 792 | -9,47 | 35 772 | 9,40 | ||||
| 2026-04-02 | 13F | Byrne Asset Management LLC | 370 | 23 | ||||||
| 2026-04-13 | 13F | Mather Group, Llc. | 84 | 5 | ||||||
| 2026-04-14 | 13F | Bay Harbor Wealth Management, LLC | 18 | 28,57 | 1 | |||||
| 2026-02-09 | 13F | Quest Partners LLC | 5 819 | -47,05 | 403 | -36,09 | ||||
| 2026-04-14 | 13F | Congress Asset Management Co /ma | 73 821 | 16,77 | 4 535 | 3,61 | ||||
| 2026-02-05 | 13F | Northwestern Mutual Investment Management Company, Llc | 24 827 | -0,49 | 1 719 | 20,22 | ||||
| 2026-04-10 | 13F | Armstrong Advisory Group, Inc | 724 | 0,00 | 44 | -12,00 | ||||
| 2026-02-13 | 13F | Aptus Capital Advisors, LLC | 3 859 | 0,23 | 267 | 21,36 | ||||
| 2026-01-12 | 13F | Rialto Wealth Management, LLC | 28 | 7,69 | 2 | 0,00 | ||||
| 2026-04-16 | 13F | Baron Wealth Management LLC | 3 820 | 0,16 | 235 | -11,03 | ||||
| 2026-01-15 | 13F | Allspring Global Investments Holdings, LLC | 208 662 | -7,60 | 14 980 | 12,53 | ||||
| 2026-04-10 | 13F | Brucke Financial, Inc. | 3 589 | 220 | ||||||
| 2026-01-27 | 13F | Zurcher Kantonalbank (Zurich Cantonalbank) | 35 781 | 2 477 | ||||||
| 2026-04-30 | 13F | Cambridge Investment Research Advisors, Inc. | 15 526 | 11,84 | 1 | |||||
| 2026-02-13 | 13F | Wells Fargo & Company/mn | 460 622 | 53,40 | 31 884 | 85,37 | ||||
| 2026-02-17 | 13F | Tudor Investment Corp Et Al | 0 | -100,00 | 0 | -100,00 | ||||
| 2026-04-30 | 13F | Mv Capital Management, Inc. | 2 | 0,00 | 0 | |||||
| 2026-04-06 | 13F | CX Institutional | 342 | 0,00 | 0 | |||||
| 2026-04-29 | 13F | Oregon Public Employees Retirement Fund | 22 729 | 2,71 | 1 396 | -8,82 | ||||
| 2026-02-13 | 13F | Pinnacle Wealth Planning Services, Inc. | 865 | 60 | ||||||
| 2026-02-13 | 13F | Rhumbline Advisers | 339 966 | -12,48 | 23 532 | 5,77 | ||||
| 2026-04-24 | 13F | Root Financial Partners, LLC | 434 | -15,07 | 27 | -25,71 | ||||
| 2026-04-28 | 13F | Unison Advisors LLC | 13 930 | 0,24 | 856 | -11,03 | ||||
| 2026-02-04 | 13F | Ameritas Advisory Services, LLC | 0 | -100,00 | 0 | |||||
| 2026-02-17 | 13F | Holocene Advisors, LP | 0 | -100,00 | 0 | |||||
| 2026-01-29 | 13F | Ashton Thomas Private Wealth, LLC | 4 904 | 3,13 | 339 | 24,63 | ||||
| 2026-04-15 | 13F | Activest Wealth Management | 19 | 58,33 | 1 | |||||
| 2026-02-13 | 13F | MAI Capital Management | 47 | 370,00 | 3 | |||||
| 2026-04-15 | 13F | Fortitude Family Office, LLC | 133 | 17,70 | 8 | 14,29 | ||||
| 2026-04-14 | 13F | Nova Wealth Management, Inc. | 1 450 | 0,00 | 89 | -11,00 | ||||
| 2026-02-13 | 13F | Walleye Capital LLC | Put | 6 500 | 209,52 | 450 | 274,17 | |||
| 2026-02-13 | 13F | Walleye Capital LLC | 36 795 | -58,92 | 2 547 | -50,37 | ||||
| 2026-02-13 | 13F | Walleye Capital LLC | Call | 9 500 | 5,56 | 658 | 27,57 | |||
| 2026-04-17 | 13F | Tectonic Advisors Llc | 27 945 | 7,53 | 1 717 | -4,56 | ||||
| 2026-02-09 | 13F | Keating Financial Advisory Services, Inc. | 134 | 9 | ||||||
| 2026-02-17 | 13F | Shelton Capital Management | 3 734 | -9,92 | 258 | 8,86 | ||||
| 2026-02-17 | 13F | Optiver Holding B.V. | 677 | -27,90 | 47 | -13,21 | ||||
| 2025-11-12 | 13F | 111 Capital | 0 | -100,00 | 0 | |||||
| 2026-02-18 | 13F | Mackenzie Financial Corp | 7 149 | -5,07 | 499 | 15,55 | ||||
| 2026-04-27 | 13F | Mount Yale Investment Advisors, LLC | 3 746 | 230 | ||||||
| 2026-02-06 | 13F | HighTower Advisors, LLC | 21 920 | -46,57 | 1 517 | -35,45 | ||||
| 2026-04-10 | 13F/A | OP Asset Management Ltd | 5 043 | 310 | ||||||
| 2026-04-20 | 13F | Ronald Blue Trust, Inc. | 6 156 | -13,06 | 378 | -22,86 | ||||
| 2026-02-10 | 13F | Savant Capital, LLC | 8 494 | 11,90 | 588 | 35,25 | ||||
| 2026-04-27 | 13F | Independent Solutions Wealth Management, LLC | 7 920 | 6,31 | 487 | -5,63 | ||||
| 2026-02-13 | 13F/A | Ontario Teachers Pension Plan Board | 0 | -100,00 | 0 | |||||
| 2026-05-01 | 13F/A | Custom Index Systems, Llc | 5 277 | 324 | ||||||
| 2026-01-28 | 13F | Geneos Wealth Management Inc. | 5 967 | 0,05 | 413 | 21,11 | ||||
| 2026-02-02 | 13F | Horizon Investments, LLC | 1 339 | 92 | ||||||
| 2026-02-17 | 13F | Merewether Investment Management, LP | 0 | -100,00 | 0 | |||||
| 2026-02-17 | 13F | Fmr Llc | 3 725 677 | 6,50 | 257 891 | 28,70 | ||||
| 2026-04-22 | 13F | Sterling Capital Management LLC | 10 212 | -51,63 | 627 | -57,08 | ||||
| 2026-02-09 | 13F | Kestra Investment Management, LLC | 0 | -100,00 | 0 | |||||
| 2026-02-11 | 13F | Picton Mahoney Asset Management | 23 | 0,00 | 2 | |||||
| 2026-02-10 | 13F | Easterly Investment Partners Llc | 320 825 | -25,99 | 22 208 | -10,57 | ||||
| 2026-02-04 | 13F | Virginia Retirement Systems Et Al | 24 114 | 56,44 | 1 669 | 89,23 | ||||
| 2026-02-12 | 13F | Bank Of Montreal /can/ | 14 293 | -5,49 | 989 | 14,20 | ||||
| 2026-04-15 | 13F | Financial Management Professionals, Inc. | 331 | 20 | ||||||
| 2026-02-13 | 13F | Manufacturers Life Insurance Company, The | 0 | -100,00 | 0 | |||||
| 2026-04-28 | 13F | Quent Capital, LLC | 130 | 4,00 | 8 | -12,50 | ||||
| 2025-11-03 | 13F | Trifecta Capital Advisors, LLC | 0 | -100,00 | 0 | |||||
| 2025-11-13 | 13F | Eisler Capital Management Ltd. | 0 | -100,00 | 0 | -100,00 | ||||
| 2026-02-17 | 13F | Advisor Group Holdings, Inc. | 8 284 | 18,31 | 574 | 42,54 | ||||
| 2026-02-17 | 13F | Wellington Management Group Llp | 0 | -100,00 | 0 | |||||
| 2026-02-17 | 13F | Encompass Capital Advisors LLC | 599 871 | 41 523 | ||||||
| 2026-04-17 | 13F | Fifth Third Wealth Advisors LLC | 4 164 | 4,00 | 256 | -7,94 | ||||
| 2026-01-30 | 13F | Mitsubishi UFJ Trust & Banking Corp | 39 373 | 34,62 | 2 725 | 62,69 | ||||
| 2026-02-12 | 13F | Jane Street Group, Llc | Put | 0 | -100,00 | 0 | -100,00 | |||
| 2026-01-30 | 13F | Canandaigua National Bank & Trust Co | 3 874 | -2,86 | 268 | 17,54 | ||||
| 2026-02-13 | 13F | Neuberger Berman Group LLC | 8 528 | -2,01 | 590 | 18,47 | ||||
| 2026-04-07 | 13F | Farther Finance Advisors, LLC | 15 194 | 8,64 | 955 | -1,34 | ||||
| 2026-02-09 | 13F | Harbour Investments, Inc. | 1 872 | 0,21 | 130 | 21,70 | ||||
| 2026-02-10 | 13F/A | Northwestern Mutual Wealth Management Co | 5 019 | -11,31 | 347 | 7,10 | ||||
| 2026-03-12 | 13F/A | Peak6 Llc | Call | 0 | -100,00 | 0 | -100,00 | |||
| 2026-02-12 | 13F | Skandinaviska Enskilda Banken AB (publ) | 80 256 | 2 556,60 | 5 555 | 3 110,98 | ||||
| 2026-02-13 | 13F | Gts Securities Llc | 0 | -100,00 | 0 | |||||
| 2026-04-27 | 13F | Koshinski Asset Management, Inc. | 3 301 | 8,48 | 203 | -3,81 | ||||
| 2026-02-06 | 13F | Covestor Ltd | 328 | -15,90 | 0 | |||||
| 2026-02-13 | 13F | Toroso Investments, LLC | 58 491 | 57,50 | 4 049 | 90,31 | ||||
| 2026-02-17 | 13F | Guggenheim Capital Llc | 6 309 | -16,60 | 437 | 0,69 | ||||
| 2026-04-30 | 13F | Nisa Investment Advisors, Llc | 24 577 | -0,61 | 1 510 | -11,81 | ||||
| 2026-02-11 | 13F | Empowered Funds, LLC | 3 948 | -3,42 | 273 | 16,67 | ||||
| 2026-01-29 | 13F | Comerica Bank | 43 104 | -8,16 | 2 984 | 10,97 | ||||
| 2026-05-01 | 13F | Avion Wealth | 48 | 0,00 | 0 | |||||
| 2026-02-17 | 13F | Ameriprise Financial Inc | 639 328 | 7,43 | 44 254 | 29,82 | ||||
| 2026-04-16 | 13F | Ellsworth Advisors, LLC | 66 292 | 4 072 | ||||||
| 2025-11-13 | 13F | Dynamic Technology Lab Private Ltd | 0 | -100,00 | 0 | |||||
| 2026-02-11 | 13F | Rise Advisors, LLC | 0 | -100,00 | 0 | |||||
| 2026-04-21 | 13F | Foster & Motley Inc | 10 228 | -2,15 | 1 | |||||
| 2026-02-13 | 13F | Mariner, LLC | 27 936 | 151,54 | 1 934 | 204,09 | ||||
| 2026-02-17 | 13F | NEOS Investment Management LLC | 45 380 | 3 141 | ||||||
| 2026-02-13 | 13F | Entropy Technologies, LP | 7 897 | 547 | ||||||
| 2026-02-09 | 13F | Atlantic Trust, LLC | 87 | 8,75 | 6 | 50,00 | ||||
| 2026-04-30 | 13F | Sequoia Financial Advisors, LLC | 7 854 | -29,53 | 482 | -37,48 | ||||
| 2026-02-10 | 13F | New Mexico Educational Retirement Board | 23 900 | 0,00 | 2 | 0,00 | ||||
| 2026-04-20 | 13F | Inscription Capital, LLC | 0 | -100,00 | 0 | |||||
| 2026-02-13 | 13F | National Bank Of Canada /fi/ | 507 | -11,05 | 35 | 9,38 | ||||
| 2026-02-13 | 13F | Pathstone Holdings, LLC | 26 159 | 9,75 | 1 811 | 32,60 | ||||
| 2026-02-17 | 13F | State Of Wisconsin Investment Board | 165 694 | 0,79 | 11 469 | 21,80 | ||||
| 2026-02-09 | 13F | Smithfield Trust Co | 135 | 0,00 | 0 | |||||
| 2026-04-13 | 13F | Fractal Investments LLC | 6 200 | 0,00 | 381 | -11,42 | ||||
| 2026-04-27 | 13F | New York State Teachers Retirement System | 100 631 | 0,31 | 6 | 0,00 | ||||
| 2026-04-29 | 13F | Montag A & Associates Inc | 1 000 | 0,00 | 61 | -11,59 | ||||
| 2026-02-12 | 13F | Qtron Investments LLC | 3 399 | 235 | ||||||
| 2026-02-13 | 13F | Caxton Associates Llp | 8 164 | 565 | ||||||
| 2026-02-17 | 13F | ISAM Funds (UK) Ltd | 3 422 | 237 | ||||||
| 2026-02-17 | 13F | First Manhattan Co | 228 048 | -1,82 | 15 785 | 18,65 | ||||
| 2025-11-03 | 13F | TD Waterhouse Canada Inc. | 0 | -100,00 | 0 | -100,00 | ||||
| 2026-02-17 | 13F | Brevan Howard Capital Management LP | 0 | -100,00 | 0 | |||||
| 2026-02-13 | 13F | Martingale Asset Management L P | 25 388 | 264,61 | 1 757 | 341,46 | ||||
| 2025-11-14 | 13F | Peak6 Llc | 0 | -100,00 | 0 | -100,00 | ||||
| 2025-11-13 | 13F | Arrowstreet Capital, Limited Partnership | 0 | -100,00 | 0 | |||||
| 2026-02-13 | 13F | Public Sector Pension Investment Board | 44 115 | 3 054 | ||||||
| 2026-02-17 | 13F | Quadrature Capital Ltd | 19 724 | 1 365 | ||||||
| 2026-02-12 | 13F | Principal Securities, Inc. | 0 | -100,00 | 0 | -100,00 | ||||
| 2026-04-30 | 13F | Kornitzer Capital Management Inc /ks | 20 401 | 0,02 | 1 253 | -11,20 | ||||
| 2026-02-12 | 13F | Cibc World Markets Corp | 7 371 | -47,28 | 510 | -25,33 | ||||
| 2026-04-07 | 13F | CoreCap Advisors, LLC | 1 078 | 0,00 | 66 | -10,81 | ||||
| 2026-02-13 | 13F | Cornerstone Financial Management LLC | 12 | 1 | ||||||
| 2026-02-17 | 13F | Alliancebernstein L.p. | 232 507 | -1,65 | 16 094 | 18,85 | ||||
| 2026-02-17 | 13F | Tower Research Capital LLC (TRC) | 8 882 | -23,46 | 615 | -7,53 | ||||
| 2026-02-12 | 13F | Davy Global Fund Management Ltd | 20 854 | -19,44 | 1 444 | -2,63 | ||||
| 2026-02-17 | 13F | Janus Henderson Group Plc | 490 476 | -23,03 | 33 951 | -6,98 | ||||
| 2026-04-30 | 13F | Private Trust Co Na | 115 | -15,44 | 7 | -22,22 | ||||
| 2026-05-01 | 13F | Arizona State Retirement System | 30 485 | -2,46 | 1 873 | -13,45 | ||||
| 2026-04-14 | 13F | Grant Private Wealth Management Inc | 3 919 | 0,00 | 241 | -11,44 | ||||
| 2026-01-28 | 13F | Crown Advisors Management, Inc. | 0 | -100,00 | 0 | |||||
| 2026-02-13 | 13F | Healthcare Of Ontario Pension Plan Trust Fund | 39 269 | 2 718 | ||||||
| 2026-05-01 | 13F | Rakuten Securities, Inc. | 80 | 0,00 | 5 | -20,00 | ||||
| 2026-02-11 | 13F | O'shaughnessy Asset Management, Llc | 26 967 | 25,52 | 1 867 | 51,71 | ||||
| 2025-11-14 | 13F | Schonfeld Strategic Advisors LLC | Call | 0 | -100,00 | 0 | -100,00 | |||
| 2026-04-20 | 13F | Louisiana State Employees Retirement System | 32 200 | 4,89 | 1 978 | -6,92 | ||||
| 2026-04-14 | 13F | RD Lewis Holdings, Inc. | 41 038 | -0,93 | 2 691 | -20,67 | ||||
| 2026-02-14 | 13F | Rockefeller Capital Management L.P. | 1 673 | 23,11 | 116 | 49,35 | ||||
| 2026-02-12 | 13F | Xponance, Inc. | 13 789 | -15,17 | 954 | 2,47 | ||||
| 2026-02-12 | 13F | BlackRock, Inc. | 14 790 925 | 2,06 | 1 023 828 | 23,33 | ||||
| 2026-02-12 | 13F | Hilton Capital Management, LLC | 49 965 | 10,94 | 3 459 | 34,08 | ||||
| 2026-04-30 | 13F | Torren Management, LLC | 45 | 0,00 | 3 | -33,33 | ||||
| 2026-02-13 | 13F | Ieq Capital, Llc | 12 089 | 837 | ||||||
| 2026-02-17 | 13F | Credit Agricole S A | 33 674 | 254,09 | 2 331 | 328,31 | ||||
| 2026-02-13 | 13F | OMERS ADMINISTRATION Corp | 0 | -100,00 | 0 | |||||
| 2026-02-09 | 13F | Annis Gardner Whiting Capital Advisors, LLC | 0 | -100,00 | 0 | |||||
| 2026-02-17 | 13F | Cresset Asset Management, LLC | 12 404 | 0,16 | 859 | 21,02 | ||||
| 2026-02-12 | 13F | Dimensional Fund Advisors Lp | 6 628 533 | 0,15 | 458 831 | 21,03 | ||||
| 2026-02-13 | 13F | Natixis | 0 | -100,00 | 0 | |||||
| 2026-02-12 | 13F | Advisors Asset Management, Inc. | 1 178 | 160,04 | 82 | 224,00 | ||||
| 2026-02-17 | 13F | Polymer Capital Management (US) LLC | 7 252 | 502 | ||||||
| 2026-02-05 | 13F | Paulson Wealth Management Inc. | 4 349 | 0,00 | 301 | 20,88 | ||||
| 2026-02-12 | 13F | DRW Securities, LLC | 27 904 | -53,49 | 1 932 | -43,82 | ||||
| 2026-04-30 | 13F | Nuveen, LLC | 936 858 | -16,97 | 57 551 | -26,31 | ||||
| 2026-02-17 | 13F | XTX Topco Ltd | 18 505 | 236,45 | 1 281 | 306,35 | ||||
| 2026-04-27 | 13F | V-Square Quantitative Management LLC | 777 | -1,15 | 48 | -12,96 | ||||
| 2026-02-13 | 13F | Prudential Financial Inc | 491 989 | 27,97 | 34 055 | 54,65 | ||||
| 2026-02-13 | 13F | Citigroup Inc | 140 583 | -0,38 | 9 731 | 20,39 | ||||
| 2026-02-17 | 13F | California State Teachers Retirement System | 105 043 | -1,17 | 7 271 | 19,43 | ||||
| 2026-04-30 | 13F | Sumitomo Mitsui Trust Holdings, Inc. | 4 300 | 264 | ||||||
| 2026-04-24 | 13F | Profund Advisors Llc | 4 010 | -9,21 | 246 | -19,34 | ||||
| 2026-04-24 | 13F | Retirement Systems of Alabama | 284 966 | 113,97 | 17 505 | 89,90 | ||||
| 2026-02-05 | 13F | Atria Investments Llc | 18 796 | 3,81 | 1 301 | 25,46 | ||||
| 2026-02-17 | 13F | Css Llc/il | 0 | -100,00 | 0 | |||||
| 2025-11-14 | 13F | Graham Capital Management, L.P. | 0 | -100,00 | 0 | |||||
| 2026-05-01 | 13F | Thrivent Financial For Lutherans | 39 272 | 0,00 | 2 | 0,00 | ||||
| 2026-01-29 | 13F | Dunhill Financial, LLC | 2 | 0 | ||||||
| 2026-02-12 | 13F | Voya Investment Management Llc | 70 389 | 4,36 | 4 872 | 26,12 | ||||
| 2026-04-28 | 13F | ORG Wealth Partners, LLC | 401 | 0,00 | 25 | -11,11 | ||||
| 2026-02-10 | 13F | Crescent Grove Advisors, LLC | 5 990 | 0,00 | 415 | 20,70 | ||||
| 2026-04-29 | 13F | Klp Kapitalforvaltning As | 37 700 | 1,34 | 2 316 | -10,06 | ||||
| 2026-02-13 | 13F | Edgestream Partners, L.P. | 6 277 | -84,81 | 434 | -81,66 | ||||
| 2026-02-13 | 13F | Morgan Stanley | 1 132 879 | -18,71 | 78 418 | -1,76 | ||||
| 2026-04-21 | 13F | Mesirow Financial Investment Management, Inc. | 3 289 | 202 | ||||||
| 2026-02-18 | 13F | Beacon Pointe Advisors, LLC | 17 164 | 0,04 | 1 188 | 20,98 | ||||
| 2025-11-14 | 13F | Aigen Investment Management, Lp | 0 | -100,00 | 0 | |||||
| 2026-04-23 | 13F | Oppenheimer & Co Inc | 19 330 | 1 187 | ||||||
| 2026-02-13 | 13F | Wbi Investments, Inc. | 5 791 | 401 | ||||||
| 2026-02-13 | 13F | Parkside Financial Bank & Trust | 1 831 | 151,51 | 127 | 207,32 | ||||
| 2026-04-22 | 13F | Stone House Investment Management, LLC | 100 | 0,00 | 6 | 0,00 | ||||
| 2026-02-09 | 13F | Geode Capital Management, Llc | 2 926 864 | 3,05 | 202 626 | 24,54 | ||||
| 2025-11-13 | 13F | Glenmede Investment Management, LP | 31 521 | 0,29 | 1 806 | 17,44 | ||||
| 2026-02-13 | 13F | Walleye Trading LLC | Call | 4 100 | -96,94 | 284 | -96,31 | |||
| 2026-02-13 | 13F | Walleye Trading LLC | 5 367 | 372 | ||||||
| 2026-02-17 | 13F | MIRAE ASSET GLOBAL ETFS HOLDINGS Ltd. | 825 963 | 2,22 | 57 174 | 23,53 | ||||
| 2026-02-13 | 13F | Walleye Trading LLC | Put | 15 800 | -86,97 | 1 094 | -84,27 | |||
| 2026-01-26 | 13F | AE Wealth Management LLC | 5 500 | 21,12 | 381 | 46,15 | ||||
| 2026-02-13 | 13F | Barclays Plc | 248 372 | -4,11 | 17 192 | 15,88 | ||||
| 2026-04-23 | 13F | Mayflower Financial Advisors, LLC | 8 434 | 119,75 | 518 | 95,47 | ||||
| 2026-02-17 | 13F | Signature Equity Partners, LLC | 27 | 2 | ||||||
| 2026-02-17 | 13F | Quantinno Capital Management LP | 24 143 | 49,18 | 1 671 | 80,26 | ||||
| 2026-02-04 | 13F | Paradigm Asset Management Co Llc | 12 900 | -5,84 | 893 | 13,78 | ||||
| 2026-02-13 | 13F | Battery Global Advisors, LLC | 957 | 29 | ||||||
| 2026-02-17 | 13F | Aquatic Capital Management LLC | 45 509 | 3 150 | ||||||
| 2026-02-13 | 13F | Ausdal Financial Partners, Inc. | 3 036 | -25,06 | 210 | -9,48 | ||||
| 2026-04-10 | 13F | Putney Financial Group LLC | 4 831 | 0,00 | 297 | -11,38 | ||||
| 2026-04-15 | 13F | Tema Etfs Llc | 0 | -100,00 | 0 | |||||
| 2026-02-11 | 13F | Zions Bancorporation, National Association /ut/ | 12 | 1 | ||||||
| 2026-02-10 | 13F | Bank of New York Mellon Corp | 968 113 | -12,77 | 67 013 | 5,42 | ||||
| 2026-02-13 | 13F | Bridgewater Associates, LP | 37 618 | 2 604 | ||||||
| 2026-02-12 | 13F | Quadrant Capital Group Llc | 6 906 | 4,23 | 478 | 26,12 | ||||
| 2026-04-30 | 13F | Cookson Peirce & Co Inc | 155 584 | 9 558 | ||||||
| 2026-01-29 | 13F | IMC-Chicago, LLC | Put | 12 600 | 872 | |||||
| 2026-01-29 | 13F | IMC-Chicago, LLC | Call | 15 000 | -48,45 | 1 038 | -37,70 | |||
| 2026-01-30 | 13F | State of New Jersey Common Pension Fund D | 48 040 | 0,00 | 3 325 | 20,87 | ||||
| 2026-02-11 | 13F | Buckingham Strategic Partners | 13 259 | 918 | ||||||
| 2026-02-11 | 13F | SOUTH STATE Corp | 12 | 0,00 | 1 | |||||
| 2026-02-17 | 13F | United Capital Financial Advisers, Llc | 3 996 | 277 | ||||||
| 2026-01-09 | 13F | Assenagon Asset Management S.A. | 0 | -100,00 | 0 | |||||
| 2026-04-21 | 13F | Red Tortoise LLC | 50 | 0,00 | 3 | 0,00 | ||||
| 2026-02-05 | 13F | Bessemer Group Inc | 3 283 | -98,74 | 0 | -100,00 | ||||
| 2026-04-07 | 13F | Green Alpha Advisors, LLC | 20 366 | -1,62 | 1 251 | -12,64 | ||||
| 2026-04-13 | 13F | Artemis Investment Management LLP | 801 473 | -46,64 | 49 234 | -52,64 | ||||
| 2026-04-29 | 13F | Police & Firemen's Retirement System of New Jersey | 30 320 | 1,71 | 1 863 | -9,74 | ||||
| 2026-02-12 | 13F | Rossby Financial, LCC | 39 | 3 | ||||||
| 2026-04-29 | 13F | WealthPlan Investment Management, LLC | 4 800 | 0,00 | 295 | -11,45 | ||||
| 2026-02-13 | 13F | Smartleaf Asset Management LLC | 64 | 10,34 | 4 | 33,33 | ||||
| 2026-02-13 | 13F | Kettle Hill Capital Management, Llc | 165 515 | 11 457 | ||||||
| 2026-02-13 | 13F | Virtus ETF Advisers LLC | 3 500 | 242 | ||||||
| 2026-02-11 | 13F | Allianz Asset Management GmbH | 206 302 | 3,28 | 14 280 | 24,81 | ||||
| 2026-02-17 | 13F | Nomura Holdings Inc | 0 | -100,00 | 0 | |||||
| 2026-02-13 | 13F | L2 Asset Management, LLC | 0 | -100,00 | 0 | |||||
| 2026-02-13 | 13F | Citigroup Inc | Call | 0 | -100,00 | 0 | -100,00 | |||
| 2026-04-24 | 13F | UMA Financial Services, Inc. | 28 | 0,00 | 2 | 0,00 | ||||
| 2026-02-13 | 13F | Glen Eagle Advisors, LLC | 18 | 0,00 | 1 | 0,00 | ||||
| 2026-04-13 | 13F | True Wealth Design, LLC | 601 | 23,16 | 37 | 9,09 | ||||
| 2026-02-12 | 13F | Swiss National Bank | 220 700 | 1,75 | 15 277 | 22,96 | ||||
| 2026-02-11 | 13F | Parallel Advisors, LLC | 2 266 | 30,30 | 157 | 57,58 | ||||
| 2026-02-12 | 13F | CIBC Private Wealth Group, LLC | 3 518 | 0,60 | 244 | 21,50 | ||||
| 2026-02-13 | 13F | Thomist Capital Management, LP | 0 | -100,00 | 0 | |||||
| 2026-02-12 | 13F | Commonwealth Equity Services, Llc | 6 506 | -1,24 | 450 | |||||
| 2026-04-07 | 13F | Signaturefd, Llc | 1 015 | 9,97 | 62 | -1,59 | ||||
| 2026-02-17 | 13F | Creative Planning | 122 351 | 67,29 | 8 469 | 102,17 | ||||
| 2026-01-29 | 13F | Teachers Retirement System Of The State Of Kentucky | 35 900 | -46,72 | 2 | -33,33 | ||||
| 2026-05-01 | 13F | Castleview Partners, Llc | 3 400 | 0,00 | 209 | -11,49 | ||||
| 2026-04-10 | 13F | Quaker Wealth Management, LLC | 1 | 0,00 | 0 | |||||
| 2026-02-17 | 13F | Delaware Management Holdings, Inc. | 14 300 | 990 | ||||||
| 2026-02-11 | 13F | Erste Asset Management GmbH | 0 | 0 | ||||||
| 2026-02-05 | 13F | 1620 Investment Advisors, Inc. | 198 | -9,17 | 14 | 8,33 | ||||
| 2026-02-10 | 13F | Connor, Clark & Lunn Investment Management Ltd. | 25 272 | 582,29 | 1 749 | 725,00 | ||||
| 2025-11-13 | 13F | Baird Financial Group, Inc. | 0 | -100,00 | 0 | |||||
| 2026-02-02 | 13F | Principal Financial Group Inc | 1 268 481 | -1,31 | 87 804 | 19,26 | ||||
| 2026-04-24 | 13F | Fulton Bank, N.a. | 8 279 | -1,22 | 509 | -12,41 | ||||
| 2026-04-01 | 13F | Helen Stephens Group, LLC | 15 426 | 948 | ||||||
| 2026-01-29 | 13F | Vanguard Group Inc | 11 240 140 | -1,36 | 778 042 | 19,20 | ||||
| 2026-04-20 | 13F | Peirce Capital Management, LLC | 10 966 | 0,00 | 674 | -11,33 | ||||
| 2026-02-17 | 13F | SageView Advisory Group, LLC | 297 | 21 | ||||||
| 2026-04-27 | 13F | First Dallas Securities Inc. | 22 460 | -3,94 | 1 380 | -14,77 | ||||
| 2025-11-14 | 13F | Twinbeech Capital Lp | 0 | -100,00 | 0 | |||||
| 2026-02-12 | 13F | Ci Investments Inc. | 0 | -100,00 | 0 | |||||
| 2026-05-01 | 13F | Commonwealth Of Pennsylvania Public School Empls Retrmt Sys | 27 788 | 0,07 | 1 707 | -11,19 | ||||
| 2026-02-11 | 13F | Clearbridge Investments, LLC | 121 621 | -21,31 | 8 419 | -4,90 | ||||
| 2026-02-12 | 13F | California Public Employees Retirement System | 249 184 | -1,51 | 17 249 | 19,02 | ||||
| 2026-02-09 | 13F | Jackson Creek Investment Advisors LLC | 32 520 | 340,47 | 2 | |||||
| 2026-05-01 | 13F | Hantz Financial Services, Inc. | 37 686 | -4,08 | 2 | 0,00 | ||||
| 2026-02-13 | 13F | Colony Group, LLC | 5 802 | 40,93 | 402 | 72,10 | ||||
| 2026-02-17 | 13F | Boothbay Fund Management, Llc | 0 | -100,00 | 0 | |||||
| 2026-04-15 | 13F | Merit Financial Group, LLC | 14 996 | 0,73 | 921 | -10,58 | ||||
| 2026-02-17 | 13F | Mercer Global Advisors Inc /adv | 13 803 | 7,69 | 955 | 30,11 | ||||
| 2026-04-28 | 13F | Handelsbanken Fonder AB | 27 000 | 0,00 | 2 | 0,00 | ||||
| 2026-04-06 | 13F | Versant Capital Management, Inc | 2 217 | 71,20 | 136 | 52,81 | ||||
| 2026-02-09 | 13F | Coldstream Capital Management Inc | 4 042 | -14,55 | 280 | 3,33 | ||||
| 2026-04-27 | 13F | Ethic Inc. | 12 864 | 10,23 | 790 | -2,11 | ||||
| 2026-04-28 | 13F | Hodges Capital Management Inc. | 257 746 | 10,30 | 15 833 | -2,11 | ||||
| 2026-04-22 | 13F | Pinnacle Bancorp, Inc. | 36 | -41,94 | 2 | -50,00 | ||||
| 2026-02-17 | 13F | Northern Trust Corp | 1 481 628 | -7,22 | 102 558 | 12,12 | ||||
| 2026-02-17 | 13F | Susquehanna International Group, Llp | Put | 40 800 | -43,10 | 2 824 | -31,22 | |||
| 2026-02-17 | 13F | Susquehanna International Group, Llp | Call | 66 000 | -30,23 | 4 569 | -15,69 | |||
| 2026-04-21 | 13F | Verity Asset Management, Inc. | 42 774 | 1,85 | 2 628 | -9,63 | ||||
| 2026-02-17 | 13F | Susquehanna International Group, Llp | 43 000 | 110,94 | 2 976 | 155,01 | ||||
| 2026-02-17 | 13F | Price T Rowe Associates Inc /md/ | 107 555 | 2,06 | 7 | 16,67 | ||||
| 2026-02-10 | 13F | Natixis Advisors, L.p. | 203 917 | 7,62 | 14 | 40,00 | ||||
| 2026-02-06 | 13F | Global Retirement Partners, LLC | 573 | 110,66 | 40 | 160,00 | ||||
| 2026-02-17 | 13F | Royal Bank Of Canada | 81 453 | -38,25 | 5 638 | -25,38 | ||||
| 2026-02-17 | 13F | Jones Financial Companies Lllp | 8 206 | 73,27 | 568 | 105,05 | ||||
| 2026-04-08 | 13F | Wealth Enhancement Trust Services, Inc. | 17 | 0,00 | 1 | 0,00 | ||||
| 2025-11-14 | 13F | Wolverine Trading, Llc | Call | 21 900 | 102,78 | 1 255 | 132,22 | |||
| 2026-02-17 | 13F | Schonfeld Strategic Advisors LLC | 0 | -100,00 | 0 | |||||
| 2026-02-09 | 13F | Royce & Associates Lp | 449 932 | -8,51 | 31 144 | 10,56 | ||||
| 2026-04-17 | 13F | Morris Financial Concepts, Inc. | 4 378 | -4,05 | 269 | -14,92 | ||||
| 2026-02-17 | 13F | NorthRock Partners, LLC | 8 154 | 6,41 | 564 | 28,77 | ||||
| 2026-04-16 | 13F | SG Americas Securities, LLC | 24 560 | 1 074,00 | 2 | |||||
| 2026-04-24 | 13F | ProShare Advisors LLC | 20 597 | -16,96 | 1 265 | -26,28 | ||||
| 2026-04-13 | 13F | Newman Dignan & Sheerar, Inc. | 12 990 | -2,05 | 798 | -13,09 | ||||
| 2026-04-27 | 13F | Y-Intercept (Hong Kong) Ltd | 124 996 | 7 679 | ||||||
| 2026-04-28 | 13F | SBI Securities Co., Ltd. | 27 | 0,00 | 2 | 0,00 | ||||
| 2026-02-17 | 13F | Cetera Investment Advisers | 16 389 | 13,88 | 1 134 | 37,62 | ||||
| 2026-02-17 | 13F | Caisse De Depot Et Placement Du Quebec | 278 538 | 274,48 | 19 280 | 352,58 | ||||
| 2026-02-19 | 13F | Invesco Ltd. | 1 404 969 | -15,42 | 97 252 | 2,22 | ||||
| 2026-02-12 | 13F/A | Pinebridge Investments Llc | 75 585 | 5 232 | ||||||
| 2026-02-13 | 13F | Charles Schwab Investment Management Inc | 1 592 131 | 2,11 | 110 207 | 23,40 | ||||
| 2026-02-05 | 13F | High Note Wealth, LLC | 100 | 7 | ||||||
| 2026-04-21 | 13F | Maridea Wealth Management LLC | 0 | -100,00 | 0 | |||||
| 2026-04-23 | 13F | CWM Advisors, LLC | 8 442 | 24,84 | 519 | 10,68 | ||||
| 2026-02-11 | 13F | Simplex Trading, Llc | Call | 2 700 | -81,63 | 187 | ||||
| 2026-04-17 | 13F | AdvisorNet Financial, Inc | 4 | 0 | ||||||
| 2026-02-11 | 13F | Simplex Trading, Llc | Put | 4 900 | -88,63 | 339 | 16 850,00 | |||
| 2026-02-11 | 13F | Simplex Trading, Llc | 118 | 8 | ||||||
| 2026-02-06 | 13F | Gsa Capital Partners Llp | 0 | -100,00 | 0 | |||||
| 2026-04-23 | 13F | MQS Management LLC | 7 263 | 143,40 | 446 | 116,50 | ||||
| 2026-04-22 | 13F | Advocate Investing Services LLC | 36 | 0,00 | 2 | 0,00 | ||||
| 2026-02-17 | 13F | Voloridge Investment Management, Llc | 257 794 | 17 845 | ||||||
| 2025-11-14 | 13F | PineBridge Investments, L.P. | 92 591 | 5 304 | ||||||
| 2026-02-13 | 13F | Volterra Technologies LP | Call | 12 800 | 886 | |||||
| 2026-04-07 | 13F | Retirement Wealth Solutions LLC | 33 | 0,00 | 2 | 0,00 | ||||
| 2026-02-12 | 13F | denkapparat Operations GmbH | 3 394 | 235 | ||||||
| 2026-02-09 | 13F | Penn Capital Management Co Inc | 0 | -100,00 | 0 | |||||
| 2026-02-13 | 13F | Van Eck Associates Corp | 308 747 | 38,17 | 21 | 75,00 | ||||
| 2026-02-06 | 13F | EverSource Wealth Advisors, LLC | 596 | -29,80 | 41 | -14,58 | ||||
| 2026-02-05 | 13F | Millennium Capital Advisors, LLC | 3 400 | -5,11 | 235 | 14,63 | ||||
| 2026-02-13 | 13F | Caitong International Asset Management Co., Ltd | 0 | -100,00 | 0 | |||||
| 2026-01-08 | 13F | Nordea Investment Management Ab | 299 824 | -7,76 | 20 793 | 14,15 | ||||
| 2026-05-01 | 13F | HFM Investment Advisors, LLC | 9 | -25,00 | 1 | |||||
| 2026-02-17 | 13F | Grantham, Mayo, Van Otterloo & Co. LLC | 48 314 | -3,23 | 3 344 | 16,96 | ||||
| 2026-02-13 | 13F | Umb Bank N A/mo | 1 403 | 0,00 | 97 | 21,25 | ||||
| 2026-01-28 | 13F | DekaBank Deutsche Girozentrale | 16 594 | 0,00 | 1 | |||||
| 2026-02-06 | 13F | Fortis Group Advisors, LLC | 134 | 0,00 | 9 | 28,57 | ||||
| 2026-04-30 | 13F | Teacher Retirement System Of Texas | 11 157 | 23,45 | 685 | 9,60 | ||||
| 2026-02-17 | 13F | Public Employees Retirement System Of Ohio | 48 128 | 89,88 | 3 331 | 129,57 | ||||
| 2026-02-17 | 13F | Palisade Capital Management Llc/nj | 404 826 | -10,63 | 28 022 | 8,00 | ||||
| 2026-04-27 | 13F | Td Private Client Wealth Llc | 5 307 | -19,40 | 326 | -28,35 | ||||
| 2026-02-13 | 13F | Panagora Asset Management Inc | 63 315 | -4,93 | 4 383 | 14,89 | ||||
| 2026-02-13 | 13F | First Trust Advisors Lp | 23 346 | -92,94 | 1 616 | -91,47 | ||||
| 2026-02-17 | 13F | Kemnay Advisory Services Inc. | 2 149 | 149 | ||||||
| 2026-02-13 | 13F | BNP Paribas Asset Management Holding S.A. | 516 088 | 25,55 | 36 | 52,17 | ||||
| 2026-02-11 | 13F | Barrow Hanley Mewhinney & Strauss Llc | 279 | 26,82 | 19 | 58,33 | ||||
| 2026-01-23 | 13F | Rsm Us Wealth Management Llc | 4 351 | 11,62 | 304 | 36,32 | ||||
| 2026-02-17 | 13F | Laird Norton Trust Company, Llc | 281 930 | 19 515 | ||||||
| 2026-04-29 | 13F | WPG Advisers, LLC | 40 | -58,33 | 2 | -66,67 | ||||
| 2026-04-29 | 13F | American Capital Advisory, LLC | 4 | 0 | ||||||
| 2026-02-09 | 13F | Hartland & Co., LLC | 7 195 | 18,71 | 498 | 43,52 | ||||
| 2026-02-12 | 13F | Federated Hermes, Inc. | 168 077 | 31,64 | 11 634 | 59,09 | ||||
| 2026-02-13 | 13F | Sei Investments Co | 104 617 | 29,48 | 7 242 | 56,49 | ||||
| 2026-02-13 | 13F | American Century Companies Inc | 1 958 356 | 7,37 | 135 557 | 29,75 | ||||
| 2026-02-17 | 13F | Voleon Capital Management Lp | 0 | -100,00 | 0 | |||||
| 2025-11-14 | 13F | Quarry LP | 0 | -100,00 | 0 | |||||
| 2026-02-13 | 13F | Victory Capital Management Inc | 2 204 848 | -17,75 | 152 620 | -0,61 | ||||
| 2026-04-16 | 13F | Capital Advisors, Ltd. LLC | 4 | 0,00 | 0 | |||||
| 2026-02-13 | 13F | Boston Partners | 3 586 419 | -1,52 | 248 676 | 19,20 | ||||
| 2026-02-10 | 13F | Nomura Asset Management Co Ltd | 1 500 | 0,00 | 104 | 21,18 | ||||
| 2026-02-11 | 13F | Cerity Partners LLC | 48 112 | 15,97 | 3 330 | 40,15 | ||||
| 2026-02-04 | 13F | Pacer Advisors, Inc. | 0 | -100,00 | 0 | -100,00 | ||||
| 2026-02-20 | 13F | Sunbelt Securities, Inc. | 405 | 0,00 | 28 | 21,74 | ||||
| 2026-04-24 | 13F | Key FInancial Inc | 484 | 0,00 | 30 | -12,12 | ||||
| 2026-02-12 | 13F | Brown Brothers Harriman & Co | 456 | 35,71 | 32 | 63,16 | ||||
| 2026-02-19 | 13F | CI Private Wealth, LLC | 23 554 | 0,66 | 1 630 | 21,64 | ||||
| 2026-04-24 | 13F | SummerHaven Investment Management, LLC | 14 297 | -10,99 | 878 | -20,97 | ||||
| 2026-02-10 | 13F | Quantbot Technologies LP | 10 594 | 110,20 | 733 | 154,51 | ||||
| 2026-02-13 | 13F | Fieldview Capital Management, LLC | 11 090 | 768 | ||||||
| 2026-02-13 | 13F | Bollard Group LLC | 329 | 0,30 | 0 | |||||
| 2026-04-15 | 13F | Wealthcare Capital Partners, LLC | 0 | -100,00 | 0 | |||||
| 2026-02-10 | 13F | Bnp Paribas Arbitrage, Sa | 73 505 | 23,00 | 5 088 | 48,64 | ||||
| 2026-04-27 | 13F | Burford Brothers, Inc. | 0 | -100,00 | 0 | |||||
| 2026-05-01 | 13F | Sachetta, LLC | 64 | 4 | ||||||
| 2026-02-17 | 13F | Ancora Advisors, LLC | 142 | 0,00 | 10 | 12,50 | ||||
| 2026-02-10 | 13F | Hillsdale Investment Management Inc. | 130 | 0,00 | 9 | 14,29 | ||||
| 2026-02-10 | 13F | Envestnet Asset Management Inc | 72 682 | -20,27 | 5 031 | -3,64 | ||||
| 2026-04-30 | 13F | Arista Wealth Management, LLC | 0 | -100,00 | 0 | |||||
| 2026-02-17 | 13F | Aristeia Capital Llc | 0 | -100,00 | 0 | |||||
| 2026-02-10 | 13F | Daiwa Securities Group Inc. | 6 980 | 4,95 | 0 | |||||
| 2026-02-17 | 13F | ExodusPoint Capital Management, LP | 0 | -100,00 | 0 | -100,00 | ||||
| 2026-02-17 | 13F | Capstone Investment Advisors, Llc | 0 | -100,00 | 0 | -100,00 | ||||
| 2026-02-12 | 13F | Hrt Financial Lp | 18 067 | 1 | ||||||
| 2026-02-13 | 13F | C M Bidwell & Associates Ltd | 181 | 0,00 | 13 | 20,00 | ||||
| 2026-02-17 | 13F | Two Sigma Advisers, Lp | 3 800 | 263 | ||||||
| 2026-04-22 | 13F | Spire Wealth Management | 300 | -33,77 | 18 | -41,94 | ||||
| 2026-02-12 | 13F | Campbell & CO Investment Adviser LLC | 79 416 | 399,94 | 5 497 | 504,73 | ||||
| 2026-02-10 | 13F | Axq Capital, Lp | 0 | -100,00 | 0 | |||||
| 2026-04-21 | 13F | Curat Global, LLC | 2 450 | -30,99 | 151 | -38,78 | ||||
| 2026-02-12 | 13F | Jane Street Group, Llc | Call | 41 300 | -50,12 | 2 859 | -39,73 | |||
| 2026-02-12 | 13F | Jane Street Group, Llc | 140 944 | -46,70 | 9 756 | -35,59 | ||||
| 2026-02-13 | 13F | Centaurus Financial, Inc. | 5 275 | 0,00 | 0 | |||||
| 2026-02-17 | 13F | LMR Partners LLP | 0 | -100,00 | 0 | |||||
| 2026-04-08 | 13F | Wealth Enhancement Advisory Services, Llc | 19 370 | 4,46 | 1 197 | -13,52 | ||||
| 2026-02-05 | 13F | Allworth Financial LP | 174 | 27,01 | 12 | 71,43 | ||||
| 2026-04-17 | 13F | Vermillion Wealth Management, Inc. | 6 | 0 | ||||||
| 2026-02-06 | 13F | Pnc Financial Services Group, Inc. | 30 032 | -6,83 | 2 079 | 12,57 | ||||
| 2026-02-12 | 13F | South Dakota Investment Council | 30 047 | -13,28 | 2 | 100,00 | ||||
| 2026-02-13 | 13F | Squarepoint Ops LLC | Put | 0 | -100,00 | 0 | -100,00 | |||
| 2026-04-13 | 13F | Moody Lynn & Lieberson, Llc | 14 433 | 0,00 | 887 | -11,31 | ||||
| 2026-02-03 | 13F | Crossmark Global Holdings, Inc. | 6 630 | 0,00 | 459 | 20,84 | ||||
| 2026-02-13 | 13F | Squarepoint Ops LLC | Call | 0 | -100,00 | 0 | -100,00 | |||
| 2025-11-12 | 13F | Park Square Financial Group, LLC | 0 | -100,00 | 0 | |||||
| 2025-11-13 | 13F | Farringdon Capital, Ltd. | 0 | -100,00 | 0 | |||||
| 2026-04-30 | 13F | Hsbc Holdings Plc | 125 076 | 222,04 | 7 609 | 183,28 | ||||
| 2026-04-28 | 13F | Stephens Inc /ar/ | 8 490 | 522 | ||||||
| 2026-02-17 | 13F | Glenmede Trust Co Na | 30 399 | -7,15 | 2 104 | 39,71 | ||||
| 2026-02-17 | 13F | Canada Pension Plan Investment Board | 7 600 | 526 | ||||||
| 2026-02-09 | 13F | Systematic Financial Management Lp | 548 320 | -2,74 | 37 955 | 17,54 | ||||
| 2026-02-11 | 13F | LPL Financial LLC | 68 966 | 24,56 | 4 774 | 50,52 | ||||
| 2026-02-14 | 13F | Adalta Capital Management LLC | 4 565 | 0,00 | 316 | 20,69 | ||||
| 2026-01-30 | 13F | Archer Investment Corp | 1 430 | 0,00 | 99 | 20,99 | ||||
| 2026-02-13 | 13F | Stifel Financial Corp | 4 727 | 327 | ||||||
| 2026-02-06 | 13F | Larson Financial Group LLC | 86 | 0,00 | 6 | 25,00 | ||||
| 2025-11-12 | 13F | Transce3nd, LLC | 0 | -100,00 | 0 | |||||
| 2026-04-23 | 13F | SJS Investment Consulting Inc. | 33 | 83,33 | 2 | 100,00 | ||||
| 2026-02-11 | 13F | Ameritas Investment Partners, Inc. | 29 537 | 2 045 | ||||||
| 2026-04-29 | 13F | Isthmus Partners, Llc | 5 606 | -22,93 | 344 | -31,61 | ||||
| 2026-02-12 | 13F | Colonial Trust Co / SC | 1 167 | 81 | ||||||
| 2026-04-28 | 13F | Hoey Investments, Inc | 40 380 | 0,73 | 2 481 | -10,60 | ||||
| 2026-02-13 | 13F | Public Employees Retirement Association Of Colorado | 12 054 | 0,00 | 1 | |||||
| 2026-04-06 | 13F | GAMMA Investing LLC | 2 844 | -7,72 | 175 | -18,31 | ||||
| 2026-04-23 | 13F | Private Wealth Management Group, LLC | 96 | 0,00 | 6 | -16,67 | ||||
| 2026-02-11 | 13F | Illinois Municipal Retirement Fund | 9 801 | -50,96 | 678 | -40,73 | ||||
| 2026-04-24 | 13F | Strs Ohio | 149 200 | 0,74 | 9 165 | -10,59 | ||||
| 2026-02-10 | 13F | Norges Bank | 1 415 531 | 97 983 | ||||||
| 2026-01-29 | 13F | State Of Michigan Retirement System | 26 237 | -1,50 | 1 816 | 19,08 | ||||
| 2026-02-12 | 13F | EntryPoint Capital, LLC | 3 333 | 231 | ||||||
| 2026-04-23 | 13F | North Star Investment Management Corp. | 7 800 | 0,00 | 479 | -11,13 | ||||
| 2026-02-23 | 13F | Virtu Financial LLC | 0 | -100,00 | 0 | |||||
| 2026-02-12 | 13F | Ensign Peak Advisors, Inc | 7 428 | -63,99 | 514 | -56,48 | ||||
| 2026-02-17 | 13F | Man Group plc | 85 012 | 153,99 | 5 885 | 206,94 | ||||
| 2026-02-17 | 13F | Russell Investments Group, Ltd. | 504 972 | 9,86 | 34 956 | 32,76 | ||||
| 2026-02-09 | 13F | Genus Capital Management Inc. | 65 464 | 4 531 | ||||||
| 2026-04-08 | 13F | Canandaigua National Corp | 3 709 | -33,94 | 228 | |||||
| 2026-02-09 | 13F | Delta Asset Management Llc/tn | 160 | -8,57 | 11 | 10,00 | ||||
| 2026-04-15 | 13F | Exchange Traded Concepts, Llc | 0 | -100,00 | 0 | |||||
| 2026-04-28 | 13F | BW Gestao de Investimentos Ltda. | 60 000 | 3 686 | ||||||
| 2026-02-18 | 13F | State of Tennessee, Treasury Department | 43 140 | -22,21 | 3 316 | 4,41 | ||||
| 2026-01-30 | 13F/A | M&t Bank Corp | 8 379 | 42,65 | 580 | 72,32 | ||||
| 2026-02-17 | 13F | Banco Bilbao Vizcaya Argentaria, S.a. | 0 | -100,00 | 0 | |||||
| 2026-02-17 | 13F | T. Rowe Price Investment Management, Inc. | 173 680 | -65,48 | 12 | -57,14 | ||||
| 2026-04-17 | 13F | Brown, Lisle/cummings, Inc. | 8 | 0 | ||||||
| 2026-04-30 | 13F | BRYN MAWR TRUST Co | 57 | -5,00 | 4 | -25,00 | ||||
| 2026-02-13 | 13F | SRS Capital Advisors, Inc. | 2 201 | -52,86 | 152 | -43,07 | ||||
| 2026-02-10 | 13F | Intech Investment Management Llc | 143 076 | 195,84 | 9 904 | 257,51 | ||||
| 2026-02-12 | 13F | Cloud Capital Management, LLC | 0 | -100,00 | 0 | |||||
| 2026-02-17 | 13F | Amundi | 9 378 | 649 | ||||||
| 2026-02-17 | 13F | Millennium Management Llc | 1 373 417 | 35,51 | 95 068 | 63,76 | ||||
| 2025-11-13 | 13F | Chesapeake Capital Corp /il/ | 0 | -100,00 | 0 | |||||
| 2026-04-13 | 13F | IFP Advisors, Inc | 23 083 | -0,05 | 1 418 | -11,33 | ||||
| 2026-01-23 | 13F | Optima Capital Llc | 9 | 1 | ||||||
| 2026-04-23 | 13F | Forum Financial Management, LP | 0 | -100,00 | 0 | |||||
| 2026-01-30 | 13F | CBOE Vest Financial, LLC | 0 | -100,00 | 0 | |||||
| 2026-02-17 | 13F | Prelude Capital Management, Llc | 0 | -100,00 | 0 | |||||
| 2026-01-26 | 13F | KBC Group NV | 3 470 | 0,00 | 0 | |||||
| 2026-04-28 | 13F | Abel Hall, LLC | 6 517 | -4,82 | 400 | -15,43 | ||||
| 2026-04-16 | 13F | Diversified Trust Co | 18 522 | 12,13 | 1 138 | -0,52 | ||||
| 2025-11-21 | 13F/A | CIBC Bancorp USA Inc. | 12 095 | 693 | ||||||
| 2026-02-13 | 13F | Jacobs Levy Equity Management, Inc | 1 502 015 | 25,28 | 103 969 | 51,39 | ||||
| 2026-02-10 | 13F | Rothschild Investment Llc | 624 | 21,17 | 43 | 48,28 | ||||
| 2025-11-07 | 13F | Shell Asset Management Co | 2 142 | -57,73 | 0 | |||||
| 2026-02-17 | 13F | Sherbrooke Park Advisers Llc | 4 092 | 283 | ||||||
| 2026-01-21 | 13F | Drummond Knight Asset Management Pty Ltd | 215 166 | -20,89 | 14 894 | -4,40 | ||||
| 2026-02-10 | 13F | Goldman Sachs Group Inc | 1 110 633 | 9,47 | 76 878 | 32,29 | ||||
| 2026-04-30 | 13F | Candriam Luxembourg S.C.A. | 33 332 | 2 048 | ||||||
| 2026-04-23 | 13F | Farmers & Merchants Investments Inc | 101 | 0,00 | 6 | 0,00 | ||||
| 2026-02-10 | 13F | Thompson Siegel & Walmsley Llc | 758 872 | -42,68 | 53 | -30,67 | ||||
| 2025-11-14 | 13F | Wolverine Trading, Llc | Put | 0 | -100,00 | 0 | -100,00 | |||
| 2026-02-05 | 13F | Elyxium Wealth, LLC | 172 | 12 | ||||||
| 2026-02-13 | 13F | Verition Fund Management LLC | 10 000 | -84,97 | 692 | -81,84 | ||||
| 2026-04-13 | 13F | Spring Capital Management, Llc | 5 000 | 0,00 | 307 | -11,27 | ||||
| 2026-01-30 | 13F | Us Bancorp \de\ | 1 097 | 5,08 | 76 | 27,12 | ||||
| 2026-05-01 | 13F | Securian Asset Management, Inc | 8 087 | 0,00 | 497 | -11,27 | ||||
| 2025-11-06 | 13F | Costello Asset Management, INC | 0 | -100,00 | 0 | |||||
| 2026-02-10 | 13F | State of Wyoming | 23 559 | 199,35 | 1 631 | 262,22 | ||||
| 2026-02-11 | 13F | Los Angeles Capital Management Llc | 846 | 51 | ||||||
| 2026-02-13 | 13F | Kilter Group LLC | 13 | 1 | ||||||
| 2026-02-04 | 13F | Community Bank, N.A. | 283 | 0,00 | 20 | 18,75 | ||||
| 2026-02-17 | 13F | Advisory Services Network, LLC | 0 | -100,00 | 0 | |||||
| 2026-04-15 | 13F | Covea Finance | 75 900 | -14,72 | 4 663 | -24,32 | ||||
| 2026-01-21 | 13F | Flagship Harbor Advisors, Llc | 0 | -100,00 | 0 | -100,00 | ||||
| 2026-02-17 | 13F | Gallagher Fiduciary Advisors, LLC | 17 220 | 7,40 | 1 192 | 29,74 | ||||
| 2026-02-03 | 13F | Mitsubishi UFJ Kokusai Asset Management Co., Ltd. | 371 | 0,00 | 27 | 23,81 | ||||
| 2026-02-12 | 13F | Counterpoint Mutual Funds LLC | 7 747 | 34,38 | 356 | 24,91 | ||||
| 2026-02-12 | 13F | New York State Common Retirement Fund | 174 695 | -31,39 | 12 092 | -17,09 | ||||
| 2026-04-13 | 13F | Cascade Investment Advisors, Inc. | 26 360 | 0,09 | 1 619 | -11,14 | ||||
| 2026-04-27 | 13F | Truist Financial Corp | 6 648 | 3,36 | 408 | -8,31 | ||||
| 2026-01-23 | 13F | Assetmark, Inc | 3 719 | -10,69 | 257 | 7,98 | ||||
| 2026-02-17 | 13F | Foresight Group Ltd Liability Partnership | 9 713 | 0,00 | 679 | 22,12 | ||||
| 2026-04-24 | 13F | Keybank National Association/oh | 7 980 | -2,64 | 490 | -13,58 | ||||
| 2026-02-03 | 13F | Ballentine Partners, LLC | 6 866 | -4,81 | 475 | 15,01 | ||||
| 2026-02-10 | 13F | CIBC Asset Management Inc | 3 646 | 0,00 | 252 | 21,15 | ||||
| 2026-02-11 | 13F | Group One Trading, L.p. | Put | 700 | -87,27 | 48 | -84,76 | |||
| 2026-02-11 | 13F | Group One Trading, L.p. | Call | 400 | -94,67 | 28 | -93,71 | |||
| 2026-02-17 | 13F | Hancock Whitney Corp | 65 197 | 1,87 | 4 513 | 23,11 | ||||
| 2026-02-11 | 13F | Group One Trading, L.p. | 656 | 45 | ||||||
| 2026-04-27 | 13F | Qrg Capital Management, Inc. | 7 149 | 16,53 | 439 | 3,54 | ||||
| 2026-02-13 | 13F | Great West Life Assurance Co /can/ | 70 428 | -0,20 | 5 | 0,00 | ||||
| 2026-01-28 | 13F | Universal- Beteiligungs- und Servicegesellschaft mbH | 87 228 | 33,69 | 6 051 | 61,92 | ||||
| 2026-05-01 | 13F | Fifth Third Bancorp | 55 784 | 3 893,13 | 3 427 | 3 468,75 | ||||
| 2026-02-12 | 13F | Steward Partners Investment Advisory, Llc | 6 178 | 0,02 | 428 | 20,96 | ||||
| 2025-11-14 | 13F | Trexquant Investment LP | 0 | -100,00 | 0 | |||||
| 2026-04-20 | 13F | State of Alaska, Department of Revenue | 16 054 | 0,75 | 1 | -100,00 | ||||
| 2026-02-11 | 13F | Twin Tree Management, LP | 0 | -100,00 | 0 | |||||
| 2026-04-16 | 13F | ARS Investment Partners, LLC | 32 969 | -2,42 | 2 025 | -13,39 | ||||
| 2026-02-12 | 13F | Brinker Capital Investments, LLC | 22 305 | -14,84 | 1 544 | 2,87 | ||||
| 2026-02-17 | 13F | Lazard Asset Management Llc | 23 199 | 0,58 | 1 606 | 21,50 | ||||
| 2026-02-11 | 13F | Twin Tree Management, LP | Put | 0 | -100,00 | 0 | ||||
| 2026-02-11 | 13F | Twin Tree Management, LP | Call | 0 | -100,00 | 0 | ||||
| 2026-04-23 | 13F | Atlas Private Wealth Advisors | 8 000 | 0,00 | 491 | -11,21 | ||||
| 2026-02-05 | 13F | Amalgamated Bank | 46 741 | -4,93 | 3 | 50,00 | ||||
| 2026-04-13 | 13F | Trust Co | 200 | 12 | ||||||
| 2026-04-21 | 13F | Vise Technologies, Inc. | 5 985 | 0,00 | 414 | 0,00 | ||||
| 2026-04-15 | 13F | Bayforest Capital Ltd | 986 | 9,56 | 61 | -3,23 | ||||
| 2026-02-12 | 13F | Fuller & Thaler Asset Management, Inc. | 3 817 829 | -8,42 | 264 270 | 10,67 | ||||
| 2026-01-27 | 13F | Meritage Portfolio Management | 4 975 | -18,09 | 344 | -0,86 | ||||
| 2026-04-13 | 13F | Wedge Capital Management L L P/nc | 157 519 | 305,17 | 9 676 | 259,57 | ||||
| 2026-02-17 | 13F | Engineers Gate Manager LP | 42 133 | -37,34 | 2 916 | -24,28 | ||||
| 2025-11-14 | 13F | Wetherby Asset Management Inc | 280 817 | -0,06 | 16 085 | 17,04 | ||||
| 2026-02-17 | 13F | Mubadala Investment Co PJSC | 45 869 | 3 175 | ||||||
| 2026-04-17 | 13F | Sovereign Financial Group, Inc. | 11 513 | 0,00 | 707 | -11,18 | ||||
| 2026-04-22 | 13F | Janney Montgomery Scott LLC | 25 949 | 12,63 | 2 | 0,00 | ||||
| 2026-04-29 | 13F | CVA Family Office, LLC | 124 | 8 | ||||||
| 2026-02-13 | 13F | Marshall Wace, Llp | 0 | -100,00 | 0 | -100,00 | ||||
| 2025-11-14 | 13F | Texas Permanent School Fund | 0 | -100,00 | 0 | -100,00 | ||||
| 2026-04-30 | 13F | Kestra Advisory Services, LLC | 7 505 | 25,31 | 461 | 11,35 | ||||
| 2026-02-13 | 13F | State Street Corp | 6 361 477 | 1,45 | 440 341 | 22,60 | ||||
| 2026-02-10 | 13F | Bruce G. Allen Investments, LLC | 12 | 1 | ||||||
| 2026-02-10 | 13F | Mutual Of America Capital Management Llc | 112 475 | 117,58 | 7 786 | 163,01 | ||||
| 2026-02-11 | 13F | Vestcor Inc | 8 735 | 1 | ||||||
| 2026-04-14 | 13F | USA Financial Portformulas Corp | 496 | 67,57 | 30 | 50,00 | ||||
| 2026-02-11 | 13F | Meeder Asset Management Inc | 4 089 | 283 | ||||||
| 2026-01-26 | 13F | Cwm, Llc | 7 075 | 10,69 | 0 | |||||
| 2026-02-12 | 13F | Sit Investment Associates Inc | 0 | -100,00 | 0 | |||||
| 2026-02-17 | 13F | Weiss Asset Management LP | 38 940 | 451,32 | 2 695 | 567,08 | ||||
| 2026-03-30 | 13F/A | Barclays Plc | Put | 0 | -100,00 | 0 | -100,00 | |||
| 2026-04-29 | 13F | Skopos Labs, Inc. | 10 138 | 48,26 | 623 | 29,05 | ||||
| 2026-02-04 | 13F | Swiss Life Asset Management Ltd | 5 293 | 0,00 | 366 | 20,79 | ||||
| 2026-02-17 | 13F | Dark Forest Capital Management Lp | 0 | -100,00 | 0 | |||||
| 2026-02-17 | 13F | Aqr Capital Management Llc | 885 516 | 21,85 | 61 295 | 47,26 | ||||
| 2026-04-30 | 13F | Csenge Advisory Group | 6 382 | -31,71 | 392 | -39,32 | ||||
| 2026-04-30 | 13F | Verdence Capital Advisors LLC | 0 | -100,00 | 0 | |||||
| 2026-04-20 | 13F | Delphi Management Inc /ma/ | 4 500 | 0 | ||||||
| 2026-02-13 | 13F | Squarepoint Ops LLC | 141 009 | 9 761 | ||||||
| 2026-02-13 | 13F | Capula Management Ltd | 5 772 | 400 | ||||||
| 2026-02-17 | 13F | Magnetar Financial LLC | 0 | -100,00 | 0 | |||||
| 2026-04-16 | 13F | Vaughan Nelson Investment Management, L.p. | 658 710 | -32,60 | 40 465 | -40,19 | ||||
| 2026-02-13 | 13F | Huber Capital Management LLC | 9 600 | 0,00 | 665 | 20,95 | ||||
| 2026-02-17 | 13F | Expect Equity LLC | 39 510 | 13,27 | 2 735 | 36,91 | ||||
| 2026-02-12 | 13F | State Board Of Administration Of Florida Retirement System | 44 477 | 7,41 | 3 079 | 29,82 | ||||
| 2026-02-13 | 13F | JustInvest LLC | 14 893 | 6,56 | 1 031 | 28,75 | ||||
| 2026-02-17 | 13F | Concentric Capital Strategies, LP | 0 | -100,00 | 0 | |||||
| 2026-04-20 | 13F | Jfs Wealth Advisors, Llc | 209 | 0,48 | 13 | -14,29 | ||||
| 2026-02-12 | 13F | First Wilshire Securities Management Inc | 0 | -100,00 | 0 | |||||
| 2026-04-13 | 13F | Fiduciary Financial Group, Llc | 4 295 | 264 | ||||||
| 2026-04-30 | 13F | LRI Investments, LLC | 171 | 11 | ||||||
| 2026-04-27 | 13F | Leonteq Securities AG | 0 | -100,00 | 0 |