Podstawowe statystyki
| Akcje instytucjonalne (długie) | 163 093 310 - 102,16% (ex 13D/G) - change of -7,55MM shares -4,26% MRQ |
| Wartość instytucjonalna (długa) | $ 4 295 904 USD ($1000) |
Własność instytucjonalna i akcjonariusze
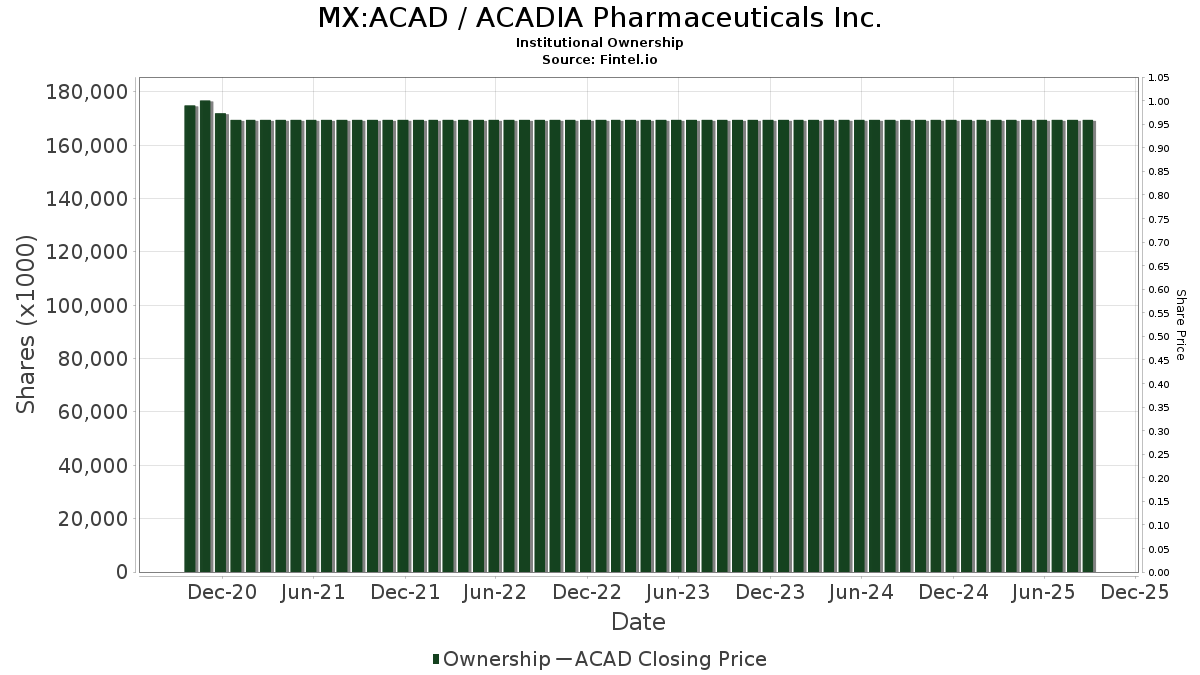
ACADIA Pharmaceuticals Inc. (MX:ACAD) posiada 348 właściciele instytucjonalni i akcjonariusze, którzy złożyli formularze 13D/G lub 13F w Komisji Papierów Wartościowych (SEC). Instytucje te posiadają łącznie 163,093,310 akcji. Do największych akcjonariuszy należą Baker Bros. Advisors Lp, BlackRock, Inc., Vanguard Group Inc, State Street Corp, Rtw Investments, Lp, Point72 Asset Management, L.P., Geode Capital Management, Llc, Dimensional Fund Advisors Lp, First Trust Advisors Lp, and Braidwell Lp .
ACADIA Pharmaceuticals Inc. (BMV:ACAD) instytucjonalna struktura własności pokazuje aktualne pozycje w firmie według instytucji i funduszy, a także najnowsze zmiany w wielkości stanowisk. Głównymi akcjonariuszami mogą być inwestorzy indywidualni, fundusze inwestycyjne, fundusze hedgingowe lub instytucje. Załącznik 13D wskazuje, że inwestor posiada (lub posiadał) więcej niż 5% udziałów w spółce i zamierza (lub zamierzał) aktywnie dążyć do zmiany strategii biznesowej. Załącznik 13G wskazuje na inwestycję pasywną na poziomie ponad 5%.
Ocena sentymentu funduszu
Wskaźnik sentymentu funduszu (fka Ownership Accumulation Score) pozwala określić akcje, które są najczęściej kupowane przez fundusze. Jest to wynik zaawansowanego, wieloczynnikowego modelu ilościowego, który identyfikuje spółki o najwyższym poziomie akumulacji instytucjonalnej. Model oceny wykorzystuje kombinację całkowitego wzrostu liczby ujawnionych właścicieli, zmian w alokacji portfela wśród tych właścicieli i innych wskaźników. Liczba waha się od 0 do 100, przy czym wyższe liczby wskazują na wyższy poziom akumulacji w stosunku do innych spółek, a 50 oznacza średnią.
Częstotliwość aktualizacji: codziennie
Sprawdź Ownership Explorer, który zawiera listę firm o najwyższym rankingu.
AI+ Ask Fintel’s AI assistant about ACADIA Pharmaceuticals Inc..
Select a question to share a public post with an AI-crafted answer.
Thinking of good questions…
Zgłoszenia 13F i NPORT
Szczegółowe dane dotyczące zgłoszeń 13F są bezpłatne. Szczegółowe dane dotyczące zgłoszeń NP wymagają członkostwa premium. Zielone rzędy wskazują nowe pozycje. Czerwone rzędy wskazują pozycje zamknięte. Kliknij w ikonę linku, aby zobaczyć pełną historię transakcji.
Aktualizacja
aby odblokować dane premium i eksportować do Excela ![]() .
.
| Data pliku | Źródło | Inwestor | Typ | Średnia cena (Est) |
Akcje | Akcje; Δ (%) |
Zgłoszono Wartość ($1000) |
Wartość; Δ (%) |
Przydział portu (%) |
|
|---|---|---|---|---|---|---|---|---|---|---|
| 2026-02-13 | 13F | Colony Group, LLC | 10 654 | -46,39 | 285 | -86,54 | ||||
| 2026-02-04 | 13F | Tsfg, Llc | 75 | 0,00 | 0 | |||||
| 2026-02-17 | 13F | Nomura Holdings Inc | 0 | -100,00 | 0 | |||||
| 2026-02-17 | 13F | Ishara Investments LP | 160 000 | 4 274 | ||||||
| 2026-02-13 | 13F | Schroder Investment Management Group | 0 | -100,00 | 0 | |||||
| 2026-02-05 | 13F | HFM Investment Advisors, LLC | 7 | -22,22 | 0 | |||||
| 2025-09-29 | NP | LABU - Direxion Daily S&P Biotech Bull 3X Shares Direxion Daily S&P Biotech Bull 3X Shares | 140 920 | -22,24 | 3 358 | 26,96 | ||||
| 2026-02-06 | 13F | Pnc Financial Services Group, Inc. | 5 239 | -1,58 | 140 | 23,01 | ||||
| 2025-11-13 | 13F | Glenmede Investment Management, LP | 0 | -100,00 | 0 | |||||
| 2025-11-14 | 13F | Point72 (DIFC) Ltd | 0 | -100,00 | 0 | -100,00 | ||||
| 2026-02-12 | 13F | Advisors Asset Management, Inc. | 8 769 | -35,71 | 234 | -19,59 | ||||
| 2025-11-14 | 13F | Point72 Hong Kong Ltd | 33 715 | -37,50 | 719 | -38,18 | ||||
| 2025-10-24 | 13F | Tema Etfs Llc | 0 | -100,00 | 0 | |||||
| 2026-02-10 | 13F/A | Northwestern Mutual Wealth Management Co | 86 | -8,51 | 2 | 0,00 | ||||
| 2026-02-10 | 13F | Nomura Asset Management Co Ltd | 0 | 0 | ||||||
| 2026-01-28 | 13F | Arizona State Retirement System | 33 047 | -4,63 | 883 | 19,35 | ||||
| 2026-02-17 | 13F | Signature Equity Partners, LLC | 1 952 | 52 | ||||||
| 2026-02-13 | 13F | Neo Ivy Capital Management | 6 008 | -90,40 | 160 | -88,01 | ||||
| 2026-02-12 | 13F | Cibc World Markets Corp | 8 234 | -46,31 | 220 | -33,64 | ||||
| 2026-01-29 | 13F | Nbc Securities, Inc. | 735 | -6,37 | 20 | 18,75 | ||||
| 2026-01-22 | 13F | Personal Cfo Solutions, Llc | 11 306 | -0,07 | 302 | 24,90 | ||||
| 2026-02-02 | 13F | Principal Financial Group Inc | 745 356 | 7,00 | 19 908 | 33,93 | ||||
| 2026-02-13 | 13F | Umb Bank N A/mo | 605 | 28,72 | 16 | 60,00 | ||||
| 2026-02-17 | 13F | Fred Alger Management, Llc | 1 559 962 | -0,45 | 41 667 | 24,60 | ||||
| 2026-01-16 | 13F | Louisiana State Employees Retirement System | 57 300 | -0,17 | 1 530 | 25,00 | ||||
| 2026-02-13 | 13F | Rhumbline Advisers | 361 086 | -7,78 | 9 645 | 15,43 | ||||
| 2026-02-17 | 13F | Wellington Management Group Llp | 53 289 | -3,71 | 1 423 | 20,59 | ||||
| 2026-01-21 | 13F | Yousif Capital Management, Llc | 34 359 | -12,60 | 903 | 7,76 | ||||
| 2026-02-17 | 13F | Cim Investment Mangement Inc | 14 239 | 0,00 | 380 | 25,41 | ||||
| 2026-02-12 | 13F | Ankerstar Wealth, LLC | 16 | 0 | ||||||
| 2026-02-12 | 13F | New York State Common Retirement Fund | 52 070 | -6,81 | 1 391 | 16,61 | ||||
| 2026-02-13 | 13F | Edgestream Partners, L.P. | 316 239 | 35,23 | 8 447 | 69,26 | ||||
| 2026-01-28 | 13F | Geneos Wealth Management Inc. | 0 | -100,00 | 0 | -100,00 | ||||
| 2026-01-16 | 13F | Empirical Financial Services, LLC d.b.a. Empirical Wealth Management | 9 897 | 264 | ||||||
| 2025-11-14 | 13F | Mount Yale Investment Advisors, LLC | 0 | -100,00 | 0 | |||||
| 2026-02-17 | 13F | Nomura Holdings Inc | Call | 18 100 | -56,17 | 483 | -45,18 | |||
| 2026-02-17 | 13F | Nomura Holdings Inc | Put | 18 100 | 483 | |||||
| 2026-02-17 | 13F | Woodline Partners LP | 0 | -100,00 | 0 | |||||
| 2026-02-13 | 13F | Walleye Capital LLC | Call | 5 100 | 136 | |||||
| 2026-02-13 | 13F | First Trust Advisors Lp | 2 270 034 | 16,82 | 60 633 | 46,22 | ||||
| 2026-02-13 | 13F | Walleye Capital LLC | Put | 27 200 | 13,33 | 727 | 41,80 | |||
| 2026-02-13 | 13F | Walleye Capital LLC | 8 476 | 226 | ||||||
| 2026-02-12 | 13F | Principal Securities, Inc. | 0 | -100,00 | 0 | -100,00 | ||||
| 2026-02-13 | 13F | Y-Intercept (Hong Kong) Ltd | 0 | -100,00 | 0 | |||||
| 2026-02-12 | 13F | Steward Partners Investment Advisory, Llc | 1 427 | 0,00 | 38 | 26,67 | ||||
| 2026-02-13 | 13F | OMERS ADMINISTRATION Corp | 0 | -100,00 | 0 | |||||
| 2026-02-17 | 13F | Graham Capital Management, L.P. | 0 | -100,00 | 0 | |||||
| 2026-01-20 | 13F | Signaturefd, Llc | 92 | 0,00 | 2 | 100,00 | ||||
| 2026-01-30 | 13F | Us Bancorp \de\ | 229 | 0,00 | 6 | 50,00 | ||||
| 2026-02-13 | 13F | Manufacturers Life Insurance Company, The | 0 | -100,00 | 0 | |||||
| 2025-11-14 | 13F | DRW Securities, LLC | 0 | -100,00 | 0 | |||||
| 2026-02-17 | 13F | Fmr Llc | 726 963 | 9,18 | 19 417 | 36,66 | ||||
| 2026-02-12 | 13F | Voya Investment Management Llc | 641 511 | -6,41 | 17 135 | 17,14 | ||||
| 2026-02-12 | 13F | Hollencrest Capital Management | 3 000 | -53,85 | 80 | -42,03 | ||||
| 2026-01-26 | 13F | Cwm, Llc | 33 787 | -9,23 | 1 | |||||
| 2026-01-23 | 13F | Farther Finance Advisors, LLC | 958 | 67,48 | 26 | 108,33 | ||||
| 2026-02-11 | 13F | Cerity Partners LLC | 27 729 | -19,77 | 741 | 0,41 | ||||
| 2026-02-13 | 13F | Birchview Capital, LP | 171 000 | 0,00 | 4 567 | 25,16 | ||||
| 2026-02-13 | 13F | Exome Asset Management LLC | Put | 0 | -100,00 | 0 | ||||
| 2026-02-12 | 13F | Jane Street Group, Llc | 0 | -100,00 | 0 | -100,00 | ||||
| 2026-02-17 | 13F | ISAM Funds (UK) Ltd | 0 | -100,00 | 0 | |||||
| 2026-02-12 | 13F | Federated Hermes, Inc. | 1 612 | 277,52 | 43 | 377,78 | ||||
| 2026-01-16 | 13F | Marquette Asset Management, LLC | 22 | 1 | ||||||
| 2026-02-13 | 13F | Virtus ETF Advisers LLC | 42 974 | 0,00 | 1 148 | 25,08 | ||||
| 2026-02-17 | 13F | GeoWealth Management, LLC | 0 | -100,00 | 0 | |||||
| 2026-01-29 | 13F | IMC-Chicago, LLC | Call | 10 200 | 272 | |||||
| 2026-01-28 | 13F | Salomon & Ludwin, LLC | 917 | 77,71 | 24 | 109,09 | ||||
| 2026-01-29 | 13F | Teachers Retirement System Of The State Of Kentucky | 31 170 | -11,09 | 1 | |||||
| 2026-02-09 | 13F | Hartland & Co., LLC | 1 017 | -20,17 | 27 | 0,00 | ||||
| 2026-02-05 | 13F | DnB Asset Management AS | 14 702 | 11,57 | 393 | 39,50 | ||||
| 2026-02-03 | 13F | Mitsubishi UFJ Kokusai Asset Management Co., Ltd. | 491 | 0,00 | 13 | 20,00 | ||||
| 2026-02-17 | 13F | Russell Investments Group, Ltd. | 138 296 | 75,10 | 3 694 | 119,17 | ||||
| 2026-02-17 | 13F | Polygon Management Ltd. | 0 | -100,00 | 0 | |||||
| 2026-02-11 | 13F | Simplex Trading, Llc | 2 435 | 65 | ||||||
| 2026-02-11 | 13F | Simplex Trading, Llc | Call | 3 900 | -82,03 | 104 | ||||
| 2026-02-13 | 13F | Sterling Capital Management LLC | 890 | 130,57 | 24 | 187,50 | ||||
| 2026-02-11 | 13F | Simplex Trading, Llc | Put | 10 400 | -66,98 | 278 | ||||
| 2026-02-11 | 13F | Fox Run Management, L.l.c. | 10 552 | 282 | ||||||
| 2026-02-17 | 13F | Aqr Capital Management Llc | 604 748 | -2,59 | 16 153 | 21,92 | ||||
| 2026-02-13 | 13F | Entropy Technologies, LP | 12 796 | 342 | ||||||
| 2026-02-17 | 13F | Trails Edge Capital Partners, LP | 1 419 406 | 37 912 | ||||||
| 2026-02-17 | 13F | Clear Street Markets Llc | Put | 0 | -100,00 | 0 | ||||
| 2026-02-17 | 13F | Palo Alto Investors LP | 0 | -100,00 | 0 | |||||
| 2026-02-05 | 13F | Atria Investments Llc | 22 002 | 24,90 | 588 | 56,53 | ||||
| 2026-02-12 | 13F | Xponance, Inc. | 10 993 | 0,54 | 294 | 25,75 | ||||
| 2026-02-10 | 13F | Commonwealth Of Pennsylvania Public School Empls Retrmt Sys | 30 994 | -2,52 | 828 | 21,98 | ||||
| 2026-02-13 | 13F | Avidity Partners Management LP | 0 | -100,00 | 0 | |||||
| 2026-02-10 | 13F | Godfrey Financial Associates, Inc. | 59 | 2 | ||||||
| 2026-02-17 | 13F | Two Sigma Advisers, Lp | 370 200 | 276,22 | 9 888 | 371,08 | ||||
| 2026-01-28 | 13F | Klp Kapitalforvaltning As | 44 500 | 0,00 | 1 189 | 25,18 | ||||
| 2026-02-17 | 13F | Adage Capital Partners Gp, L.l.c. | 9 156 | -99,63 | 245 | -99,54 | ||||
| 2026-02-06 | 13F | Global Retirement Partners, LLC | 5 051 | 135 | ||||||
| 2026-01-14 | 13F | Pallas Capital Advisors LLC | 13 192 | 4,04 | 352 | 30,37 | ||||
| 2026-01-21 | 13F | Flagship Harbor Advisors, Llc | 124 | 3 | ||||||
| 2026-02-13 | 13F | Ieq Capital, Llc | 82 344 | 12,06 | 2 199 | 40,24 | ||||
| 2026-02-17 | 13F | State Of Wisconsin Investment Board | 150 386 | -20,51 | 4 017 | -0,52 | ||||
| 2026-02-17 | 13F | Man Group plc | 348 160 | -7,69 | 9 299 | 15,54 | ||||
| 2026-01-12 | 13F | CVA Family Office, LLC | 0 | -100,00 | 0 | |||||
| 2026-02-12 | 13F | Bank Of Montreal /can/ | 27 421 | 16,55 | 732 | 45,82 | ||||
| 2025-11-14 | 13F | Point72 Europe (London) LLP | 108 015 | -19,96 | 2 305 | -20,79 | ||||
| 2026-01-23 | 13F | Private Wealth Management Group, LLC | 218 | 0,00 | 6 | 25,00 | ||||
| 2026-02-18 | 13F | Caitlin John, LLC | 40 | -46,67 | 1 | 0,00 | ||||
| 2026-02-11 | 13F | Gilpin Wealth Management, Llc | 9 | 0 | ||||||
| 2026-02-09 | 13F | Legal & General Group Plc | 314 351 | -6,10 | 8 396 | 17,54 | ||||
| 2026-02-13 | 13F | Sei Investments Co | 154 130 | 57,23 | 4 117 | 96,84 | ||||
| 2026-02-13 | 13F | Nan Fung Group Holdings Ltd | 102 984 | 0,00 | 2 751 | 25,17 | ||||
| 2026-02-13 | 13F | SRS Capital Advisors, Inc. | 227 | -98,84 | 6 | -98,56 | ||||
| 2025-10-16 | 13F | Kingstone Capital Partners Texas, LLC | 0 | -100,00 | 0 | |||||
| 2026-02-02 | 13F | Bay Harbor Wealth Management, LLC | 7 | 75,00 | 0 | |||||
| 2026-02-10 | 13F | State of Wyoming | 17 812 | 114,99 | 476 | 169,89 | ||||
| 2026-02-11 | 13F | Deutsche Bank Ag\ | 828 594 | -45,57 | 22 132 | -31,87 | ||||
| 2026-02-11 | 13F | Group One Trading, L.p. | Call | 200 | -99,82 | 5 | -99,79 | |||
| 2026-02-03 | 13F | F/M Investments LLC | 224 005 | 342,86 | 5 983 | 454,49 | ||||
| 2026-02-11 | 13F | Group One Trading, L.p. | Put | 5 000 | -92,72 | 134 | -90,93 | |||
| 2026-02-11 | 13F | Group One Trading, L.p. | 9 313 | 249 | ||||||
| 2026-02-05 | 13F | Amalgamated Bank | 36 262 | -0,13 | 1 | |||||
| 2026-02-17 | 13F | J. Goldman & Co LP | Call | 0 | -100,00 | 0 | ||||
| 2026-02-17 | 13F | Canada Pension Plan Investment Board | 68 100 | 300,59 | 1 819 | 402,21 | ||||
| 2026-02-13 | 13F | Garrison Point Advisors, Llc | 9 501 | -10,16 | 254 | 12,44 | ||||
| 2026-02-06 | 13F | Covestor Ltd | 10 695 | 2,70 | 0 | |||||
| 2026-02-17 | 13F | Magnetar Financial LLC | 0 | -100,00 | 0 | -100,00 | ||||
| 2026-02-17 | 13F | Lazard Asset Management Llc | 226 222 | 30,90 | 6 042 | 63,83 | ||||
| 2026-02-04 | 13F | Swiss Life Asset Management Ltd | 12 325 | 329 | ||||||
| 2026-02-12 | 13F | Jane Street Group, Llc | Put | 16 300 | -69,93 | 435 | -62,37 | |||
| 2026-02-12 | 13F | Jane Street Group, Llc | Call | 17 300 | -31,08 | 462 | -13,64 | |||
| 2026-02-17 | 13F | Brevan Howard Capital Management LP | 34 191 | -2,29 | 913 | 22,39 | ||||
| 2026-02-17 | 13F | Delaware Management Holdings, Inc. | 92 648 | 2 475 | ||||||
| 2026-02-13 | 13F | Quarry LP | 16 000 | 40,65 | 427 | 76,45 | ||||
| 2026-02-11 | 13F | Vise Technologies, Inc. | 0 | -100,00 | 0 | |||||
| 2026-02-13 | 13F | Police & Firemen's Retirement System of New Jersey | 34 407 | 0,16 | 919 | 25,38 | ||||
| 2026-02-13 | 13F | Walleye Trading LLC | Call | 300 | 8 | |||||
| 2026-02-13 | 13F | Walleye Trading LLC | 6 846 | 183 | ||||||
| 2026-01-29 | 13F | Comerica Bank | 31 838 | -13,12 | 850 | 8,70 | ||||
| 2026-02-13 | 13F | Walleye Trading LLC | Put | 22 100 | 8,87 | 590 | 36,26 | |||
| 2026-02-13 | 13F | Sofinnova Investments, Inc. | 65 567 | 144,65 | 1 751 | 206,65 | ||||
| 2026-01-28 | 13F | Universal- Beteiligungs- und Servicegesellschaft mbH | 62 988 | 33,75 | 1 682 | 67,53 | ||||
| 2026-02-13 | 13F | Great West Life Assurance Co /can/ | 106 969 | -13,21 | 3 | 0,00 | ||||
| 2026-01-08 | 13F | Nordea Investment Management Ab | 237 645 | -15,22 | 6 347 | 7,43 | ||||
| 2026-01-23 | 13F | State of Alaska, Department of Revenue | 99 746 | 36,35 | 3 | 100,00 | ||||
| 2025-11-14 | 13F | Boothbay Fund Management, Llc | 0 | -100,00 | 0 | -100,00 | ||||
| 2026-01-26 | 13F | JGP Global Gestao de Recursos Ltda. | 13 843 | -40,03 | 370 | -25,00 | ||||
| 2026-02-17 | 13F | Logos Global Management LP | 850 000 | 22 704 | ||||||
| 2025-11-14 | 13F | Schonfeld Strategic Advisors LLC | 0 | -100,00 | 0 | |||||
| 2026-02-06 | 13F | PSP Research LLC | 19 766 | 528 | ||||||
| 2026-02-17 | 13F | Price T Rowe Associates Inc /md/ | 615 169 | -44,12 | 16 | -30,43 | ||||
| 2026-02-17 | 13F | Rtw Investments, Lp | 7 144 524 | 0,00 | 190 830 | 25,16 | ||||
| 2026-02-17 | 13F | Susquehanna International Group, Llp | Put | 46 600 | -87,06 | 1 245 | -83,81 | |||
| 2026-02-17 | 13F | Susquehanna International Group, Llp | Call | 98 500 | -71,67 | 2 631 | -64,55 | |||
| 2026-03-06 | 13F | Hsbc Holdings Plc | 26 286 | -14,63 | 703 | 7,83 | ||||
| 2026-01-22 | 13F | Advantage Alpha Capital Partners LP | 0 | -100,00 | 0 | -100,00 | ||||
| 2026-02-17 | 13F | Susquehanna International Group, Llp | 20 652 | -65,81 | 552 | -57,25 | ||||
| 2026-02-13 | 13F | Segall Bryant & Hamill, Llc | 126 066 | 3 367 | ||||||
| 2026-02-17 | 13F | Engineers Gate Manager LP | 73 840 | 24,06 | 1 972 | 55,28 | ||||
| 2026-02-13 | 13F | JustInvest LLC | 7 812 | 209 | ||||||
| 2026-02-12 | 13F | State Board Of Administration Of Florida Retirement System | 128 689 | 0,00 | 3 437 | 25,16 | ||||
| 2026-02-12 | 13F | Colonial Trust Co / SC | 131 | 0,00 | 3 | 0,00 | ||||
| 2025-11-12 | 13F | HAP Trading, LLC | Call | 50 000 | 10 | |||||
| 2026-01-23 | 13F | Rsm Us Wealth Management Llc | 23 186 | 619 | ||||||
| 2026-02-13 | 13F | Panagora Asset Management Inc | 681 102 | 3,69 | 18 192 | 29,79 | ||||
| 2026-02-13 | 13F | Victory Capital Management Inc | 177 605 | -26,33 | 4 744 | -7,80 | ||||
| 2026-02-17 | 13F | Sphera Funds Management Ltd. | 212 202 | 42,51 | 5 668 | 78,38 | ||||
| 2026-02-06 | 13F | Larson Financial Group LLC | 111 | 146,67 | 3 | |||||
| 2026-02-12 | 13F | Hohimer Wealth Management, Llc | 0 | -100,00 | 0 | |||||
| 2026-02-13 | 13F | Hudson Bay Capital Management LP | 70 000 | -0,43 | 1 870 | 24,60 | ||||
| 2026-02-17 | 13F | Kemnay Advisory Services Inc. | 385 | 10 | ||||||
| 2025-11-07 | 13F | Sierra Ocean, Llc | 0 | -100,00 | 0 | |||||
| 2026-02-09 | 13F | Geode Capital Management, Llc | 3 239 451 | 3,41 | 86 539 | 29,44 | ||||
| 2026-02-17 | 13F | Ameriprise Financial Inc | 662 241 | -3,31 | 17 678 | 20,95 | ||||
| 2026-02-13 | 13F | MAI Capital Management | 285 | 185,00 | 8 | 250,00 | ||||
| 2026-02-10 | 13F | Connor, Clark & Lunn Investment Management Ltd. | 580 969 | -13,08 | 15 518 | 8,80 | ||||
| 2026-02-13 | 13F | Kestra Advisory Services, LLC | 4 395 | 117 | ||||||
| 2026-01-29 | 13F | Dunhill Financial, LLC | 2 | 0 | ||||||
| 2026-02-13 | 13F | Morgan Stanley | 1 141 974 | -3,91 | 30 502 | 20,28 | ||||
| 2026-02-17 | 13F | Gotham Asset Management, LLC | 18 441 | -57,28 | 493 | -46,58 | ||||
| 2026-02-14 | 13F | Rockefeller Capital Management L.P. | 1 113 040 | 7,40 | 29 729 | 34,44 | ||||
| 2026-02-13 | 13F | Frazier Life Sciences Management, L.P. | 1 297 198 | 111,33 | 34 648 | 164,51 | ||||
| 2026-02-17 | 13F | Mercer Global Advisors Inc /adv | 9 620 | 257 | ||||||
| 2026-02-12 | 13F | BlackRock, Inc. | 20 755 452 | 2,40 | 554 378 | 28,17 | ||||
| 2025-11-14 | 13F | Prelude Capital Management, Llc | 0 | -100,00 | 0 | |||||
| 2026-02-02 | 13F | Strs Ohio | 41 400 | -5,91 | 1 106 | 17,80 | ||||
| 2025-09-29 | NP | SUNAMERICA SERIES TRUST - SA Small Cap Index Portfolio Class 1 | 14 150 | 4,03 | 337 | 70,20 | ||||
| 2026-01-12 | 13F | Abound Wealth Management | 7 | 0,00 | 0 | |||||
| 2025-10-30 | 13F | Twin Peaks Wealth Advisors, LLC | 0 | -100,00 | 0 | |||||
| 2026-02-03 | 13F | Farmers & Merchants Investments Inc | 75 | 0,00 | 2 | 100,00 | ||||
| 2026-02-17 | 13F | Baker Bros. Advisors Lp | 42 896 690 | 0,00 | 1 145 771 | 25,16 | ||||
| 2026-01-28 | 13F | DekaBank Deutsche Girozentrale | 97 284 | 0,00 | 2 | -50,00 | ||||
| 2026-02-09 | 13F | Hantz Financial Services, Inc. | 960 | 55,34 | 0 | |||||
| 2026-01-28 | 13F | WPG Advisers, LLC | 103 | -22,56 | 3 | 0,00 | ||||
| 2026-02-11 | 13F | Erste Asset Management GmbH | 133 700 | 3 645 | ||||||
| 2026-02-10 | 13F | Natixis Advisors, L.p. | 71 652 | 11,55 | 2 | 0,00 | ||||
| 2026-02-17 | 13F | SageView Advisory Group, LLC | 160 | 4 | ||||||
| 2026-01-23 | 13F | Assetmark, Inc | 222 | 12,69 | 6 | 25,00 | ||||
| 2026-02-10 | 13F | Bnp Paribas Arbitrage, Sa | 44 756 | -19,43 | 1 195 | 0,84 | ||||
| 2026-02-17 | 13F | Algert Global Llc | 614 410 | 53,56 | 16 | 100,00 | ||||
| 2026-01-29 | 13F | UBS Group AG | 769 392 | 15,72 | 20 550 | 44,85 | ||||
| 2026-02-03 | 13F | SBI Securities Co., Ltd. | 197 | -75,50 | 5 | -70,59 | ||||
| 2026-02-17 | 13F | Tang Capital Management Llc | 300 000 | -80,00 | 8 013 | -74,97 | ||||
| 2026-02-02 | 13F | Oppenheimer Asset Management Inc. | 0 | -100,00 | 0 | |||||
| 2026-02-12 | 13F | Renaissance Technologies Llc | 1 532 596 | 5,73 | 40 936 | 32,33 | ||||
| 2026-02-11 | 13F | Los Angeles Capital Management Llc | 49 796 | -22,13 | 1 132 | -17,01 | ||||
| 2026-02-17 | 13F | Raymond James Financial Inc | 20 649 | -18,05 | 552 | 2,61 | ||||
| 2026-01-23 | 13F | Kelsey Financial, LLC | 10 000 | 267 | ||||||
| 2026-02-13 | 13F | Martingale Asset Management L P | 109 319 | 8,96 | 2 920 | 36,34 | ||||
| 2025-12-09 | 13F/A | Tudor Investment Corp Et Al | Call | 11 700 | 250 | |||||
| 2026-02-13 | 13F | Barclays Plc | 368 304 | -15,33 | 9 837 | 5,98 | ||||
| 2026-02-13 | 13F | Citigroup Inc | Call | 21 000 | 561 | |||||
| 2026-02-13 | 13F | Citigroup Inc | Put | 21 000 | 561 | |||||
| 2026-02-13 | 13F | Citigroup Inc | 83 684 | -94,68 | 2 235 | -93,35 | ||||
| 2025-12-09 | 13F/A | Tudor Investment Corp Et Al | Put | 11 400 | 243 | |||||
| 2026-02-11 | 13F | Jpmorgan Chase & Co | 270 826 | -16,90 | 7 234 | 4,00 | ||||
| 2026-02-11 | 13F | Ameritas Investment Partners, Inc. | 10 398 | 278 | ||||||
| 2026-01-14 | 13F | Exchange Traded Concepts, Llc | 6 149 | 161,21 | 164 | 228,00 | ||||
| 2026-02-17 | 13F | Maryland State Retirement & Pension System | 18 286 | 1,34 | 488 | 26,75 | ||||
| 2026-02-09 | 13F | Keating Financial Advisory Services, Inc. | 53 | 1 | ||||||
| 2026-01-14 | 13F | Hennion & Walsh Asset Management, Inc. | 103 846 | -21,17 | 2 774 | -1,35 | ||||
| 2026-02-17 | 13F | Quantinno Capital Management LP | 10 088 | -9,93 | 269 | 12,55 | ||||
| 2026-02-17 | 13F | Captrust Financial Advisors | 8 245 | 220 | ||||||
| 2026-01-23 | 13F | Burney Co/ | 105 411 | -1,61 | 2 816 | 23,14 | ||||
| 2026-02-13 | 13F | Stifel Financial Corp | 12 840 | 343 | ||||||
| 2026-01-29 | 13F | China Universal Asset Management Co., Ltd. | 27 568 | -6,78 | 736 | 16,64 | ||||
| 2026-02-17 | 13F | Glenmede Trust Co Na | 453 643 | 12 117 | ||||||
| 2026-02-10 | 13F | Root Financial Partners, LLC | 332 | 26,24 | 9 | 60,00 | ||||
| 2026-02-12 | 13F | Great Lakes Advisors, Llc | 313 536 | -31,06 | 8 375 | -13,71 | ||||
| 2025-11-13 | 13F | FORA Capital, LLC | 0 | -100,00 | 0 | |||||
| 2025-11-14 | 13F | Ubs Oconnor Llc | 0 | -100,00 | 0 | -100,00 | ||||
| 2026-01-30 | 13F | NJ State Employees Deferred Compensation Plan | 0 | -100,00 | 0 | -100,00 | ||||
| 2026-02-12 | 13F | Dimensional Fund Advisors Lp | 2 920 974 | 4,39 | 78 019 | 30,66 | ||||
| 2025-09-29 | NP | PRFZ - Invesco FTSE RAFI US 1500 Small-Mid ETF This fund is a listed as child fund of Invesco Ltd. and if that institution has disclosed ownership in this security, then these positions will not be double counted when calculating total shares and total value | 87 615 | 58,10 | 2 088 | 157,97 | ||||
| 2026-02-05 | 13F | Allworth Financial LP | 545 | -7,47 | 15 | 16,67 | ||||
| 2026-02-17 | 13F | Two Sigma Investments, Lp | 1 119 117 | 68,06 | 29 892 | 110,35 | ||||
| 2025-10-24 | 13F | Hemington Wealth Management | 122 | 125,93 | 0 | |||||
| 2026-01-05 | 13F | GAMMA Investing LLC | 3 409 | 1,43 | 91 | 28,17 | ||||
| 2026-02-09 | 13F | Quest Partners LLC | 28 794 | -10,72 | 769 | 11,77 | ||||
| 2026-02-12 | 13F | CIBC Private Wealth Group, LLC | 30 | -21,05 | 1 | |||||
| 2026-02-10 | 13F | Goldman Sachs Group Inc | 1 570 051 | -25,32 | 41 936 | -6,53 | ||||
| 2026-01-21 | 13F | SJS Investment Consulting Inc. | 41 | 355,56 | 1 | |||||
| 2026-01-23 | 13F | Brown, Lisle/cummings, Inc. | 500 | 0,00 | 13 | 30,00 | ||||
| 2026-02-13 | 13F | Jacobs Levy Equity Management, Inc | 371 047 | -50,00 | 9 911 | -37,42 | ||||
| 2026-02-11 | 13F | Illinois Municipal Retirement Fund | 63 187 | -10,61 | 1 688 | 11,87 | ||||
| 2025-09-29 | NP | CRSSX - CATHOLIC RESPONSIBLE INVESTMENTS SMALL-CAP FUND Institutional Shares | 55 948 | -8,20 | 1 333 | 49,94 | ||||
| 2026-02-02 | 13F | Truist Financial Corp | 29 834 | 15,74 | 797 | 44,73 | ||||
| 2025-11-21 | 13F | Nebula Research & Development LLC | 0 | -100,00 | 0 | |||||
| 2026-02-13 | 13F | Arrowstreet Capital, Limited Partnership | 1 502 617 | -8,87 | 40 135 | 14,06 | ||||
| 2026-02-06 | 13F | Handelsbanken Fonder AB | 56 733 | 14,77 | 2 | 0,00 | ||||
| 2026-02-11 | 13F | J.w. Cole Advisors, Inc. | 20 632 | 2,49 | 551 | 28,44 | ||||
| 2026-02-13 | 13F | Smartleaf Asset Management LLC | 2 596 | 51,64 | 69 | 91,67 | ||||
| 2026-02-04 | 13F | Dynamic Wealth Strategies, LLC | 131 | 0,00 | 3 | 50,00 | ||||
| 2026-02-02 | 13F | Fifth Third Bancorp | 615 | -19,19 | 16 | 0,00 | ||||
| 2026-02-03 | 13F | Privium Fund Management B.V. | 0 | -100,00 | 0 | -100,00 | ||||
| 2026-02-17 | 13F | Weiss Asset Management LP | 58 740 | 1 569 | ||||||
| 2026-02-12 | 13F | Elo Mutual Pension Insurance Co | 0 | -100,00 | 0 | |||||
| 2026-01-23 | 13F | Yorktown Management & Research Co Inc | 12 050 | 0,00 | 322 | 24,90 | ||||
| 2026-02-06 | 13F | IFP Advisors, Inc | 1 278 | 15,66 | 34 | 47,83 | ||||
| 2026-02-17 | 13F | Qube Research & Technologies Ltd | 1 202 601 | 101,63 | 32 121 | 152,36 | ||||
| 2026-02-10 | 13F | Goldman Sachs Group Inc | Put | 0 | -100,00 | 0 | ||||
| 2026-02-17 | 13F | Braidwell Lp | 2 032 021 | -14,57 | 54 275 | 6,92 | ||||
| 2026-02-10 | 13F | Goldman Sachs Group Inc | Call | 0 | -100,00 | 0 | ||||
| 2025-11-14 | 13F | Binnacle Investments Inc | 19 | 0 | ||||||
| 2026-02-17 | 13F | Boothbay Fund Management, Llc | Put | 0 | -100,00 | 0 | ||||
| 2026-02-11 | 13F | Vestcor Inc | 22 601 | 0,00 | 1 | |||||
| 2026-01-22 | 13F | Bear Mountain Capital, Inc. | 0 | -100,00 | 0 | |||||
| 2026-02-11 | 13F | Parallel Advisors, LLC | 42 | -27,59 | 1 | 0,00 | ||||
| 2026-02-13 | 13F | Advyzon Investment Management, LLC | 11 612 | 7,38 | 310 | 34,78 | ||||
| 2026-01-07 | 13F | Massmutual Trust Co Fsb/adv | 62 | 0,00 | 2 | 0,00 | ||||
| 2026-02-13 | 13F | Public Sector Pension Investment Board | 0 | -100,00 | 0 | |||||
| 2026-02-09 | 13F | Fisher Asset Management, LLC | 665 087 | 4,17 | 17 764 | 30,38 | ||||
| 2026-02-17 | 13F | Millennium Management Llc | 553 674 | -62,67 | 14 789 | -53,28 | ||||
| 2026-02-12 | 13F | Alps Advisors Inc | 158 197 | 58,49 | 4 225 | 98,36 | ||||
| 2026-02-17 | 13F | MIRAE ASSET GLOBAL ETFS HOLDINGS Ltd. | 81 607 | 2,34 | 2 180 | 28,10 | ||||
| 2026-02-17 | 13F | Persistent Asset Partners Ltd | Call | 0 | -100,00 | 0 | ||||
| 2026-02-11 | 13F | O'shaughnessy Asset Management, Llc | 0 | -100,00 | 0 | |||||
| 2026-02-09 | 13F | Emerald Advisers, Llc | 811 197 | 42,40 | 21 667 | 78,24 | ||||
| 2026-02-13 | 13F | Stonepine Capital Management, LLC | 100 000 | -42,71 | 2 671 | -28,28 | ||||
| 2025-11-14 | 13F | National Bank Of Canada /fi/ | 0 | -100,00 | 0 | -100,00 | ||||
| 2026-03-24 | 13F/A | Barclays Plc | Put | 0 | -100,00 | 0 | ||||
| 2025-10-07 | 13F | Thurston, Springer, Miller, Herd & Titak, Inc. | 0 | -100,00 | 0 | |||||
| 2026-01-13 | 13F | CoreCap Advisors, LLC | 15 366 | -16,13 | 410 | 5,13 | ||||
| 2026-01-30 | 13F | New York State Teachers Retirement System | 34 125 | -21,92 | 1 | |||||
| 2026-02-17 | 13F | Advisor Group Holdings, Inc. | 9 918 | -41,83 | 265 | -32,99 | ||||
| 2026-02-12 | 13F | Ensign Peak Advisors, Inc | 7 900 | -66,95 | 211 | -58,63 | ||||
| 2025-11-07 | 13F | Shell Asset Management Co | 2 561 | -57,42 | 0 | |||||
| 2026-02-13 | 13F | Centiva Capital, LP | Call | 0 | -100,00 | 0 | ||||
| 2025-10-24 | 13F | Bayforest Capital Ltd | 0 | -100,00 | 0 | |||||
| 2026-01-27 | 13F | Gf Fund Management Co. Ltd. | 3 324 | -8,43 | 89 | 14,29 | ||||
| 2026-02-17 | 13F | Guggenheim Capital Llc | 94 687 | 194,77 | 2 529 | 269,20 | ||||
| 2026-02-02 | 13F | Hussman Strategic Advisors, Inc. | 147 000 | 16,67 | 3 926 | 46,06 | ||||
| 2026-02-09 | 13F | Westover Capital Advisors, LLC | 7 592 | 203 | ||||||
| 2026-02-13 | 13F | Uniting Wealth Partners, LLC | 11 000 | 0,00 | 294 | 25,21 | ||||
| 2026-02-06 | 13F | Profund Advisors Llc | 77 073 | 67,87 | 2 059 | 110,21 | ||||
| 2026-02-03 | 13F | Violich Capital Management, Inc. | 9 025 | 241 | ||||||
| 2026-02-17 | 13F | Tower Research Capital LLC (TRC) | 1 143 | -70,21 | 31 | -62,96 | ||||
| 2026-02-13 | 13F | Mml Investors Services, Llc | 32 737 | 46,73 | 874 | 83,61 | ||||
| 2026-01-29 | 13F | Pictet Asset Management Holding SA | 1 547 103 | 5,75 | 41 493 | 32,93 | ||||
| 2026-02-17 | 13F | Caption Management, LLC | Put | 20 000 | -88,66 | 534 | -85,81 | |||
| 2026-01-26 | 13F | KBC Group NV | 3 619 | 0,00 | 0 | |||||
| 2026-02-06 | 13F | Lsv Asset Management | 17 200 | 0,00 | 0 | |||||
| 2026-02-10 | 13F | Norges Bank | 1 507 527 | 40 266 | ||||||
| 2026-02-12 | 13F | Nuveen, LLC | 1 057 527 | 10,85 | 28 247 | 38,75 | ||||
| 2026-02-17 | 13F | Virtus Investment Advisers, Inc. | 25 170 | 23,13 | 672 | 54,13 | ||||
| 2026-02-13 | 13F | BNP Paribas Asset Management Holding S.A. | 1 421 | 0 | ||||||
| 2026-03-23 | 13F/A | Barclays Plc | Call | 0 | -100,00 | 0 | ||||
| 2026-02-17 | 13F | Eversept Partners, LP | 176 594 | 7,52 | 4 717 | 34,59 | ||||
| 2026-01-22 | 13F | Massachusetts Financial Services Co /ma/ | 1 072 483 | -3,44 | 28 646 | 20,86 | ||||
| 2026-02-17 | 13F | Caption Management, LLC | Call | 100 000 | -84,22 | 2 671 | -80,25 | |||
| 2026-02-13 | 13F | Pinnacle Wealth Planning Services, Inc. | 11 193 | -2,46 | 299 | 22,13 | ||||
| 2026-01-15 | 13F | Nisa Investment Advisors, Llc | 1 773 | 5,98 | 47 | 34,29 | ||||
| 2026-02-12 | 13F | MetLife Investment Management, LLC | 70 465 | -4,92 | 1 882 | 19,04 | ||||
| 2026-02-13 | 13F | Truvestments Capital Llc | 199 | 0,00 | 5 | 25,00 | ||||
| 2026-01-27 | 13F | Zurcher Kantonalbank (Zurich Cantonalbank) | 37 831 | 15,34 | 1 010 | 44,49 | ||||
| 2025-11-21 | 13F/A | CIBC Bancorp USA Inc. | 13 267 | 283 | ||||||
| 2026-01-29 | 13F | Vanguard Group Inc | 15 153 957 | -0,17 | 404 762 | 24,95 | ||||
| 2026-02-13 | 13F | Ubs Asset Management Americas Inc | 205 433 | -2,69 | 5 487 | 21,80 | ||||
| 2026-02-06 | 13F | Gsa Capital Partners Llp | 28 200 | -62,85 | 1 | -100,00 | ||||
| 2025-11-13 | 13F | Winton Capital Group Ltd | 0 | -100,00 | 0 | |||||
| 2025-11-14 | 13F | Skopos Labs, Inc. | 0 | -100,00 | 0 | |||||
| 2025-11-14 | 13F | Cubist Systematic Strategies, LLC | 27 469 | -92,28 | 586 | -92,36 | ||||
| 2026-01-08 | 13F | Grove Bank & Trust | 200 | 0,00 | 5 | 25,00 | ||||
| 2026-02-13 | 13F | Arete Wealth Advisors, LLC | 11 500 | -15,60 | 0 | |||||
| 2026-02-12 | 13F | Cloud Capital Management, LLC | 0 | -100,00 | 0 | |||||
| 2026-02-17 | 13F | LMR Partners LLP | Put | 0 | -100,00 | 0 | ||||
| 2026-02-13 | 13F | Public Employees Retirement Association Of Colorado | 13 821 | 0,00 | 0 | |||||
| 2026-02-10 | 13F | Bank of New York Mellon Corp | 751 985 | -5,51 | 20 086 | 18,27 | ||||
| 2026-02-18 | 13F | State of Tennessee, Treasury Department | 49 505 | -8,52 | 1 244 | 7,80 | ||||
| 2026-02-13 | 13F | Candriam Luxembourg S.C.A. | 0 | -100,00 | 0 | |||||
| 2026-02-11 | 13F | Franklin Resources Inc | 171 483 | -54,69 | 4 580 | -34,63 | ||||
| 2026-01-28 | 13F | Teacher Retirement System Of Texas | 17 447 | -39,22 | 466 | -23,86 | ||||
| 2026-02-12 | 13F | Commonwealth Equity Services, Llc | 14 705 | 7,33 | 393 | |||||
| 2026-02-12 | 13F | denkapparat Operations GmbH | 12 540 | 0,00 | 335 | 25,09 | ||||
| 2026-02-23 | 13F | Virtu Financial LLC | 0 | -100,00 | 0 | |||||
| 2026-02-18 | 13F | GWM Advisors LLC | 209 | 0,00 | 6 | 25,00 | ||||
| 2026-02-13 | 13F | Kilter Group LLC | 58 | 0,00 | 2 | 0,00 | ||||
| 2025-09-29 | NP | RSSL - Global X Russell 2000 ETF | 63 632 | -12,52 | 1 516 | 42,75 | ||||
| 2026-01-26 | 13F | Merit Financial Group, LLC | 39 411 | 1 053 | ||||||
| 2026-02-10 | 13F | Td Asset Management Inc | 0 | -100,00 | 0 | |||||
| 2025-11-07 | 13F | Readystate Asset Management Lp | 0 | -100,00 | 0 | |||||
| 2026-02-06 | 13F | HighTower Advisors, LLC | 9 965 | -4,34 | 266 | 19,82 | ||||
| 2026-02-06 | 13F | ProShare Advisors LLC | 31 678 | 7,52 | 846 | 34,71 | ||||
| 2026-02-10 | 13F | Globeflex Capital L P | 7 536 | 201 | ||||||
| 2025-11-14 | 13F | Exome Asset Management LLC | Call | 0 | -100,00 | 0 | -100,00 | |||
| 2026-02-11 | 13F | Meeder Asset Management Inc | 984 | 26 | ||||||
| 2026-02-11 | 13F | SOUTH STATE Corp | 0 | -100,00 | 0 | |||||
| 2026-02-17 | 13F | Capital Fund Management S.a. | 28 540 | -63,11 | 762 | -53,82 | ||||
| 2026-01-23 | 13F | Valley National Advisers Inc | 450 | 0,00 | 0 | |||||
| 2026-02-17 | 13F | Amundi | 18 245 | -18,75 | 487 | 0,62 | ||||
| 2026-02-06 | 13F | Leonteq Securities AG | 1 956 | -45,80 | 52 | -32,47 | ||||
| 2026-01-09 | 13F | Diversified Trust Co | 39 820 | 5,13 | 1 064 | 31,56 | ||||
| 2026-02-12 | 13F | Campbell & CO Investment Adviser LLC | 0 | -100,00 | 0 | |||||
| 2026-02-04 | 13F | LRI Investments, LLC | 363 | 59,21 | 10 | 125,00 | ||||
| 2026-02-02 | 13F | Danske Bank A/s | 0 | -100,00 | 0 | |||||
| 2026-02-13 | 13F | Prudential Financial Inc | 485 880 | -46,57 | 12 978 | -33,13 | ||||
| 2026-01-22 | 13F | Financial Consulate, Inc | 0 | -100,00 | 0 | |||||
| 2026-02-17 | 13F | Creative Planning | 44 031 | 21,13 | 1 176 | 51,74 | ||||
| 2025-09-29 | NP | YOVAX - YORKTOWN SMALL-CAP FUND Class A | 12 050 | 287 | ||||||
| 2026-02-17 | 13F | Jones Financial Companies Lllp | 1 277 | 63,30 | 34 | 112,50 | ||||
| 2026-01-21 | 13F | Sound Income Strategies, LLC | 595 | 15 | ||||||
| 2026-01-30 | 13F | State of New Jersey Common Pension Fund D | 40 309 | -53,03 | 1 077 | -41,23 | ||||
| 2026-01-14 | 13F | USA Financial Portformulas Corp | 0 | -100,00 | 0 | |||||
| 2026-02-10 | 13F | Intech Investment Management Llc | 48 250 | 0,00 | 1 289 | 25,17 | ||||
| 2026-01-15 | 13F | Fortitude Family Office, LLC | 21 | -34,38 | 1 | |||||
| 2026-02-11 | 13F | Stirlingshire Investments, Inc. | 10 619 | 284 | ||||||
| 2026-02-03 | 13F | Wesbanco Bank Inc | 78 200 | 0,00 | 2 089 | 25,18 | ||||
| 2026-02-06 | 13F | Cullen/frost Bankers, Inc. | 70 | 0,00 | 2 | 0,00 | ||||
| 2026-01-08 | 13F | Versant Capital Management, Inc | 536 | -26,37 | 14 | -6,67 | ||||
| 2026-02-17 | 13F | Janus Henderson Group Plc | 290 111 | 464,31 | 7 749 | 606,93 | ||||
| 2026-02-12 | 13F | Hrt Financial Lp | 0 | -100,00 | 0 | |||||
| 2026-02-17 | 13F | California State Teachers Retirement System | 126 807 | 25,93 | 3 387 | 57,68 | ||||
| 2026-02-10 | 13F | Quantbot Technologies LP | 7 453 | -71,41 | 199 | -64,21 | ||||
| 2025-11-14 | 13F | J. Goldman & Co LP | 0 | -100,00 | 0 | -100,00 | ||||
| 2025-11-14 | 13F | Wolverine Trading, Llc | Call | 17 400 | 371 | |||||
| 2025-11-14 | 13F | Wolverine Trading, Llc | Put | 33 900 | 723 | |||||
| 2026-02-13 | 13F | American Century Companies Inc | 128 998 | -69,16 | 3 446 | -61,40 | ||||
| 2026-02-17 | 13F | Diadema Partners Lp | Call | 0 | -100,00 | 0 | ||||
| 2026-02-10 | 13F | Rothschild Investment Llc | 215 | 13,16 | 6 | 25,00 | ||||
| 2026-02-10 | 13F | Mutual Of America Capital Management Llc | 14 309 | 2,32 | 382 | 28,19 | ||||
| 2026-02-02 | 13F | Horizon Investments, LLC | 55 356 | -31,64 | 1 479 | -14,42 | ||||
| 2025-09-29 | NP | BBP - Virtus LifeSci Biotech Products ETF | 20 441 | -14,08 | 487 | 40,35 | ||||
| 2026-01-26 | 13F | Mirae Asset Global Investments Co., Ltd. | 8 221 | 26,05 | 220 | 57,55 | ||||
| 2026-02-06 | 13F | Bare Financial Services, Inc | 242 | 365,38 | 6 | 500,00 | ||||
| 2025-10-31 | 13F | National Wealth Management Group, LLC | 0 | -100,00 | 0 | |||||
| 2026-02-12 | 13F | Quadrant Capital Group Llc | 28 | -50,00 | 1 | -100,00 | ||||
| 2026-02-20 | 13F | Sunbelt Securities, Inc. | 53 | 0,00 | 1 | 0,00 | ||||
| 2026-02-13 | 13F | Marshall Wace, Llp | 493 379 | 13 178 | ||||||
| 2025-11-14 | 13F | Exome Asset Management LLC | 0 | -100,00 | 0 | -100,00 | ||||
| 2026-02-17 | 13F | D. E. Shaw & Co., Inc. | 1 026 785 | -34,23 | 27 425 | -17,68 | ||||
| 2026-02-19 | 13F | Invesco Ltd. | 847 961 | 14,50 | 22 649 | 43,32 | ||||
| 2026-01-16 | 13F | Ronald Blue Trust, Inc. | 0 | -100,00 | 0 | |||||
| 2026-02-17 | 13F | Northern Trust Corp | 1 235 829 | -5,19 | 33 009 | 18,66 | ||||
| 2026-02-09 | 13F | Emerald Mutual Fund Advisers Trust | 484 506 | 53,65 | 12 941 | 92,32 | ||||
| 2026-02-13 | 13F | Mariner, LLC | 24 157 | 64,97 | 645 | 106,73 | ||||
| 2026-01-29 | 13F | Axecap Investments, LLC | 136 676 | -32,79 | 3 651 | -15,88 | ||||
| 2026-02-02 | 13F | CENTRAL TRUST Co | 0 | -100,00 | 0 | |||||
| 2026-02-17 | 13F | Abel Hall, LLC | 10 073 | 269 | ||||||
| 2026-02-13 | 13F | Rafferty Asset Management, LLC | 198 263 | 1,66 | 5 296 | 27,25 | ||||
| 2025-11-07 | 13F | NEOS Investment Management LLC | 0 | -100,00 | 0 | -100,00 | ||||
| 2026-02-10 | 13F | Jupiter Asset Management Ltd | 621 049 | 30,39 | 16 588 | 63,20 | ||||
| 2026-02-11 | 13F | LPL Financial LLC | 40 152 | 11,86 | 1 072 | 40,13 | ||||
| 2026-02-04 | 13F | Virginia Retirement Systems Et Al | 79 898 | 29,18 | 2 134 | 61,79 | ||||
| 2026-02-13 | 13F | Deep Track Capital, LP | 0 | -100,00 | 0 | |||||
| 2026-02-13 | 13F | State Street Corp | 7 910 733 | 9,03 | 211 296 | 36,47 | ||||
| 2026-02-17 | 13F | Bank Of America Corp /de/ | 1 221 445 | 37,57 | 32 625 | 72,19 | ||||
| 2026-01-09 | 13F | SG Americas Securities, LLC | 41 965 | 5,76 | 1 | |||||
| 2026-02-11 | 13F | Arrowpoint Investment Partners (Singapore) Pte. Ltd. | 10 011 | 267 | ||||||
| 2026-01-14 | 13F | Jfs Wealth Advisors, Llc | 72 | 94,59 | 2 | |||||
| 2026-01-15 | 13F | Allspring Global Investments Holdings, LLC | 658 813 | 25,39 | 17 320 | 55,21 | ||||
| 2026-02-12 | 13F | Wealthspire Advisors, LLC | 0 | -100,00 | 0 | |||||
| 2026-02-17 | 13F | Alliancebernstein L.p. | 156 243 | 0,81 | 4 173 | 26,19 | ||||
| 2026-02-06 | 13F | Legato Capital Management LLC | 8 407 | 225 | ||||||
| 2026-02-13 | 13F | Wells Fargo & Company/mn | 209 188 | 38,72 | 5 587 | 73,62 | ||||
| 2026-02-17 | 13F | Point72 Asset Management, L.P. | 3 377 311 | 127,22 | 90 208 | 184,40 | ||||
| 2026-02-11 | 13F | Nemes Rush Group LLC | 2 000 | 0,00 | 53 | 26,19 | ||||
| 2026-01-26 | 13F/A | Phocas Financial Corp. | 104 072 | -0,26 | 2 780 | 24,84 | ||||
| 2026-01-12 | 13F | Rialto Wealth Management, LLC | 12 | 71,43 | 0 | |||||
| 2026-02-10 | 13F | Acadian Asset Management Llc | 119 742 | 83,14 | 3 | 200,00 | ||||
| 2026-02-11 | 13F | CenterBook Partners LP | 0 | -100,00 | 0 | -100,00 | ||||
| 2026-02-17 | 13F | Scientech Research LLC | 0 | -100,00 | 0 | -100,00 | ||||
| 2026-02-13 | 13F | Bridgewater Associates, LP | 138 179 | -15,35 | 3 691 | 5,94 | ||||
| 2026-02-10 | 13F | Envestnet Asset Management Inc | 152 163 | 1,68 | 4 064 | 27,28 | ||||
| 2026-02-13 | 13F | Squarepoint Ops LLC | 40 709 | 1 087 | ||||||
| 2026-01-16 | 13F | DiNuzzo Private Wealth, Inc. | 15 | 25,00 | 0 | |||||
| 2026-02-05 | 13F | Thrivent Financial For Lutherans | 99 255 | 10,20 | 3 | 100,00 | ||||
| 2025-11-14 | 13F | WealthTrak Capital Management LLC | 0 | -100,00 | 0 | |||||
| 2026-02-04 | 13F | Oregon Public Employees Retirement Fund | 28 666 | 2,01 | 766 | 27,71 | ||||
| 2026-02-13 | 13F | Transamerica Financial Advisors, Inc. | 1 335 | 36 | ||||||
| 2026-02-13 | 13F | Charles Schwab Investment Management Inc | 1 172 317 | -2,64 | 31 313 | 21,86 | ||||
| 2026-02-12 | 13F | EntryPoint Capital, LLC | 10 345 | 0,00 | 276 | 25,45 | ||||
| 2026-02-17 | 13F | Cetera Investment Advisers | 16 355 | 2,74 | 437 | 28,61 | ||||
| 2026-01-09 | 13F | Assenagon Asset Management S.A. | 8 716 | -68,44 | 233 | -60,61 | ||||
| 2026-02-11 | 13F | Allianz Asset Management GmbH | 295 476 | 827,04 | 7 892 | 1 060,59 | ||||
| 2026-02-17 | 13F | Royal Bank Of Canada | 290 854 | -67,70 | 7 770 | -59,56 | ||||
| 2025-11-03 | 13F | Summit Global Investments | 0 | -100,00 | 0 | |||||
| 2026-02-17 | 13F | Citadel Advisors Llc | Put | 26 000 | -72,19 | 694 | -65,21 | |||
| 2026-02-17 | 13F | Citadel Advisors Llc | Call | 12 000 | -84,79 | 321 | -80,99 | |||
| 2025-11-14 | 13F | Texas Permanent School Fund | 0 | -100,00 | 0 | -100,00 | ||||
| 2026-02-18 | 13F | Mackenzie Financial Corp | 57 274 | 7,34 | 1 526 | 34,09 | ||||
| 2026-02-17 | 13F | Citadel Advisors Llc | 1 367 459 | 322,68 | 36 525 | 429,10 | ||||
| 2026-02-13 | 13F | Parkside Financial Bank & Trust | 349 | 11,15 | 9 | 50,00 | ||||
| 2026-02-05 | 13F | Bessemer Group Inc | 709 | 18,36 | 0 | |||||
| 2025-10-16 | 13F | Lowe Wealth Advisors, LLC | 180 | 0,00 | 4 | 0,00 | ||||
| 2026-02-17 | 13F | DZ BANK AG Deutsche Zentral Genossenschafts Bank, Frankfurt am Main | 194 146 | 173,30 | 5 186 | 242,24 | ||||
| 2026-02-17 | 13F | Jain Global LLC | 0 | -100,00 | 0 | |||||
| 2025-09-29 | NP | KCXIX - Knights of Columbus U.S. All Cap Index Fund I Shares | 555 | 8,82 | 13 | 85,71 | ||||
| 2026-02-17 | 13F | Trexquant Investment LP | 297 802 | 30,56 | 7 954 | 63,43 | ||||
| 2025-11-06 | 13F | Whipplewood Advisors, LLC | 0 | -100,00 | 0 | |||||
| 2026-01-08 | 13F | True Wealth Design, LLC | 94 | -31,39 | 3 | 0,00 | ||||
| 2026-02-13 | 13F | Macquarie Group Ltd | 0 | -100,00 | 0 | |||||
| 2026-01-29 | 13F | Concurrent Investment Advisors, LLC | 43 457 | 168,25 | 1 161 | 236,23 | ||||
| 2026-02-09 | 13F | Atlantic Trust, LLC | 0 | -100,00 | 0 | |||||
| 2026-02-06 | 13F | EverSource Wealth Advisors, LLC | 1 441 | 21,81 | 38 | 52,00 | ||||
| 2026-02-13 | 13F | Eventide Asset Management, Llc | 0 | -100,00 | 0 | |||||
| 2026-02-12 | 13F | Swiss National Bank | 232 904 | 2,55 | 6 221 | 28,35 | ||||
| 2025-11-14 | 13F | Point72 Asia (Singapore) Pte. Ltd. | 0 | -100,00 | 0 | |||||
| 2026-02-12 | 13F | Aviva Plc | 19 311 | -4,65 | 516 | 19,21 | ||||
| 2026-02-13 | 13F | Rice Hall James & Associates, Llc | 603 740 | -1,82 | 16 126 | 22,89 | ||||
| 2025-11-14 | 13F | Caption Management, LLC | 0 | -100,00 | 0 | -100,00 | ||||
| 2026-01-30 | 13F | Torren Management, LLC | 158 | 4 | ||||||
| 2026-02-10 | 13F | Daiwa Securities Group Inc. | 530 | 0,00 | 0 | |||||
| 2026-01-08 | 13F | Wealth Enhancement Advisory Services, Llc | 28 221 | -5,07 | 760 | 18,75 | ||||
| 2026-02-13 | 13F | Verition Fund Management LLC | 0 | -100,00 | 0 | |||||
| 2026-02-17 | 13F | Jump Financial, LLC | 108 355 | 2 894 |