Podstawowe statystyki
| Akcje instytucjonalne (długie) | 342 541 638 - 57,75% (ex 13D/G) - change of -164,53MM shares -32,45% MRQ |
| Wartość instytucjonalna (długa) | $ 315 475 USD ($1000) |
Własność instytucjonalna i akcjonariusze
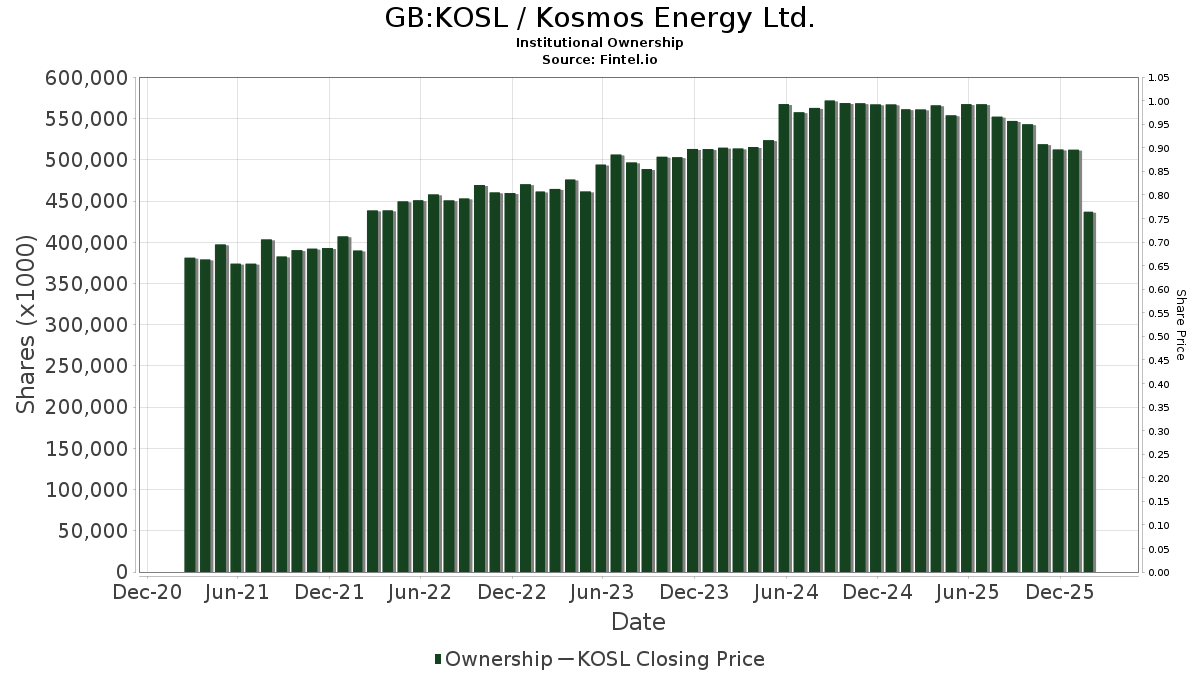
Kosmos Energy Ltd. (GB:KOSL) posiada 220 właściciele instytucjonalni i akcjonariusze, którzy złożyli formularze 13D/G lub 13F w Komisji Papierów Wartościowych (SEC). Instytucje te posiadają łącznie 342,541,638 akcji. Do największych akcjonariuszy należą BlackRock, Inc., Grantham, Mayo, Van Otterloo & Co. LLC, State Street Corp, Hotchkis & Wiley Capital Management Llc, Mason Hill Advisors Llc, Vanguard Group Inc, Millennium Management Llc, Charles Schwab Investment Management Inc, American Century Companies Inc, and Geode Capital Management, Llc .
Kosmos Energy Ltd. (BATS-CHIXE:KOSL) instytucjonalna struktura własności pokazuje aktualne pozycje w firmie według instytucji i funduszy, a także najnowsze zmiany w wielkości stanowisk. Głównymi akcjonariuszami mogą być inwestorzy indywidualni, fundusze inwestycyjne, fundusze hedgingowe lub instytucje. Załącznik 13D wskazuje, że inwestor posiada (lub posiadał) więcej niż 5% udziałów w spółce i zamierza (lub zamierzał) aktywnie dążyć do zmiany strategii biznesowej. Załącznik 13G wskazuje na inwestycję pasywną na poziomie ponad 5%.
Ocena sentymentu funduszu
Wskaźnik sentymentu funduszu (fka Ownership Accumulation Score) pozwala określić akcje, które są najczęściej kupowane przez fundusze. Jest to wynik zaawansowanego, wieloczynnikowego modelu ilościowego, który identyfikuje spółki o najwyższym poziomie akumulacji instytucjonalnej. Model oceny wykorzystuje kombinację całkowitego wzrostu liczby ujawnionych właścicieli, zmian w alokacji portfela wśród tych właścicieli i innych wskaźników. Liczba waha się od 0 do 100, przy czym wyższe liczby wskazują na wyższy poziom akumulacji w stosunku do innych spółek, a 50 oznacza średnią.
Częstotliwość aktualizacji: codziennie
Sprawdź Ownership Explorer, który zawiera listę firm o najwyższym rankingu.
AI+ Ask Fintel’s AI assistant about Kosmos Energy Ltd..
Select a question to share a public post with an AI-crafted answer.
Thinking of good questions…
Zgłoszenia 13F i NPORT
Szczegółowe dane dotyczące zgłoszeń 13F są bezpłatne. Szczegółowe dane dotyczące zgłoszeń NP wymagają członkostwa premium. Zielone rzędy wskazują nowe pozycje. Czerwone rzędy wskazują pozycje zamknięte. Kliknij w ikonę linku, aby zobaczyć pełną historię transakcji.
Aktualizacja
aby odblokować dane premium i eksportować do Excela ![]() .
.
| Data pliku | Źródło | Inwestor | Typ | Średnia cena (Est) |
Akcje | Akcje; Δ (%) |
Zgłoszono Wartość ($1000) |
Wartość; Δ (%) |
Przydział portu (%) |
|
|---|---|---|---|---|---|---|---|---|---|---|
| 2026-02-11 | 13F | Group One Trading, L.p. | Call | 555 600 | 25,79 | 504 | -31,24 | |||
| 2026-02-17 | 13F | DV Trading LLC | 57 | 0 | ||||||
| 2026-01-27 | 13F | Gf Fund Management Co. Ltd. | 143 809 | 10,91 | 130 | -39,53 | ||||
| 2026-02-11 | 13F | Group One Trading, L.p. | 884 523 | -9,48 | 803 | -50,55 | ||||
| 2026-02-12 | 13F | New York State Common Retirement Fund | 276 252 | 60,75 | 251 | -12,28 | ||||
| 2026-02-17 | 13F | Sig Brokerage, Lp | 26 288 | 0,00 | 24 | -46,51 | ||||
| 2026-02-13 | 13F | Sterling Capital Management LLC | 28 522 | -12,89 | 26 | -53,70 | ||||
| 2026-02-17 | 13F | Wellington Management Group Llp | 0 | -100,00 | 0 | |||||
| 2026-01-28 | 13F | CAPROCK Group, Inc. | 21 721 | -26,44 | 20 | -63,46 | ||||
| 2026-02-17 | 13F | MIRAE ASSET GLOBAL ETFS HOLDINGS Ltd. | 233 578 | 4,81 | 212 | -42,82 | ||||
| 2026-02-17 | 13F | XTX Topco Ltd | 914 037 | 500,64 | 829 | 228,97 | ||||
| 2026-02-17 | 13F | Tower Research Capital LLC (TRC) | 26 695 | 26,91 | 24 | -29,41 | ||||
| 2026-04-06 | 13F | Old Port Advisors | 29 704 | 0,00 | 83 | 215,38 | ||||
| 2026-02-09 | 13F | Key FInancial Inc | 27 | 0,00 | 0 | |||||
| 2026-02-12 | 13F | Federation des caisses Desjardins du Quebec | 3 500 | 3 | ||||||
| 2026-02-17 | 13F | Advisor Group Holdings, Inc. | 2 423 | -58,31 | 2 | -77,78 | ||||
| 2026-02-03 | 13F | Ballentine Partners, LLC | 24 106 | -51,41 | 22 | -74,39 | ||||
| 2026-02-12 | 13F | DRW Securities, LLC | 86 665 | 79 | ||||||
| 2026-02-12 | 13F | BlackRock, Inc. | 46 852 560 | -32,01 | 42 514 | -62,83 | ||||
| 2026-02-04 | 13F | Swiss Life Asset Management Ltd | 20 988 | 0,00 | 19 | -44,12 | ||||
| 2026-02-06 | 13F | IFP Advisors, Inc | 10 | -66,67 | 0 | |||||
| 2026-02-10 | 13F | Ellevest, Inc. | 174 902 | 196,78 | 159 | 62,89 | ||||
| 2026-02-13 | 13F | Heritage Wealth Advisors | 4 995 | 5 | ||||||
| 2026-02-10 | 13F | Moors & Cabot, Inc. | 183 950 | -13,01 | 167 | -52,71 | ||||
| 2026-01-29 | 13F | Sanctuary Advisors, LLC | 0 | -100,00 | 0 | -100,00 | ||||
| 2026-02-11 | 13F | Barrow Hanley Mewhinney & Strauss Llc | 4 396 | 0,00 | 4 | -57,14 | ||||
| 2025-11-14 | 13F | Capstone Investment Advisors, Llc | 25 548 | 42 | ||||||
| 2026-02-05 | 13F | Bessemer Group Inc | 0 | -100,00 | 0 | |||||
| 2025-11-21 | 13F/A | CIBC Bancorp USA Inc. | 50 581 | 84 | ||||||
| 2026-01-28 | 13F | Arizona State Retirement System | 131 964 | -6,70 | 120 | -49,15 | ||||
| 2026-02-13 | 13F | Caxton Associates Llp | 485 633 | 441 | ||||||
| 2025-11-06 | 13F | Baader Bank INC | 0 | -100,00 | 0 | |||||
| 2026-02-10 | 13F | Disciplined Investors, L.L.C. | 0 | -100,00 | 0 | |||||
| 2026-02-12 | 13F | M&G Plc | 8 736 923 | 9,51 | 8 737 | -45,25 | ||||
| 2026-02-17 | 13F | Captrust Financial Advisors | 28 601 | 93,94 | 26 | 4,17 | ||||
| 2026-01-30 | 13F | Kiker Wealth Management, LLC | 0 | -100,00 | 0 | |||||
| 2026-02-11 | 13F | LPL Financial LLC | 0 | -100,00 | 0 | |||||
| 2026-02-10 | 13F | Bank of New York Mellon Corp | 1 525 035 | -34,84 | 1 384 | -64,39 | ||||
| 2026-02-17 | 13F | Gotham Asset Management, LLC | 48 660 | -61,21 | 44 | -78,85 | ||||
| 2026-02-11 | 13F | Group One Trading, L.p. | Put | 356 400 | 22,90 | 323 | -32,85 | |||
| 2026-01-20 | 13F | Harbor Capital Advisors, Inc. | 245 034 | 9,81 | 0 | |||||
| 2026-02-10 | 13F | Nomura Asset Management Co Ltd | 0 | -100,00 | 0 | |||||
| 2026-01-29 | 13F | Pictet Asset Management Holding SA | 65 850 | 0,00 | 60 | -45,87 | ||||
| 2026-02-13 | 13F | Rafferty Asset Management, LLC | 811 006 | 9,77 | 736 | -40,05 | ||||
| 2026-02-19 | 13F | Invesco Ltd. | 1 870 906 | -81,11 | 1 698 | -89,68 | ||||
| 2026-02-11 | 13F | Franklin Resources Inc | 14 422 | -85,92 | 13 | -92,31 | ||||
| 2026-02-03 | 13F | NewEdge Wealth, LLC | 11 382 | 10 | ||||||
| 2026-04-07 | 13F | Farther Finance Advisors, LLC | 8 545 | -15,84 | 23 | 144,44 | ||||
| 2026-02-17 | 13F | Balyasny Asset Management Llc | 67 013 | 43,73 | 61 | -22,08 | ||||
| 2026-02-12 | 13F | CIBC Private Wealth Group, LLC | 0 | -100,00 | 0 | |||||
| 2026-02-12 | 13F | Dalton Investments LLC | 500 000 | 454 | ||||||
| 2026-02-11 | 13F | Simplex Trading, Llc | Put | 248 500 | -56,22 | 225 | ||||
| 2026-02-17 | 13F | Two Sigma Advisers, Lp | 1 834 222 | 163,11 | 1 664 | 43,82 | ||||
| 2026-02-11 | 13F | Simplex Trading, Llc | 139 947 | -63,26 | 127 | |||||
| 2026-02-13 | 13F | MAI Capital Management | 258 | 0,00 | 0 | |||||
| 2026-02-11 | 13F | Simplex Trading, Llc | Call | 645 900 | -8,04 | 586 | 58 400,00 | |||
| 2026-01-21 | 13F | Woodmont Investment Counsel Llc | 38 925 | -3,04 | 35 | -46,97 | ||||
| 2026-02-13 | 13F | Wells Fargo & Company/mn | 1 727 540 | -40,38 | 1 568 | -67,42 | ||||
| 2026-02-14 | 13F | Rockefeller Capital Management L.P. | 13 671 | 415,30 | 12 | 200,00 | ||||
| 2026-01-15 | 13F | Nisa Investment Advisors, Llc | 0 | -100,00 | 0 | |||||
| 2026-02-10 | 13F | Connor, Clark & Lunn Investment Management Ltd. | 192 424 | 730,34 | 175 | 357,89 | ||||
| 2026-02-17 | 13F | Raymond James Financial Inc | 883 899 | -9,50 | 802 | -50,52 | ||||
| 2026-02-23 | 13F | IronBridge Private Wealth, LLC | 0 | -100,00 | 0 | |||||
| 2025-11-14 | 13F | Vident Advisory, LLC | 0 | -100,00 | 0 | |||||
| 2026-02-12 | 13F | Jane Street Group, Llc | Put | 0 | -100,00 | 0 | -100,00 | |||
| 2026-02-10 | 13F | Sfmg, Llc | 83 480 | -10,70 | 76 | -51,61 | ||||
| 2026-02-11 | 13F | Jpmorgan Chase & Co | 2 013 116 | 537,75 | 1 827 | 249,14 | ||||
| 2025-11-12 | 13F | Royce & Associates Lp | 0 | -100,00 | 0 | |||||
| 2026-02-19 | 13F | Lexington Hill Partners, LLC | 20 000 | 18 | ||||||
| 2026-02-06 | 13F | Bare Financial Services, Inc | 553 | 96,80 | 1 | |||||
| 2026-02-13 | 13F | Walleye Capital LLC | 0 | -100,00 | 0 | |||||
| 2026-02-17 | 13F | Sagewood Asset Management LP | 45 890 | 42 | ||||||
| 2026-02-17 | 13F | Snowden Capital Advisors LLC | 0 | -100,00 | 0 | |||||
| 2026-02-17 | 13F | Jones Financial Companies Lllp | 2 920 | 70,76 | 3 | -33,33 | ||||
| 2026-01-30 | 13F | Us Bancorp \de\ | 20 382 | -42,63 | 18 | -68,97 | ||||
| 2026-02-10 | 13F | Intech Investment Management Llc | 222 515 | -6,11 | 202 | -48,85 | ||||
| 2025-11-14 | 13F | Cubist Systematic Strategies, LLC | Put | 18 000 | 0,00 | 30 | -3,33 | |||
| 2026-02-17 | 13F | Imprint Wealth LLC | 0 | -100,00 | 0 | |||||
| 2026-02-13 | 13F | Neuberger Berman Group LLC | 14 887 | 5,66 | 14 | -43,48 | ||||
| 2026-02-11 | 13F | Inceptionr Llc | 0 | -100,00 | 0 | |||||
| 2026-02-17 | 13F | Janus Henderson Group Plc | 211 288 | 0,00 | 191 | -45,56 | ||||
| 2026-02-09 | 13F | Legal & General Group Plc | 411 650 | -13,20 | 374 | -52,60 | ||||
| 2025-10-20 | 13F | Security National Bank | 0 | -100,00 | 0 | |||||
| 2026-01-27 | 13F | Belpointe Asset Management LLC | 0 | -100,00 | 0 | |||||
| 2026-02-03 | 13F | Mitsubishi UFJ Kokusai Asset Management Co., Ltd. | 2 145 | 0,00 | 2 | -66,67 | ||||
| 2026-01-27 | 13F | Checchi Capital Advisers, LLC | 0 | -100,00 | 0 | |||||
| 2025-11-06 | 13F | Ground Swell Capital, LLC | 0 | -100,00 | 0 | |||||
| 2026-01-23 | 13F | Smith, Moore & Co. | 28 026 | -4,92 | 25 | -47,92 | ||||
| 2026-02-06 | 13F | HighTower Advisors, LLC | 13 800 | -9,70 | 13 | -52,00 | ||||
| 2026-02-17 | 13F | Millennium Management Llc | 14 827 966 | -8,35 | 13 455 | -49,91 | ||||
| 2026-02-17 | 13F | Ameriprise Financial Inc | 927 512 | -58,37 | 842 | -77,26 | ||||
| 2026-02-17 | 13F | State Of Wisconsin Investment Board | 26 103 | -40,57 | 24 | -68,06 | ||||
| 2026-02-06 | 13F | ProShare Advisors LLC | 86 720 | 6,88 | 79 | -41,79 | ||||
| 2026-02-09 | 13F | Jefferies Financial Group Inc. | 150 000 | 136 | ||||||
| 2026-02-17 | 13F | Nomura Holdings Inc | 1 026 002 | -45,27 | 931 | -70,11 | ||||
| 2026-03-03 | 13F/A | Caitong International Asset Management Co., Ltd | 79 | -99,37 | 0 | -100,00 | ||||
| 2026-02-17 | 13F | Quadrature Capital Ltd | 0 | -100,00 | 0 | |||||
| 2026-02-12 | 13F | Wealthspire Advisors, LLC | 0 | -100,00 | 0 | |||||
| 2026-02-13 | 13F | Ostrum Asset Management | 4 008 525 | 0,00 | 3 637 | -45,34 | ||||
| 2025-11-12 | 13F | Creekmur Asset Management LLC | 3 | 0,00 | 0 | |||||
| 2026-02-13 | 13F | Citigroup Inc | 760 813 | 51,31 | 690 | -17,27 | ||||
| 2026-04-07 | 13F | CoreCap Advisors, LLC | 1 000 | 0,00 | 3 | |||||
| 2026-02-04 | 13F | First Eagle Investment Management, LLC | 0 | -100,00 | 0 | |||||
| 2026-02-11 | 13F | SmartHarvest Portfolios, LLC | 13 764 | 12 | ||||||
| 2026-02-12 | 13F | Jane Street Group, Llc | 9 269 753 | 431,92 | 8 411 | 190,84 | ||||
| 2026-04-09 | 13F | Sanders Morris Harris Llc | 71 000 | 197 | ||||||
| 2026-02-09 | 13F | Geode Capital Management, Llc | 11 272 318 | 7,97 | 10 230 | -40,98 | ||||
| 2026-02-12 | 13F | Jane Street Group, Llc | Call | 205 600 | 448,27 | 187 | 200,00 | |||
| 2026-01-08 | 13F | Versant Capital Management, Inc | 0 | -100,00 | 0 | |||||
| 2026-02-12 | 13F | Brinker Capital Investments, LLC | 0 | -100,00 | 0 | |||||
| 2026-01-28 | 13F | Klp Kapitalforvaltning As | 196 400 | 56,62 | 178 | -14,42 | ||||
| 2026-02-09 | 13F | Delta Asset Management Llc/tn | 0 | -100,00 | 0 | |||||
| 2025-10-16 | 13F | Sheets Smith Wealth Management | 0 | -100,00 | 0 | |||||
| 2026-02-05 | 13F | Atria Investments Llc | 198 721 | 9,40 | 180 | -40,20 | ||||
| 2026-02-17 | 13F | Man Group plc | 154 146 | 140 | ||||||
| 2026-02-17 | 13F | Equitable Holdings, Inc. | 45 539 | 30,33 | 41 | -29,31 | ||||
| 2025-11-13 | 13F | Farringdon Capital, Ltd. | 0 | -100,00 | 0 | -100,00 | ||||
| 2026-02-11 | 13F | Cerity Partners LLC | 12 142 | -15,93 | 11 | -52,17 | ||||
| 2026-02-17 | 13F | Price T Rowe Associates Inc /md/ | 280 365 | -27,93 | 0 | |||||
| 2026-02-17 | 13F | Cetera Investment Advisers | 0 | -100,00 | 0 | |||||
| 2026-01-21 | 13F | Graham Capital Wealth Management, Llc | 0 | -100,00 | 0 | |||||
| 2026-01-28 | 13F | Geneos Wealth Management Inc. | 4 986 | -0,28 | 5 | -50,00 | ||||
| 2026-02-12 | 13F | CoreCommodity Management, LLC | 19 180 | -58,14 | 17 | -77,63 | ||||
| 2026-01-15 | 13F | Victory Financial Group, Llc | 18 733 | 17 | ||||||
| 2025-11-17 | 13F | FSA Wealth Management LLC | 230 | 0,00 | 0 | |||||
| 2026-02-13 | 13F | Walleye Capital LLC | Put | 0 | -100,00 | 0 | ||||
| 2026-02-13 | 13F | State Street Corp | 20 430 076 | 5,27 | 18 538 | -42,45 | ||||
| 2026-02-13 | 13F | Walleye Trading LLC | Call | 100 | 0,00 | 0 | ||||
| 2026-02-18 | 13F | Guardian Capital Lp | 0 | -100,00 | 0 | |||||
| 2026-02-10 | 13F | Goldman Sachs Group Inc | 6 766 857 | 175,23 | 6 140 | 50,45 | ||||
| 2026-02-13 | 13F | Walleye Trading LLC | 14 631 | -14,02 | 13 | -53,57 | ||||
| 2026-04-08 | 13F | Inspirion Wealth Advisors, Llc | 27 828 | 77 | ||||||
| 2026-02-13 | 13F | Walleye Trading LLC | Put | 300 | -62,50 | 0 | -100,00 | |||
| 2026-02-12 | 13F | Quadrant Capital Group Llc | 11 578 | -80,54 | 11 | -89,80 | ||||
| 2026-02-18 | 13F | Mackenzie Financial Corp | 42 668 | -90,26 | 39 | -94,77 | ||||
| 2026-02-17 | 13F | CWM Advisors, LLC | 523 933 | 91,00 | 475 | 4,40 | ||||
| 2026-02-10 | 13F | Bnp Paribas Arbitrage, Sa | 97 080 | -36,89 | 88 | -65,49 | ||||
| 2026-02-12 | 13F | Commonwealth Equity Services, Llc | 56 578 | -15,07 | 51 | |||||
| 2026-02-17 | 13F | Graham Capital Management, L.P. | 710 185 | 657,73 | 644 | 315,48 | ||||
| 2025-10-17 | 13F | Capricorn Fund Managers Ltd | 0 | -100,00 | 0 | -100,00 | ||||
| 2026-01-09 | 13F | SG Americas Securities, LLC | 121 523 | 119,73 | 0 | |||||
| 2026-02-11 | 13F | Vise Technologies, Inc. | 10 062 | -79,99 | 9 | -89,16 | ||||
| 2026-02-09 | 13F | Hantz Financial Services, Inc. | 6 | 0,00 | 0 | |||||
| 2026-02-17 | 13F | Caption Management, LLC | 0 | -100,00 | 0 | |||||
| 2026-02-17 | 13F | Caption Management, LLC | Put | 0 | -100,00 | 0 | ||||
| 2026-02-26 | 13F/A | Aristides Capital LLC | 197 200 | 179 | ||||||
| 2026-02-17 | 13F | Gallagher Fiduciary Advisors, LLC | 198 721 | 14,00 | 180 | -37,72 | ||||
| 2026-02-13 | 13F | Banco Santander, S.A. | 154 524 | -4,57 | 140 | -47,76 | ||||
| 2025-11-05 | 13F | Moloney Securities Asset Management, LLC | 20 000 | 0,00 | 33 | -2,94 | ||||
| 2026-02-05 | 13F | Sapient Capital Llc | 0 | -100,00 | 0 | |||||
| 2026-02-05 | 13F | Abacus Wealth Partners, LLC | 26 532 | 24 | ||||||
| 2026-02-17 | 13F | Fmr Llc | 34 601 | -98,96 | 31 | -99,44 | ||||
| 2026-02-13 | 13F | Y-Intercept (Hong Kong) Ltd | 0 | -100,00 | 0 | |||||
| 2026-02-10 | 13F | Rothschild Investment Llc | 525 | 17,98 | 0 | |||||
| 2026-01-05 | 13F | Park Avenue Securities Llc | 0 | -100,00 | 0 | |||||
| 2026-02-12 | 13F | Swiss National Bank | 942 900 | 1,75 | 856 | -44,41 | ||||
| 2026-02-13 | 13F | Public Employees Retirement Association Of Colorado | 65 370 | 0,00 | 0 | |||||
| 2026-02-17 | 13F | Two Sigma Securities, Llc | 79 871 | -29,50 | 72 | -61,70 | ||||
| 2026-02-17 | 13F | Adage Capital Partners Gp, L.l.c. | 150 000 | 0,00 | 136 | -45,38 | ||||
| 2026-02-12 | 13F | MetLife Investment Management, LLC | 227 033 | -11,22 | 206 | -51,42 | ||||
| 2026-02-17 | 13F | Atom Investors LP | 231 275 | 210 | ||||||
| 2026-02-17 | 13F | Northern Trust Corp | 3 670 893 | -11,21 | 3 331 | -51,48 | ||||
| 2026-03-09 | 13F/A | CI Private Wealth, LLC | 0 | -100,00 | 0 | -100,00 | ||||
| 2026-02-17 | 13F | Amundi | 78 489 | 71 | ||||||
| 2026-02-12 | 13F | Raiffeisen Bank International AG | 1 000 000 | 0,00 | 908 | -45,69 | ||||
| 2026-01-15 | 13F | Vaughan Nelson Investment Management, L.p. | 4 008 525 | 0,00 | 3 636 | -45,37 | ||||
| 2026-01-30 | 13F | Archer Investment Corp | 100 | 0,00 | 0 | |||||
| 2026-02-13 | 13F | Squarepoint Ops LLC | 629 342 | 60,25 | 571 | -12,29 | ||||
| 2026-02-13 | 13F | Prudential Financial Inc | 29 825 | -52,02 | 27 | -74,76 | ||||
| 2026-02-13 | 13F | American Century Companies Inc | 11 300 711 | -62,80 | 10 254 | -79,66 | ||||
| 2025-11-13 | 13F | Clear Street Markets Llc | 0 | -100,00 | 0 | -100,00 | ||||
| 2026-02-13 | 13F | Barclays Plc | 2 048 284 | -32,46 | 1 859 | -84,80 | ||||
| 2026-02-13 | 13F | Smartleaf Asset Management LLC | 550 | -38,89 | 0 | -100,00 | ||||
| 2026-02-11 | 13F | Los Angeles Capital Management Llc | 2 380 | 4 | ||||||
| 2026-02-13 | 13F | Cloverfields Capital Group, Lp | 271 878 | 0,00 | 247 | -45,45 | ||||
| 2026-02-17 | 13F | Mercer Global Advisors Inc /adv | 173 998 | -1,32 | 158 | -46,23 | ||||
| 2025-11-04 | 13F | Guerra Advisors Inc | 1 | 0 | ||||||
| 2026-01-09 | 13F | Park Place Capital Corp | 0 | -100,00 | 0 | |||||
| 2026-02-13 | 13F | Marshall Wace, Llp | 33 272 | 30 | ||||||
| 2026-02-17 | 13F | Gratia Capital, Llc | Call | 1 500 000 | 0,00 | 1 365 | -45,18 | |||
| 2026-02-13 | 13F | BNP Paribas Asset Management Holding S.A. | 38 856 | -99,42 | 0 | -100,00 | ||||
| 2026-02-12 | 13F | Steward Partners Investment Advisory, Llc | 0 | 0 | ||||||
| 2025-11-07 | 13F/A | Abn Amro Investment Solutions | 545 763 | -15,89 | 4 464 | 14,87 | ||||
| 2026-02-17 | 13F | Aqr Capital Management Llc | 536 322 | 192,91 | 487 | 60,40 | ||||
| 2026-02-17 | 13F | Lazard Asset Management Llc | 81 147 | -96,70 | 74 | -98,21 | ||||
| 2026-02-17 | 13F | Hotchkis & Wiley Capital Management Llc | 20 110 881 | -4,21 | 18 249 | -47,64 | ||||
| 2026-02-24 | 13F | DGS Capital Management, LLC | 33 575 | 4,87 | 30 | -43,40 | ||||
| 2026-02-11 | 13F | Ameritas Investment Partners, Inc. | 39 642 | 36 | ||||||
| 2026-01-30 | 13F | Westhampton Capital, LLC | 25 000 | -10,71 | 23 | -52,17 | ||||
| 2026-02-11 | 13F | J.w. Cole Advisors, Inc. | 11 600 | 11 | ||||||
| 2026-01-27 | 13F | Zurcher Kantonalbank (Zurich Cantonalbank) | 79 598 | 0,00 | 72 | -45,45 | ||||
| 2026-01-14 | 13F | BWM Planning, LLC | 31 898 | 0,00 | 29 | -46,15 | ||||
| 2026-02-13 | 13F | Huber Capital Management LLC | 0 | -100,00 | 0 | |||||
| 2026-02-03 | 13F | Sequoia Financial Advisors, LLC | 0 | -100,00 | 0 | -100,00 | ||||
| 2026-02-12 | 13F | Renaissance Technologies Llc | 1 647 838 | 448,82 | 1 495 | 200,20 | ||||
| 2026-02-26 | 13F/A | Alpine Global Management, LLC | 206 729 | 188 | ||||||
| 2026-04-07 | 13F | Signaturefd, Llc | 23 458 | 25,45 | 65 | 306,25 | ||||
| 2026-01-27 | 13F | Evergreen Capital Management Llc | 0 | -100,00 | 0 | |||||
| 2026-02-13 | 13F | Mariner, LLC | 17 245 | -69,46 | 16 | -83,87 | ||||
| 2026-02-17 | 13F | Public Employees Retirement System Of Ohio | 42 577 | 35,73 | 39 | -26,92 | ||||
| 2026-02-05 | 13F | Mission Wealth Management, Lp | 0 | -100,00 | 0 | |||||
| 2026-02-06 | 13F | Global Retirement Partners, LLC | 350 | 0,00 | 0 | |||||
| 2026-02-17 | 13F | Lombard Odier Asset Management (USA) Corp | Call | 700 000 | 0,00 | 635 | -45,35 | |||
| 2026-01-29 | 13F | Vanguard Group Inc | 14 836 244 | 3,60 | 13 456 | -43,40 | ||||
| 2026-01-29 | 13F | Comerica Bank | 661 | -98,50 | 1 | -100,00 | ||||
| 2026-02-13 | 13F | First Trust Advisors Lp | 7 048 196 | 66,91 | 6 396 | -8,76 | ||||
| 2026-02-13 | 13F | Victory Capital Management Inc | 52 872 | -0,03 | 48 | -45,98 | ||||
| 2026-02-06 | 13F | Covestor Ltd | 53 | -1,85 | 0 | |||||
| 2026-02-13 | 13F | Manufacturers Life Insurance Company, The | 0 | -100,00 | 0 | |||||
| 2026-01-26 | 13F | Cwm, Llc | 2 190 | -83,18 | 0 | |||||
| 2026-02-17 | 13F | Bank Of America Corp /de/ | 3 851 220 | -66,01 | 3 493 | -81,43 | ||||
| 2026-01-28 | 13F | Universal- Beteiligungs- und Servicegesellschaft mbH | 153 669 | 27,90 | 139 | -30,15 | ||||
| 2026-02-06 | 13F | Mraz, Amerine & Associates, Inc. | 11 200 | 0,00 | 10 | -44,44 | ||||
| 2025-11-13 | 13F | Blueshift Asset Management, LLC | 0 | -100,00 | 0 | |||||
| 2026-02-17 | 13F | Elequin Capital Lp | 630 | 1 | ||||||
| 2026-02-17 | 13F | California State Teachers Retirement System | 435 939 | -0,10 | 396 | -45,44 | ||||
| 2026-02-17 | 13F | Point72 Asset Management, L.P. | 621 106 | 564 | ||||||
| 2026-02-13 | 13F | JustInvest LLC | 16 137 | -40,27 | 15 | -68,18 | ||||
| 2026-01-13 | 13F | Fort Washington Investment Advisors Inc /oh/ | 0 | -100,00 | 0 | -100,00 | ||||
| 2026-02-02 | 13F | Principal Financial Group Inc | 20 419 | -38,23 | 19 | -66,67 | ||||
| 2026-02-13 | 13F | Quarry LP | 276 | 0 | ||||||
| 2026-02-13 | 13F | Police & Firemen's Retirement System of New Jersey | 130 933 | 0,00 | 119 | -45,62 | ||||
| 2026-04-08 | 13F | Wealth Enhancement Advisory Services, Llc | 40 945 | 146,46 | 120 | 643,75 | ||||
| 2026-02-09 | 13F | Coldstream Capital Management Inc | 28 082 | -57,38 | 25 | -77,06 | ||||
| 2026-02-05 | 13F | Thrivent Financial For Lutherans | 0 | -100,00 | 0 | |||||
| 2026-02-13 | 13F | Sei Investments Co | 857 578 | 204,15 | 778 | 66,24 | ||||
| 2026-02-13 | 13F | Great West Life Assurance Co /can/ | 46 757 | 0,00 | 0 | |||||
| 2026-02-17 | 13F | Two Sigma Investments, Lp | 3 855 467 | 123,46 | 3 498 | 22,14 | ||||
| 2026-02-11 | 13F | Deutsche Bank Ag\ | 360 094 | -0,65 | 328 | -45,59 | ||||
| 2026-02-17 | 13F | Advisory Services Network, LLC | 0 | -100,00 | 0 | |||||
| 2026-02-13 | 13F | Rhumbline Advisers | 612 964 | -13,44 | 556 | -52,77 | ||||
| 2026-02-13 | 13F | Morgan Stanley | 4 709 209 | -24,66 | 4 273 | -58,82 | ||||
| 2026-01-28 | 13F | Teacher Retirement System Of Texas | 15 782 | -74,78 | 14 | -86,41 | ||||
| 2025-11-14 | 13F | Peak6 Llc | 0 | -100,00 | 0 | |||||
| 2026-02-13 | 13F | Verition Fund Management LLC | 503 520 | -14,20 | 457 | -53,18 | ||||
| 2026-02-13 | 13F | Gts Securities Llc | 27 114 | -76,90 | 25 | -87,63 | ||||
| 2026-02-17 | 13F | Quantinno Capital Management LP | 0 | -100,00 | 0 | |||||
| 2026-02-12 | 13F | Marex Group plc | 22 501 | -79,01 | 20 | -88,70 | ||||
| 2026-02-17 | 13F | Optiver Holding B.V. | 777 | 1 263,16 | 1 | |||||
| 2025-11-10 | 13F | Oppenheimer & Close, LLC | 0 | -100,00 | 0 | |||||
| 2026-01-14 | 13F | Verum Partners LLC | 0 | -100,00 | 0 | |||||
| 2026-02-17 | 13F | Blair William & Co/il | 100 000 | 0,00 | 91 | -45,78 | ||||
| 2026-02-11 | 13F | Parallel Advisors, LLC | 12 237 | -50,32 | 11 | -72,50 | ||||
| 2026-02-13 | 13F | Nantahala Capital Management, LLC | 2 344 194 | 36,56 | 2 127 | -25,34 | ||||
| 2026-02-17 | 13F | Royal Bank Of Canada | 26 249 | -55,45 | 23 | -76,53 | ||||
| 2026-02-17 | 13F | Alliancebernstein L.p. | 511 360 | 0,99 | 464 | -44,76 | ||||
| 2026-02-17 | 13F | Citadel Advisors Llc | Put | 736 300 | 48,87 | 668 | -18,64 | |||
| 2025-11-14 | 13F | Peak6 Llc | Put | 0 | -100,00 | 0 | ||||
| 2026-02-06 | 13F | EverSource Wealth Advisors, LLC | 0 | -100,00 | 0 | |||||
| 2026-02-09 | 13F | Ballast Asset Management, LP | 1 820 744 | 17,39 | 1 652 | -35,82 | ||||
| 2026-04-06 | 13F | GAMMA Investing LLC | 4 943 | 38,11 | 14 | 333,33 | ||||
| 2026-02-10 | 13F | Envestnet Asset Management Inc | 0 | -100,00 | 0 | |||||
| 2026-02-17 | 13F | Citadel Advisors Llc | Call | 292 400 | -19,36 | 265 | -55,91 | |||
| 2026-02-06 | 13F | Pnc Financial Services Group, Inc. | 34 | -99,93 | 0 | -100,00 | ||||
| 2026-02-17 | 13F | Citadel Advisors Llc | 5 556 252 | -16,14 | 5 042 | -54,16 | ||||
| 2025-11-14 | 13F | Advisor Group Holdings, Inc. | Call | 0 | -100,00 | 0 | ||||
| 2026-01-12 | 13F | Foster Group, Inc. | 0 | -100,00 | 0 | |||||
| 2026-02-10 | 13F | State of Wyoming | 8 496 | 31,72 | 8 | -30,00 | ||||
| 2026-02-06 | 13F | VSM Wealth Advisory, LLC | 5 000 | 2 073,91 | 5 | -20,00 | ||||
| 2026-02-17 | 13F | Voleon Capital Management Lp | 0 | -100,00 | 0 | |||||
| 2026-02-13 | 13F | Van Eck Associates Corp | 0 | -100,00 | 0 | |||||
| 2025-10-27 | 13F | Rwc Asset Advisors (us) Llc | 0 | -100,00 | 0 | -100,00 | ||||
| 2026-02-12 | 13F | Principal Securities, Inc. | 0 | -100,00 | 0 | -100,00 | ||||
| 2025-11-10 | 13F | Axq Capital, Lp | 0 | -100,00 | 0 | |||||
| 2025-11-14 | 13F | National Bank Of Canada /fi/ | 0 | -100,00 | 0 | |||||
| 2026-02-12 | 13F | Dimensional Fund Advisors Lp | 5 878 286 | -22,77 | 5 334 | -57,79 | ||||
| 2026-02-13 | 13F | Patient Capital Management, LLC | 0 | -100,00 | 0 | |||||
| 2025-10-29 | 13F | Inscription Capital, LLC | Call | 0 | -100,00 | 0 | ||||
| 2026-02-17 | 13F | D. E. Shaw & Co., Inc. | 5 965 703 | 210,49 | 5 413 | 69,74 | ||||
| 2026-02-03 | 13F | SBI Securities Co., Ltd. | 1 406 | -28,63 | 1 | -66,67 | ||||
| 2026-02-17 | 13F | Brevan Howard Capital Management LP | 145 695 | -2,50 | 132 | -46,77 | ||||
| 2026-03-26 | 13F | Leonteq Securities AG | 0 | -100,00 | 0 | -100,00 | ||||
| 2026-02-12 | 13F | Cibc World Markets Corp | 31 391 | -46,31 | 28 | -72,00 | ||||
| 2026-02-05 | 13F | Amalgamated Bank | 14 907 | -7,36 | 0 | |||||
| 2026-02-10 | 13F | CIBC Asset Management Inc | 15 264 | 0,00 | 14 | -48,00 | ||||
| 2026-02-02 | 13F | Robertson Stephens Wealth Management, LLC | 27 000 | 0,00 | 24 | -45,45 | ||||
| 2026-02-03 | 13F | Ethic Inc. | 314 160 | 38,59 | 285 | -24,20 | ||||
| 2026-02-05 | 13F | Allworth Financial LP | 7 267 | -3,26 | 7 | -50,00 | ||||
| 2026-02-12 | 13F | Nuveen, LLC | 1 358 080 | 0,00 | 1 232 | -45,34 | ||||
| 2026-02-17 | 13F | Susquehanna International Group, Llp | Call | 259 200 | 24,44 | 236 | -31,88 | |||
| 2026-02-17 | 13F | Susquehanna International Group, Llp | 2 456 451 | 20,99 | 2 229 | -33,89 | ||||
| 2026-02-02 | 13F | Strs Ohio | 52 800 | 0,00 | 48 | -45,98 | ||||
| 2026-02-09 | 13F | Sawgrass Asset Management Llc | 25 824 | 99,04 | 23 | 9,52 | ||||
| 2026-02-12 | 13F | Voya Investment Management Llc | 88 707 | 0,00 | 80 | -45,58 | ||||
| 2026-02-17 | 13F | Susquehanna International Group, Llp | Put | 583 600 | -46,30 | 531 | -70,55 | |||
| 2025-11-13 | 13F | Hsbc Holdings Plc | 0 | -100,00 | 0 | -100,00 | ||||
| 2026-02-17 | 13F | Grantham, Mayo, Van Otterloo & Co. LLC | 34 804 317 | 0,07 | 31 581 | -45,30 | ||||
| 2026-01-29 | 13F | IMC-Chicago, LLC | 319 951 | -41,06 | 290 | -67,81 | ||||
| 2026-01-15 | 13F | J. Safra Sarasin Holding AG | 0 | -100,00 | 0 | |||||
| 2026-01-29 | 13F | IMC-Chicago, LLC | Put | 396 600 | -36,24 | 360 | -65,21 | |||
| 2026-02-12 | 13F | State Board Of Administration Of Florida Retirement System | 130 370 | 0,00 | 118 | -45,37 | ||||
| 2026-02-17 | 13F | Creative Planning | 302 567 | -52,98 | 275 | -74,34 | ||||
| 2026-01-29 | 13F | IMC-Chicago, LLC | Call | 302 900 | 41,41 | 275 | -22,82 | |||
| 2026-02-18 | 13F | GWM Advisors LLC | 400 | 0,00 | 0 | |||||
| 2025-11-14 | 13F | Wolverine Trading, Llc | 379 551 | 46,95 | 634 | 34,11 | ||||
| 2025-11-14 | 13F | Wolverine Trading, Llc | Call | 88 600 | 49,66 | 148 | 36,11 | |||
| 2025-11-14 | 13F | Wolverine Trading, Llc | Put | 465 800 | 7,35 | 778 | -2,14 | |||
| 2026-01-30 | 13F | R Squared Ltd | 17 195 | 16 | ||||||
| 2026-02-12 | 13F | Xponance, Inc. | 36 681 | -1,25 | 33 | -45,90 | ||||
| 2026-02-17 | 13F | Mason Hill Advisors Llc | 19 469 980 | 9,50 | 17 667 | -40,14 | ||||
| 2026-01-29 | 13F | UBS Group AG | 6 138 033 | -16,21 | 5 567 | -54,22 | ||||
| 2026-02-17 | 13F | Russell Investments Group, Ltd. | 5 885 653 | -5,67 | 5 341 | -48,44 | ||||
| 2026-02-13 | 13F | Charles Schwab Investment Management Inc | 12 045 593 | 19,47 | 10 930 | -34,70 | ||||
| 2026-01-23 | 13F | Transcend Wealth Collective, Llc | 0 | -100,00 | 0 | |||||
| 2026-02-13 | 13F | Ubs Asset Management Americas Inc | 3 893 350 | 8,88 | 3 531 | -40,51 | ||||
| 2026-02-13 | 13F | Stifel Financial Corp | 247 649 | -24,41 | 225 | -58,75 | ||||
| 2026-01-26 | 13F | Fruth Investment Management | 32 000 | 0,00 | 0 | |||||
| 2025-10-27 | 13F | RWC Asset Management LLP | 0 | -100,00 | 0 | -100,00 | ||||
| 2026-02-17 | 13F | Numerai GP LLC | 76 556 | 69 | ||||||
| 2026-01-20 | 13F | American National Bank | 174 | 0 |