Podstawowe statystyki
| Akcje instytucjonalne (długie) | 56 413 980 - 95,67% (ex 13D/G) - change of -13,23MM shares -18,99% MRQ |
| Wartość instytucjonalna (długa) | $ 1 666 234 USD ($1000) |
Własność instytucjonalna i akcjonariusze
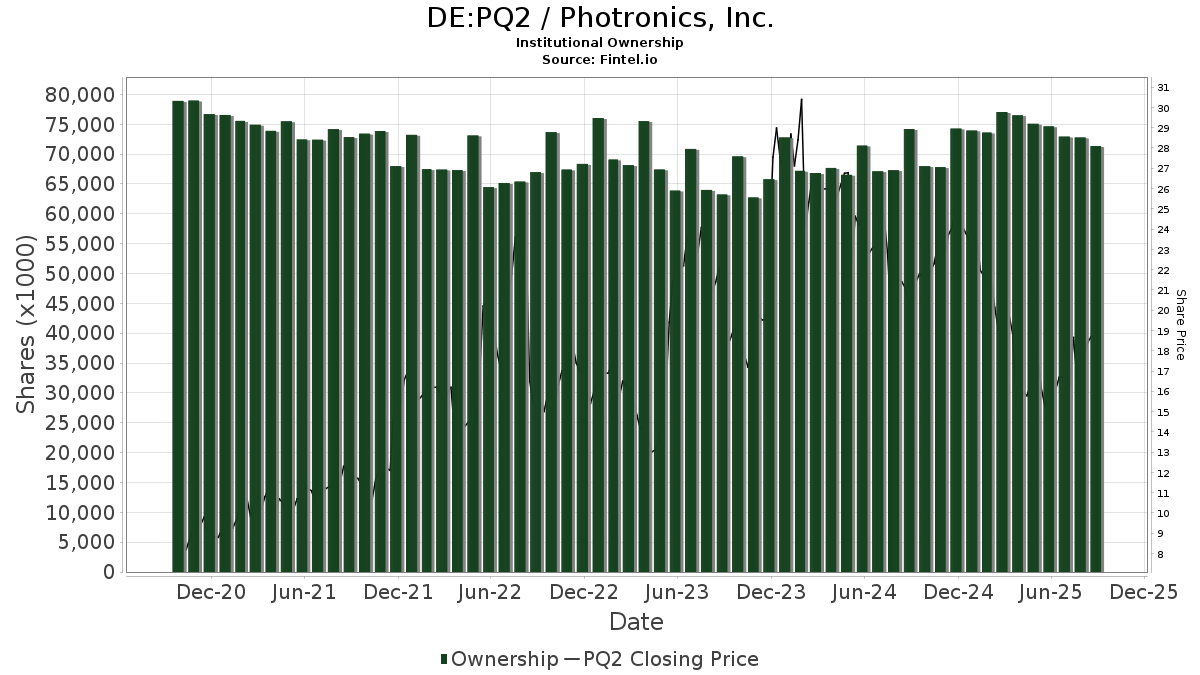
Photronics, Inc. (DE:PQ2) posiada 315 właściciele instytucjonalni i akcjonariusze, którzy złożyli formularze 13D/G lub 13F w Komisji Papierów Wartościowych (SEC). Instytucje te posiadają łącznie 56,413,980 akcji. Do największych akcjonariuszy należą BlackRock, Inc., Vanguard Group Inc, Dimensional Fund Advisors Lp, Lsv Asset Management, American Century Companies Inc, State Street Corp, Victory Capital Management Inc, Geode Capital Management, Llc, Invesco Ltd., and Morgan Stanley .
Photronics, Inc. (DB:PQ2) instytucjonalna struktura własności pokazuje aktualne pozycje w firmie według instytucji i funduszy, a także najnowsze zmiany w wielkości stanowisk. Głównymi akcjonariuszami mogą być inwestorzy indywidualni, fundusze inwestycyjne, fundusze hedgingowe lub instytucje. Załącznik 13D wskazuje, że inwestor posiada (lub posiadał) więcej niż 5% udziałów w spółce i zamierza (lub zamierzał) aktywnie dążyć do zmiany strategii biznesowej. Załącznik 13G wskazuje na inwestycję pasywną na poziomie ponad 5%.
The share price as of April 28, 2026 is 42,00 / share. Previously, on April 29, 2025, the share price was 15,98 / share. This represents an increase of 162,75% over that period.
Ocena sentymentu funduszu
Wskaźnik sentymentu funduszu (fka Ownership Accumulation Score) pozwala określić akcje, które są najczęściej kupowane przez fundusze. Jest to wynik zaawansowanego, wieloczynnikowego modelu ilościowego, który identyfikuje spółki o najwyższym poziomie akumulacji instytucjonalnej. Model oceny wykorzystuje kombinację całkowitego wzrostu liczby ujawnionych właścicieli, zmian w alokacji portfela wśród tych właścicieli i innych wskaźników. Liczba waha się od 0 do 100, przy czym wyższe liczby wskazują na wyższy poziom akumulacji w stosunku do innych spółek, a 50 oznacza średnią.
Częstotliwość aktualizacji: codziennie
Sprawdź Ownership Explorer, który zawiera listę firm o najwyższym rankingu.
AI+ Ask Fintel’s AI assistant about Photronics, Inc..
Select a question to share a public post with an AI-crafted answer.
Thinking of good questions…
Zgłoszenia 13F i NPORT
Szczegółowe dane dotyczące zgłoszeń 13F są bezpłatne. Szczegółowe dane dotyczące zgłoszeń NP wymagają członkostwa premium. Zielone rzędy wskazują nowe pozycje. Czerwone rzędy wskazują pozycje zamknięte. Kliknij w ikonę linku, aby zobaczyć pełną historię transakcji.
Aktualizacja
aby odblokować dane premium i eksportować do Excela ![]() .
.
| Data pliku | Źródło | Inwestor | Typ | Średnia cena (Est) |
Akcje | Akcje; Δ (%) |
Zgłoszono Wartość ($1000) |
Wartość; Δ (%) |
Przydział portu (%) |
|
|---|---|---|---|---|---|---|---|---|---|---|
| 2026-02-10 | 13F/A | Northwestern Mutual Wealth Management Co | 81 | 0,00 | 3 | 100,00 | ||||
| 2026-02-09 | 13F | Jefferies Financial Group Inc. | Put | 0 | -100,00 | 0 | -100,00 | |||
| 2026-02-09 | 13F | Quest Partners LLC | 1 663 | -96,68 | 53 | -95,38 | ||||
| 2026-02-17 | 13F | IHT Wealth Management, LLC | 0 | -100,00 | 0 | |||||
| 2026-02-17 | 13F | Cresset Asset Management, LLC | 89 165 | 0,64 | 2 853 | 40,33 | ||||
| 2026-02-12 | 13F | Principal Securities, Inc. | 0 | -100,00 | 0 | |||||
| 2026-02-09 | 13F | Illumine Investment Management, LLC | 34 942 | 1,23 | 1 118 | 41,16 | ||||
| 2026-02-10 | 13F | Easterly Investment Partners Llc | 422 671 | -6,31 | 13 525 | 30,64 | ||||
| 2026-02-10 | 13F | Commonwealth Of Pennsylvania Public School Empls Retrmt Sys | 14 608 | -4,64 | 467 | 33,05 | ||||
| 2026-02-09 | 13F | Huntington National Bank | 1 | 0,00 | 0 | |||||
| 2026-02-03 | 13F/A | Bank Of America Corp /de/ | Put | 0 | -100,00 | 0 | -100,00 | |||
| 2026-02-04 | 13F | Atlantic Union Bankshares Corp | 0 | -100,00 | 0 | |||||
| 2026-04-15 | 13F | Exchange Traded Concepts, Llc | 6 336 | -90,15 | 256 | -87,56 | ||||
| 2026-02-17 | 13F | California State Teachers Retirement System | 56 147 | 5,59 | 1 797 | 47,21 | ||||
| 2026-02-11 | 13F | Cedar Mountain Advisors, LLC | 10 | 0 | ||||||
| 2026-02-17 | 13F | Optiver Holding B.V. | 54 | -86,70 | 2 | -88,89 | ||||
| 2026-04-27 | 13F | New York State Teachers Retirement System | 27 806 | 15,61 | 1 | |||||
| 2026-04-17 | 13F | Vermillion Wealth Management, Inc. | 0 | -100,00 | 0 | |||||
| 2026-02-13 | 13F | Centiva Capital, LP | 8 878 | 284 | ||||||
| 2026-01-29 | 13F | Vanguard Group Inc | 5 670 667 | -1,89 | 181 461 | 36,80 | ||||
| 2026-04-24 | 13F | Profund Advisors Llc | 0 | -100,00 | 0 | |||||
| 2026-03-12 | 13F/A | Peak6 Llc | 0 | -100,00 | 0 | -100,00 | ||||
| 2026-02-09 | 13F | New Age Alpha Advisors, LLC | 84 825 | 17,69 | 2 714 | 64,09 | ||||
| 2026-04-22 | 13F | Janney Montgomery Scott LLC | 5 241 | -73,55 | 0 | |||||
| 2026-02-13 | 13F | Walleye Trading LLC | Call | 28 300 | 185,86 | 906 | 298,68 | |||
| 2026-01-15 | 13F | Allspring Global Investments Holdings, LLC | 17 176 | 25,98 | 574 | 83,65 | ||||
| 2026-02-13 | 13F | Walleye Trading LLC | 353 029 | 11 297 | ||||||
| 2026-04-10 | 13F | Linden Thomas Advisory Services, LLC | 77 680 | 0,56 | 3 139 | 27,03 | ||||
| 2026-02-13 | 13F | Walleye Trading LLC | Put | 1 700 | 54 | |||||
| 2026-02-13 | 13F | Rhumbline Advisers | 163 381 | -6,24 | 5 228 | 30,77 | ||||
| 2025-11-21 | 13F | Nebula Research & Development LLC | 0 | -100,00 | 0 | |||||
| 2026-04-17 | 13F | Brown, Lisle/cummings, Inc. | 27 | 1 | ||||||
| 2026-01-29 | 13F | Sanctuary Advisors, LLC | 0 | -100,00 | 0 | -100,00 | ||||
| 2026-02-03 | 13F | Denali Advisors Llc | 313 404 | 33,23 | 10 029 | 85,77 | ||||
| 2026-02-17 | 13F/A | Kovack Advisors, Inc. | 22 595 | -26,46 | 723 | 2,55 | ||||
| 2026-02-11 | 13F | Parallel Advisors, LLC | 917 | -17,39 | 29 | 16,00 | ||||
| 2026-02-10 | 13F | Rothschild Investment Llc | 129 | 186,67 | 4 | 300,00 | ||||
| 2026-02-13 | 13F | Sei Investments Co | 60 005 | -6,02 | 1 920 | 31,06 | ||||
| 2026-04-22 | 13F | Pictet Asset Management Holding SA | 9 290 | 0,00 | 375 | 26,26 | ||||
| 2026-02-11 | 13F | Meeder Asset Management Inc | 281 377 | -18,93 | 9 004 | 13,04 | ||||
| 2026-02-13 | 13F | Walleye Capital LLC | Call | 19 300 | 618 | |||||
| 2026-02-11 | 13F | Rise Advisors, LLC | 0 | -100,00 | 0 | |||||
| 2026-01-29 | 13F | IMC-Chicago, LLC | Put | 0 | -100,00 | 0 | -100,00 | |||
| 2026-02-17 | 13F | Two Sigma Investments, Lp | 78 137 | 529,33 | 2 500 | 780,28 | ||||
| 2026-02-18 | 13F/A | Fuller & Thaler Asset Management, Inc. | 12 199 | 390 | ||||||
| 2026-02-12 | 13F | Voya Investment Management Llc | 156 057 | -12,74 | 4 994 | 21,66 | ||||
| 2026-02-17 | 13F | Boothbay Fund Management, Llc | 10 324 | 330 | ||||||
| 2026-02-10 | 13F | Bruce G. Allen Investments, LLC | 26 | 18,18 | 1 | |||||
| 2026-04-20 | 13F | Louisiana State Employees Retirement System | 26 200 | -2,96 | 1 059 | 22,45 | ||||
| 2026-02-17 | 13F | Cetera Investment Advisers | 17 889 | 18,11 | 572 | 64,84 | ||||
| 2026-02-11 | 13F | Group One Trading, L.p. | Put | 9 800 | 600,00 | 314 | 878,13 | |||
| 2026-02-17 | 13F | Public Employees Retirement System Of Ohio | 1 595 | 1,53 | 51 | 41,67 | ||||
| 2026-04-23 | 13F | SJS Investment Consulting Inc. | 43 | 115,00 | 2 | |||||
| 2026-02-11 | 13F | Group One Trading, L.p. | Call | 76 300 | 2 442 | |||||
| 2026-01-22 | 13F | Massachusetts Financial Services Co /ma/ | 84 765 | -12,22 | 2 712 | 22,38 | ||||
| 2026-02-17 | 13F/A | Sentinus, LLC | 46 300 | 1 482 | ||||||
| 2026-02-13 | 13F | Public Sector Pension Investment Board | 0 | -100,00 | 0 | |||||
| 2026-02-13 | 13F | Victory Capital Management Inc | 2 142 591 | -7,07 | 68 563 | 29,57 | ||||
| 2026-02-04 | 13F | Ameritas Advisory Services, LLC | 7 659 | 7 559,00 | 245 | 12 150,00 | ||||
| 2026-02-12 | 13F | Hohimer Wealth Management, Llc | 0 | -100,00 | 0 | |||||
| 2026-04-29 | 13F | Skopos Labs, Inc. | 8 271 | 334 | ||||||
| 2026-02-06 | 13F | EverSource Wealth Advisors, LLC | 377 | 13,21 | 12 | 71,43 | ||||
| 2026-02-17 | 13F | Qube Research & Technologies Ltd | 288 701 | 23,64 | 9 238 | 72,42 | ||||
| 2026-02-12 | 13F | Campbell & CO Investment Adviser LLC | 40 863 | 1 308 | ||||||
| 2026-02-12 | 13F | BlackRock, Inc. | 8 827 652 | 0,40 | 282 485 | 40,00 | ||||
| 2026-02-10 | 13F | Thompson Siegel & Walmsley Llc | 170 230 | -1,74 | 5 | 66,67 | ||||
| 2026-02-11 | 13F | Clearbridge Investments, LLC | 166 361 | -61,41 | 5 324 | -46,19 | ||||
| 2026-02-17 | 13F | Creative Planning | 47 165 | 82,53 | 1 509 | 154,47 | ||||
| 2026-03-12 | 13F/A | Peak6 Llc | Put | 42 700 | 88,11 | 1 366 | 162,69 | |||
| 2026-03-12 | 13F/A | Peak6 Llc | Call | 258 900 | 9 857,69 | 8 285 | 13 940,68 | |||
| 2026-02-11 | 13F | Allianz Asset Management GmbH | 117 954 | 0,00 | 3 775 | 39,42 | ||||
| 2026-02-14 | 13F | Rockefeller Capital Management L.P. | 579 | 115,24 | 19 | 200,00 | ||||
| 2026-02-17 | 13F | Weiss Asset Management LP | 28 626 | 10,41 | 916 | 53,95 | ||||
| 2026-04-21 | 13F | Penbrook Management LLC | 96 730 | -12,60 | 3 909 | 10,36 | ||||
| 2026-02-17 | 13F | Nomura Holdings Inc | 0 | -100,00 | 0 | -100,00 | ||||
| 2026-02-12 | 13F | Grey Fox Wealth Advisors, LLC | 0 | -100,00 | 0 | |||||
| 2026-02-13 | 13F | Morgan Stanley | 1 408 220 | 11,09 | 45 063 | 54,90 | ||||
| 2026-02-09 | 13F | Atlantic Trust, LLC | 0 | -100,00 | 0 | |||||
| 2026-04-28 | 13F | K.J. Harrison & Partners Inc | 30 000 | 0,00 | 1 212 | 26,25 | ||||
| 2025-10-30 | 13F | Twin Peaks Wealth Advisors, LLC | 0 | -100,00 | 0 | |||||
| 2025-11-14 | 13F | Texas Permanent School Fund | 0 | -100,00 | 0 | -100,00 | ||||
| 2026-02-17 | 13F | Algert Global Llc | 77 360 | 2 | ||||||
| 2026-02-06 | 13F | Lsv Asset Management | 2 883 463 | 14,74 | 92 | 61,40 | ||||
| 2026-02-10 | 13F | Bnp Paribas Arbitrage, Sa | 21 364 | 1,12 | 684 | 41,12 | ||||
| 2025-11-14 | 13F | Wolverine Trading, Llc | Call | 24 100 | -4,74 | 555 | 17,09 | |||
| 2025-11-14 | 13F | Wolverine Trading, Llc | Put | 12 600 | -51,54 | 290 | -40,45 | |||
| 2026-02-13 | 13F | Citigroup Inc | 203 143 | -9,80 | 6 501 | 25,77 | ||||
| 2026-02-11 | 13F | Cerity Partners LLC | 19 738 | 104,60 | 632 | 185,52 | ||||
| 2026-02-05 | 13F | Isthmus Partners, Llc | 84 120 | 221,55 | 2 692 | 348,50 | ||||
| 2026-02-06 | 13F | FourThought Financial Partners, LLC | 0 | -100,00 | 0 | |||||
| 2026-02-17 | 13F | Jump Financial, LLC | 9 100 | 291 | ||||||
| 2026-02-06 | 13F | Pnc Financial Services Group, Inc. | 7 020 | 0,72 | 225 | 40,88 | ||||
| 2026-04-13 | 13F | Wedge Capital Management L L P/nc | 76 083 | -6,88 | 3 075 | 17,60 | ||||
| 2026-02-09 | 13F | Royce & Associates Lp | 384 360 | -0,15 | 12 300 | 39,22 | ||||
| 2026-02-11 | 13F | LPL Financial LLC | 52 838 | 43,08 | 1 691 | 99,53 | ||||
| 2026-02-13 | 13F | Kilter Group LLC | 35 | 0,00 | 1 | |||||
| 2025-11-03 | 13F | Federated Hermes, Inc. | 0 | -100,00 | 0 | |||||
| 2025-11-21 | 13F | Bell Investment Advisors, Inc | 0 | -100,00 | 0 | |||||
| 2026-04-24 | 13F | Kendall Capital Management | 45 772 | -1,32 | 1 850 | 24,60 | ||||
| 2026-02-10 | 13F | Goldman Sachs Group Inc | 451 265 | -1,56 | 14 440 | 37,25 | ||||
| 2025-11-12 | 13F | Transce3nd, LLC | 0 | -100,00 | 0 | |||||
| 2026-02-11 | 13F | Vestcor Inc | 4 658 | 0,00 | 0 | |||||
| 2026-04-27 | 13F | Nvwm, Llc | 0 | -100,00 | 0 | |||||
| 2026-02-06 | 13F | HighTower Advisors, LLC | 8 711 | 279 | ||||||
| 2026-02-13 | 13F | Verition Fund Management LLC | 51 299 | -4,58 | 1 642 | 33,09 | ||||
| 2026-02-11 | 13F | Group One Trading, L.p. | 0 | -100,00 | 0 | -100,00 | ||||
| 2026-04-17 | 13F | AdvisorNet Financial, Inc | 194 | 0,00 | 8 | 16,67 | ||||
| 2025-11-13 | 13F | Goodman Advisory Group, LLC | 0 | -100,00 | 0 | |||||
| 2026-02-11 | 13F | Winton Capital Group Ltd | 39 028 | -32,70 | 1 249 | -6,17 | ||||
| 2026-02-13 | 13F | Pinnacle Wealth Planning Services, Inc. | 1 874 | 60 | ||||||
| 2026-02-17 | 13F | Advisor Group Holdings, Inc. | 8 431 | -7,47 | 270 | 30,58 | ||||
| 2026-04-21 | 13F | Decker Retirement Planning Inc. | 97 385 | 3 935 | ||||||
| 2026-02-11 | 13F | Empowered Funds, LLC | 285 602 | 1,00 | 9 139 | 40,84 | ||||
| 2026-02-13 | 13F | Bridgefront Capital, LLC | 19 610 | 628 | ||||||
| 2026-01-29 | 13F | Teachers Retirement System Of The State Of Kentucky | 15 121 | -16,19 | 0 | |||||
| 2026-02-17 | 13F | Tower Research Capital LLC (TRC) | 9 087 | 157,93 | 291 | 262,50 | ||||
| 2026-04-24 | 13F | Keybank National Association/oh | 13 993 | -14,69 | 565 | 7,82 | ||||
| 2026-02-06 | 13F | Cullen/frost Bankers, Inc. | 283 | 9 | ||||||
| 2026-02-12 | 13F | Renaissance Technologies Llc | 119 748 | -48,45 | 3 832 | -28,14 | ||||
| 2026-02-17 | 13F | Cambria Investment Management, L.P. | 241 079 | 7 715 | ||||||
| 2026-02-06 | 13F | Larson Financial Group LLC | 348 | -71,50 | 11 | -60,71 | ||||
| 2025-11-06 | 13F | Blume Capital Management, Inc. | 0 | -100,00 | 0 | |||||
| 2026-02-10 | 13F | Bank of New York Mellon Corp | 389 311 | -3,46 | 12 458 | 34,61 | ||||
| 2026-02-12 | 13F | Federation des caisses Desjardins du Quebec | 300 | 0,00 | 10 | 50,00 | ||||
| 2026-02-12 | 13F | Aviva Plc | 19 471 | -4,70 | 623 | 33,12 | ||||
| 2026-04-24 | 13F | Strs Ohio | 24 800 | -1,59 | 1 002 | 24,32 | ||||
| 2026-02-06 | 13F | Covestor Ltd | 403 | -7,57 | 0 | |||||
| 2026-02-06 | 13F | Gsa Capital Partners Llp | 17 181 | 1 | ||||||
| 2026-02-12 | 13F | Swiss National Bank | 116 600 | 0,00 | 3 731 | 39,48 | ||||
| 2026-04-13 | 13F | IFP Advisors, Inc | 401 | -4,30 | 16 | 23,08 | ||||
| 2026-02-03 | 13F | Bokf, Na | 31 278 | -3,90 | 1 001 | 34,05 | ||||
| 2026-02-17 | 13F | Tcw Group Inc | 316 720 | 30,01 | 10 135 | 81,27 | ||||
| 2026-02-09 | 13F | Geode Capital Management, Llc | 1 829 534 | -0,77 | 58 553 | 38,36 | ||||
| 2026-02-13 | 13F | SRS Capital Advisors, Inc. | 231 | -86,03 | 7 | -81,08 | ||||
| 2026-02-13 | 13F | Kestra Advisory Services, LLC | 2 088 | 67 | ||||||
| 2025-11-14 | 13F | Petrus Trust Company, LTA | 0 | -100,00 | 0 | |||||
| 2026-04-13 | 13F | Massmutual Trust Co Fsb/adv | 425 | 1,43 | 17 | 30,77 | ||||
| 2025-11-14 | 13F | Gotham Asset Management, LLC | 0 | -100,00 | 0 | |||||
| 2026-02-13 | 13F | Prudential Financial Inc | 120 258 | 14,90 | 3 848 | 60,20 | ||||
| 2026-02-17 | 13F | Susquehanna International Group, Llp | 0 | -100,00 | 0 | -100,00 | ||||
| 2026-02-17 | 13F | Ameriprise Financial Inc | 173 056 | -20,29 | 5 538 | 11,16 | ||||
| 2026-02-09 | 13F | Investors Portfolio Services LLC | 60 | 2 | ||||||
| 2026-02-02 | 13F | Fifth Third Bancorp | 579 | 6,83 | 19 | 50,00 | ||||
| 2026-04-29 | 13F | Klp Kapitalforvaltning As | 13 100 | -41,52 | 529 | -26,12 | ||||
| 2026-02-11 | 13F | Brandywine Global Investment Management, LLC | 0 | -100,00 | 0 | |||||
| 2026-04-23 | 13F | Kohmann Bosshard Financial Services, LLC | 585 | 24 | ||||||
| 2026-04-27 | 13F | Sound Income Strategies, LLC | 178 | 128,21 | 7 | 250,00 | ||||
| 2026-02-06 | 13F | Legato Capital Management LLC | 7 485 | -76,46 | 240 | -67,22 | ||||
| 2026-04-24 | 13F | Root Financial Partners, LLC | 26 | 2 500,00 | 1 | |||||
| 2026-01-29 | 13F | UBS Group AG | 143 406 | -55,50 | 4 589 | -37,97 | ||||
| 2026-02-13 | 13F | FirstWave Capital Management LLC | 35 503 | 1 136 | ||||||
| 2026-02-13 | 13F | Caitong International Asset Management Co., Ltd | 1 499 | 243,81 | 48 | 370,00 | ||||
| 2026-03-09 | 13F | EMC Capital Management | 8 198 | -15,00 | 0 | |||||
| 2026-02-17 | 13F | Delaware Management Holdings, Inc. | 82 767 | 2 649 | ||||||
| 2026-02-06 | 13F | Global Retirement Partners, LLC | 1 417 | 723,84 | 45 | 1 400,00 | ||||
| 2026-02-12 | 13F | Triumph Capital Management | 1 | 0,00 | 0 | |||||
| 2026-04-22 | 13F | Oak Harvest Investment Services | 50 000 | 66,67 | 2 020 | 110,42 | ||||
| 2026-02-13 | 13F | Charles Schwab Investment Management Inc | 1 023 766 | 3,39 | 32 761 | 44,16 | ||||
| 2026-01-27 | 13F | Zurcher Kantonalbank (Zurich Cantonalbank) | 11 477 | 0,00 | 367 | 39,54 | ||||
| 2026-01-28 | 13F | WPG Advisers, LLC | 113 | 0,00 | 4 | 50,00 | ||||
| 2026-04-07 | 13F | Central Pacific Bank - Trust Division | 0 | -100,00 | 0 | |||||
| 2026-02-26 | 13F | TD Capital Management LLC | 13 | 0,00 | 0 | |||||
| 2025-10-30 | 13F | Teacher Retirement System Of Texas | 0 | -100,00 | 0 | -100,00 | ||||
| 2026-02-19 | 13F | Invesco Ltd. | 1 536 374 | 395,95 | 49 164 | 591,56 | ||||
| 2026-02-13 | 13F | Dynamic Technology Lab Private Ltd | 25 170 | 46,94 | 805 | 104,83 | ||||
| 2026-02-17 | 13F | Price T Rowe Associates Inc /md/ | 917 420 | -11,77 | 29 | 26,09 | ||||
| 2026-02-04 | 13F | Oregon Public Employees Retirement Fund | 13 473 | -0,74 | 431 | 38,59 | ||||
| 2026-02-11 | 13F | Los Angeles Capital Management Llc | 241 | 6 | ||||||
| 2026-02-12 | 13F | Hrt Financial Lp | 0 | -100,00 | 0 | -100,00 | ||||
| 2026-04-21 | 13F | One Wealth Advisors, LLC | 6 067 | -27,34 | 245 | -8,24 | ||||
| 2026-02-12 | 13F | New York State Common Retirement Fund | 112 835 | -3,26 | 3 611 | 34,90 | ||||
| 2026-02-13 | 13F | Truvestments Capital Llc | 7 013 | -13,22 | 224 | 21,08 | ||||
| 2026-01-27 | 13F | WealthCollab, LLC | 41 | 0,00 | 1 | |||||
| 2026-02-17 | 13F | Citadel Advisors Llc | Call | 51 700 | -43,25 | 1 654 | -20,86 | |||
| 2026-02-17 | 13F | Citadel Advisors Llc | 443 914 | 75,75 | 14 205 | 145,08 | ||||
| 2026-02-17 | 13F | Symmetry Peak Management Llc | Call | 33 900 | 1 085 | |||||
| 2026-02-17 | 13F | Citadel Advisors Llc | Put | 57 400 | -52,05 | 1 837 | -33,16 | |||
| 2026-04-15 | 13F | Merit Financial Group, LLC | 10 231 | 6,06 | 413 | 34,09 | ||||
| 2026-02-17 | 13F | Two Sigma Advisers, Lp | 0 | -100,00 | 0 | |||||
| 2026-04-27 | 13F | Leonteq Securities AG | 470 | 0,00 | 19 | 26,67 | ||||
| 2026-04-23 | 13F | North Star Investment Management Corp. | 30 000 | 1 212 | ||||||
| 2026-04-15 | 13F | Perkins Coie Trust Co | 6 712 | -28,60 | 271 | -9,67 | ||||
| 2026-02-17 | 13F | Advisory Services Network, LLC | 0 | -100,00 | 0 | |||||
| 2026-04-24 | 13F | Palouse Capital Management, Inc. | 4 999 | -18,89 | 202 | 2,54 | ||||
| 2026-02-17 | 13F | XTX Topco Ltd | 30 290 | 969 | ||||||
| 2026-02-18 | 13F | State of Tennessee, Treasury Department | 14 104 | -46,53 | 488 | -19,50 | ||||
| 2026-02-02 | 13F | Principal Financial Group Inc | 364 522 | 6,47 | 11 665 | 48,45 | ||||
| 2026-02-10 | 13F | Intech Investment Management Llc | 24 945 | -7,41 | 798 | 29,13 | ||||
| 2026-02-09 | 13F | Jefferies Financial Group Inc. | Call | 0 | -100,00 | 0 | -100,00 | |||
| 2026-02-13 | 13F | Wells Fargo & Company/mn | 84 613 | 26,92 | 2 708 | 77,04 | ||||
| 2025-11-05 | 13F | Alps Advisors Inc | 0 | -100,00 | 0 | |||||
| 2026-01-15 | 13F | Nisa Investment Advisors, Llc | 1 084 | -7,98 | 35 | 25,93 | ||||
| 2026-02-12 | 13F | Jane Street Group, Llc | 30 643 | -82,06 | 981 | -74,99 | ||||
| 2026-02-13 | 13F | Squarepoint Ops LLC | 39 489 | 136,43 | 1 264 | 229,77 | ||||
| 2026-02-17 | 13F | Graham Capital Management, L.P. | 23 744 | 26,59 | 760 | 76,51 | ||||
| 2026-02-12 | 13F | Jane Street Group, Llc | Put | 13 100 | 2,34 | 419 | 43,00 | |||
| 2026-02-12 | 13F | Jane Street Group, Llc | Call | 289 300 | 1 828,67 | 9 258 | 2 590,99 | |||
| 2026-02-18 | 13F | Mackenzie Financial Corp | 39 928 | -31,62 | 1 343 | 0,15 | ||||
| 2026-02-13 | 13F | Hudson Portfolio Management LLC | 26 110 | 0,00 | 836 | 39,40 | ||||
| 2026-02-11 | 13F | Simplex Trading, Llc | Put | 6 500 | -58,60 | 208 | ||||
| 2026-02-11 | 13F | Simplex Trading, Llc | Call | 147 400 | 809,88 | 4 717 | ||||
| 2026-02-11 | 13F | Fox Run Management, L.l.c. | 12 360 | -28,08 | 396 | 0,25 | ||||
| 2025-11-12 | 13F | NewSquare Capital LLC | 0 | -100,00 | 0 | |||||
| 2026-02-12 | 13F | Davy Global Fund Management Ltd | 0 | -100,00 | 0 | |||||
| 2026-02-13 | 13F | Meros Investment Management, LP | 108 004 | -78,60 | 3 456 | -70,17 | ||||
| 2026-02-17 | 13F | Balyasny Asset Management Llc | 34 634 | 1 108 | ||||||
| 2026-02-13 | 13F | Wexford Capital Lp | 0 | -100,00 | 0 | |||||
| 2025-11-12 | 13F | Bellwether Advisors, LLC | 0 | -100,00 | 0 | |||||
| 2026-01-16 | 13F | Empirical Financial Services, LLC d.b.a. Empirical Wealth Management | 23 408 | 749 | ||||||
| 2026-02-13 | 13F | Nierenberg Investment Management Company, Inc. | 6 330 | 203 | ||||||
| 2026-02-13 | 13F | Great West Life Assurance Co /can/ | 51 611 | 6,70 | 2 | 0,00 | ||||
| 2026-04-23 | 13F | Farmers & Merchants Investments Inc | 42 | 0,00 | 2 | 0,00 | ||||
| 2026-02-13 | 13F | Umb Bank N A/mo | 325 | 46,40 | 10 | 100,00 | ||||
| 2026-02-13 | 13F | Segall Bryant & Hamill, Llc | 62 552 | -60,88 | 2 002 | -45,46 | ||||
| 2026-02-17 | 13F | Northern Trust Corp | 834 491 | -6,46 | 26 704 | 30,42 | ||||
| 2026-02-02 | 13F | Horizon Investments, LLC | 16 764 | -35,47 | 536 | -10,07 | ||||
| 2026-04-06 | 13F | Versant Capital Management, Inc | 454 | 120,39 | 18 | 200,00 | ||||
| 2026-02-05 | 13F | Cambridge Investment Research Advisors, Inc. | 7 279 | 0 | ||||||
| 2026-02-11 | 13F | Ameritas Investment Partners, Inc. | 4 862 | 156 | ||||||
| 2026-04-06 | 13F | GAMMA Investing LLC | 3 023 | 15,87 | 122 | 46,99 | ||||
| 2026-04-21 | 13F | Nemes Rush Group LLC | 102 | 0,00 | 4 | 33,33 | ||||
| 2026-02-17 | 13F | Millennium Management Llc | 113 798 | -77,35 | 3 642 | -68,42 | ||||
| 2026-02-17 | 13F | Maryland State Retirement & Pension System | 8 647 | 277 | ||||||
| 2026-04-28 | 13F | Belpointe Asset Management LLC | 29 369 | -3,17 | 1 187 | 22,27 | ||||
| 2026-02-11 | 13F | Franklin Resources Inc | 63 252 | 3,86 | 2 024 | 44,88 | ||||
| 2026-01-22 | 13F | Richardson Financial Services Inc. | 584 | 19 | ||||||
| 2026-04-28 | 13F | SBI Securities Co., Ltd. | 184 | 16,46 | 7 | 40,00 | ||||
| 2026-04-29 | 13F | Police & Firemen's Retirement System of New Jersey | 15 773 | 0,00 | 637 | 26,39 | ||||
| 2026-02-12 | 13F | State Board Of Administration Of Florida Retirement System | 79 637 | -27,19 | 2 548 | 1,51 | ||||
| 2026-04-24 | 13F | SummerHaven Investment Management, LLC | 39 835 | -6,60 | 1 610 | 17,96 | ||||
| 2026-02-12 | 13F | Wealthspire Advisors, LLC | 0 | -100,00 | 0 | |||||
| 2026-02-13 | 13F | Quarry LP | 1 353 | 569,80 | 43 | 975,00 | ||||
| 2026-02-10 | 13F | Norges Bank | 360 634 | 11 540 | ||||||
| 2026-01-30 | 13F/A | M&t Bank Corp | 9 453 | 1,58 | 302 | 41,78 | ||||
| 2026-01-21 | 13F | Newbridge Financial Services Group, Inc. | 1 750 | -51,39 | 56 | -31,71 | ||||
| 2026-02-23 | 13F | Virtu Financial LLC | 24 545 | 1 | ||||||
| 2026-02-17 | 13F | Dark Forest Capital Management Lp | 0 | -100,00 | 0 | |||||
| 2026-04-17 | 13F | Braeburn Wealth Management LLC | 26 906 | 1 087 | ||||||
| 2026-02-17 | 13F | Watershed Asset Management, L.L.C. | 0 | -100,00 | 0 | |||||
| 2025-11-14 | 13F | Concentric Capital Strategies, LP | 0 | -100,00 | 0 | |||||
| 2026-02-10 | 13F | Axq Capital, Lp | 10 273 | 329 | ||||||
| 2026-02-17 | 13F | D. E. Shaw & Co., Inc. | 187 304 | 285,80 | 5 994 | 437,97 | ||||
| 2026-01-27 | 13F | TD Waterhouse Canada Inc. | 200 | 0,00 | 6 | 50,00 | ||||
| 2026-02-17 | 13F | Hancock Whitney Corp | 10 174 | -55,16 | 326 | -37,50 | ||||
| 2026-02-17 | 13F | Brevan Howard Capital Management LP | 8 646 | -45,12 | 277 | -23,55 | ||||
| 2026-04-16 | 13F | Toth Financial Advisory Corp | 40 | 2 | ||||||
| 2026-01-28 | 13F | Salomon & Ludwin, LLC | 332 | -34,39 | 11 | -8,33 | ||||
| 2026-01-23 | 13F | Assetmark, Inc | 183 | -33,45 | 6 | -16,67 | ||||
| 2026-04-21 | 13F | Robeco Institutional Asset Management B.V. | 73 776 | 0,00 | 2 981 | 26,31 | ||||
| 2026-01-26 | 13F | Cwm, Llc | 9 663 | 12,43 | 0 | |||||
| 2026-02-17 | 13F | Aqr Capital Management Llc | 391 487 | 7,52 | 12 528 | 49,92 | ||||
| 2025-11-13 | 13F | Riggs Asset Managment Co. Inc. | 0 | -100,00 | 0 | |||||
| 2026-02-13 | 13F/A | Alberta Investment Management Corp | 0 | -100,00 | 0 | |||||
| 2026-04-16 | 13F | SG Americas Securities, LLC | 21 699 | -5,14 | 1 | |||||
| 2026-04-27 | 13F | Meramec Financial Planners, LLC | 25 | 47,06 | 1 | |||||
| 2026-02-05 | 13F | Thrivent Financial For Lutherans | 40 545 | -6,57 | 1 | |||||
| 2026-02-05 | 13F | Leuthold Group, Llc | 10 985 | 1,06 | 352 | 40,96 | ||||
| 2026-04-28 | 13F | LVZ Advisors, Inc. | 21 966 | 3,59 | 888 | 30,83 | ||||
| 2026-01-30 | 13F | Jennison Associates Llc | 28 560 | 914 | ||||||
| 2026-02-13 | 13F | Needham Investment Management Llc | 775 000 | 1,97 | 24 800 | 42,19 | ||||
| 2026-01-29 | 13F | Ashton Thomas Private Wealth, LLC | 13 674 | -1,33 | 438 | 37,42 | ||||
| 2026-01-28 | 13F | Arizona State Retirement System | 16 473 | -7,38 | 527 | 29,17 | ||||
| 2026-02-17 | 13F | Voloridge Investment Management, Llc | 0 | -100,00 | 0 | |||||
| 2026-02-17 | 13F | Mangrove Partners | 8 266 | 265 | ||||||
| 2026-02-17 | 13F | Susquehanna International Group, Llp | Put | 98 600 | 342,15 | 3 155 | 517,42 | |||
| 2026-02-17 | 13F | Susquehanna International Group, Llp | Call | 294 900 | 308,45 | 9 437 | 469,81 | |||
| 2026-04-21 | 13F | Founders Capital Management | 3 500 | -12,50 | 141 | 10,16 | ||||
| 2026-02-12 | 13F | Tocqueville Asset Management L.p. | 35 102 | -10,50 | 1 123 | 24,78 | ||||
| 2026-02-17 | 13F | Janus Henderson Group Plc | 621 448 | 2 201,49 | 19 883 | 3 112,12 | ||||
| 2026-02-17 | 13F | Captrust Financial Advisors | 9 694 | -16,28 | 310 | 16,98 | ||||
| 2026-02-13 | 13F | Macquarie Group Ltd | 0 | -100,00 | 0 | -100,00 | ||||
| 2026-04-22 | 13F | Sterling Capital Management LLC | 14 667 | -37,40 | 593 | -20,96 | ||||
| 2026-04-17 | 13F | Union Savings Bank | 5 000 | 0,00 | 202 | 26,25 | ||||
| 2026-02-11 | 13F | Picton Mahoney Asset Management | 49 | -99,87 | 2 | |||||
| 2026-02-13 | 13F | Bridge City Capital, LLC | 54 389 | -59,82 | 1 740 | -43,98 | ||||
| 2026-02-17 | 13F | State Of Wisconsin Investment Board | 81 436 | -29,84 | 2 606 | -2,18 | ||||
| 2026-04-13 | 13F | True Wealth Design, LLC | 63 | 8,62 | 3 | 100,00 | ||||
| 2026-02-17 | 13F | Scientech Research LLC | 29 575 | 946 | ||||||
| 2026-04-20 | 13F | Ronald Blue Trust, Inc. | 16 | 0,00 | 1 | |||||
| 2026-02-05 | 13F | Allworth Financial LP | 349 | 176,98 | 11 | 450,00 | ||||
| 2026-04-24 | 13F | James Investment Research Inc | 22 683 | 0,00 | 917 | 26,34 | ||||
| 2026-02-11 | 13F | Illinois Municipal Retirement Fund | 19 984 | -41,45 | 639 | -18,39 | ||||
| 2026-04-21 | 13F | Gilpin Wealth Management, Llc | 14 | 75,00 | 1 | |||||
| 2026-04-15 | 13F | Uncommon Cents Investing LLC | 78 900 | 0,64 | 3 188 | 27,11 | ||||
| 2026-02-04 | 13F | Virginia Retirement Systems Et Al | 20 563 | -4,64 | 658 | 33,20 | ||||
| 2026-02-05 | 13F | Bessemer Group Inc | 121 035 | 39 977,81 | 4 | |||||
| 2026-02-12 | 13F | Commonwealth Equity Services, Llc | 7 080 | 227 | ||||||
| 2026-02-17 | 13F | Clark Capital Management Group, Inc. | 269 993 | 8 640 | ||||||
| 2026-04-22 | 13F | Skylands Capital, LLC | 82 050 | -10,35 | 3 316 | 13,22 | ||||
| 2026-02-12 | 13F | MetLife Investment Management, LLC | 31 716 | -5,57 | 1 015 | 31,69 | ||||
| 2026-02-09 | 13F | Catalyst Funds Management Pty Ltd | 0 | -100,00 | 0 | |||||
| 2026-02-11 | 13F | Heartland Advisors Inc | 385 150 | -21,41 | 12 325 | 9,58 | ||||
| 2026-02-17 | 13F | Hotchkis & Wiley Capital Management Llc | 529 249 | -11,47 | 16 936 | 23,44 | ||||
| 2026-02-17 | 13F | Magnetar Financial LLC | 9 048 | -67,88 | 290 | -55,26 | ||||
| 2026-04-24 | 13F | ProShare Advisors LLC | 8 896 | -19,99 | 359 | 1,13 | ||||
| 2026-01-26 | 13F | KBC Group NV | 1 977 | 0,00 | 0 | |||||
| 2026-02-13 | 13F | Pathstone Holdings, LLC | 9 366 | 1,93 | 300 | 42,38 | ||||
| 2026-01-26 | 13F | Private Trust Co Na | 183 | -49,31 | 6 | -37,50 | ||||
| 2026-02-09 | 13F | Hartland & Co., LLC | 1 603 | 195,76 | 51 | 325,00 | ||||
| 2026-04-07 | 13F | Farther Finance Advisors, LLC | 3 926 | -20,48 | 160 | 1,91 | ||||
| 2026-04-28 | 13F | DGS Capital Management, LLC | 6 987 | 1,53 | 282 | 28,18 | ||||
| 2026-01-29 | 13F | Cornerstone Investment Partners, LLC | 9 002 | 288 | ||||||
| 2026-04-08 | 13F | NorthCrest Asset Manangement, LLC | 68 043 | 0,19 | 2 780 | 22,64 | ||||
| 2026-02-17 | 13F | Bank Of America Corp /de/ | 153 875 | 18,33 | 4 924 | 65,01 | ||||
| 2026-02-10 | 13F | Basepoint Wealth LLC | 110 | 4 | ||||||
| 2026-01-29 | 13F | Comerica Bank | 29 668 | -35,35 | 949 | -9,88 | ||||
| 2026-02-17 | 13F | Man Group plc | 60 739 | -61,77 | 1 944 | -46,71 | ||||
| 2026-02-13 | 13F | American Century Companies Inc | 2 461 127 | 2,03 | 78 756 | 42,26 | ||||
| 2026-04-21 | 13F | PharVision Advisers, LLC | 0 | -100,00 | 0 | |||||
| 2026-03-06 | 13F | Hsbc Holdings Plc | 12 933 | 428 | ||||||
| 2026-02-12 | 13F | CIBC Private Wealth Group, LLC | 69 | 2 | ||||||
| 2026-02-18 | 13F | Vident Advisory, LLC | 25 808 | -2,28 | 826 | 36,14 | ||||
| 2026-02-13 | 13F | Arrowstreet Capital, Limited Partnership | 535 199 | 45,94 | 17 126 | 103,49 | ||||
| 2026-04-07 | 13F | Signaturefd, Llc | 1 085 | 42,76 | 44 | 79,17 | ||||
| 2025-11-14 | 13F | Freestone Grove Partners LP | 0 | -100,00 | 0 | |||||
| 2026-04-10 | 13F | Abound Wealth Management | 6 | 0 | ||||||
| 2026-02-11 | 13F | Deutsche Bank Ag\ | 41 059 | -14,49 | 1 314 | 19,26 | ||||
| 2026-02-13 | 13F | Boston Partners | 809 364 | -3,35 | 26 142 | 35,24 | ||||
| 2026-02-17 | 13F | Russell Investments Group, Ltd. | 105 784 | 0,29 | 3 385 | 39,88 | ||||
| 2026-02-13 | 13F | Manufacturers Life Insurance Company, The | 0 | -100,00 | 0 | |||||
| 2026-02-12 | 13F | Adviser Investments LLC | 6 800 | 218 | ||||||
| 2026-02-17 | 13F | Grantham, Mayo, Van Otterloo & Co. LLC | 15 223 | 57,02 | 487 | 119,37 | ||||
| 2026-02-12 | 13F | Brown Brothers Harriman & Co | 163 | -80,19 | 5 | -72,22 | ||||
| 2026-02-17 | 13F | ISAM Funds (UK) Ltd | 0 | -100,00 | 0 | |||||
| 2026-04-23 | 13F | CWM Advisors, LLC | 60 238 | 14,92 | 2 434 | 45,14 | ||||
| 2026-02-13 | 13F | Smartleaf Asset Management LLC | 542 | 0,00 | 18 | 50,00 | ||||
| 2026-02-11 | 13F | Zions Bancorporation, National Association /ut/ | 48 | 2 | ||||||
| 2026-04-27 | 13F | Y-Intercept (Hong Kong) Ltd | 0 | -100,00 | 0 | -100,00 | ||||
| 2026-02-10 | 13F | JTC Employer Solutions Trusteee Ltd | 191 856 | 0,00 | 4 | 0,00 | ||||
| 2026-02-12 | 13F | BRYN MAWR TRUST Co | 0 | -100,00 | 0 | -100,00 | ||||
| 2026-02-13 | 13F | Parkside Financial Bank & Trust | 2 624 | 16,16 | 84 | 62,75 | ||||
| 2026-02-17 | 13F | Raymond James Financial Inc | 10 644 | 341 | ||||||
| 2026-02-12 | 13F | Dimensional Fund Advisors Lp | 4 054 450 | -0,90 | 129 751 | 38,19 | ||||
| 2026-02-17 | 13F | Alliancebernstein L.p. | 97 305 | -54,06 | 3 114 | -35,96 | ||||
| 2026-02-09 | 13F | Hantz Financial Services, Inc. | 1 917 | 29,09 | 0 | |||||
| 2026-04-20 | 13F | State of Alaska, Department of Revenue | 31 700 | -2,99 | 1 | 0,00 | ||||
| 2026-02-09 | 13F | Jefferies Financial Group Inc. | 15 001 | -25,00 | 480 | 4,58 | ||||
| 2026-02-10 | 13F | Envestnet Asset Management Inc | 58 530 | -7,16 | 1 873 | 29,46 | ||||
| 2026-02-12 | 13F | Quadrant Capital Group Llc | 58 | 0,00 | 2 | 0,00 | ||||
| 2026-02-05 | 13F | Amalgamated Bank | 17 088 | 0,02 | 1 | |||||
| 2026-02-17 | 13F | Mill Road Capital Management LLC | 80 200 | -75,29 | 2 566 | -65,56 | ||||
| 2026-04-27 | 13F | Counterpoint Mutual Funds LLC | 0 | -100,00 | 0 | |||||
| 2026-02-12 | 13F | Ankerstar Wealth, LLC | 6 | 0 | ||||||
| 2026-01-28 | 13F | Universal- Beteiligungs- und Servicegesellschaft mbH | 285 261 | 41,32 | 9 128 | 97,06 | ||||
| 2026-02-02 | 13F | Danske Bank A/s | 9 300 | 298 | ||||||
| 2026-02-10 | 13F | Quantbot Technologies LP | 13 769 | 441 | ||||||
| 2026-02-17 | 13F | Quantinno Capital Management LP | 25 544 | 19,27 | 817 | 66,40 | ||||
| 2026-04-08 | 13F | Wealth Enhancement Advisory Services, Llc | 89 914 | 528,95 | 893 | 42,65 | ||||
| 2026-04-16 | 13F | Vaughan Nelson Investment Management, L.p. | 1 185 405 | 47 902 | ||||||
| 2025-11-12 | 13F | South Dakota Investment Council | 0 | -100,00 | 0 | |||||
| 2026-02-10 | 13F | Mutual Of America Capital Management Llc | 6 744 | 216 | ||||||
| 2026-02-17 | 13F | Numerai GP LLC | 0 | -100,00 | 0 | |||||
| 2026-02-13 | 13F | First Trust Advisors Lp | 188 441 | -1,41 | 6 030 | 37,48 | ||||
| 2026-02-17 | 13F | Perritt Capital Management Inc | 46 300 | 0,00 | 1 482 | 39,45 | ||||
| 2026-02-17 | 13F | Royal Bank Of Canada | 121 536 | -56,98 | 3 889 | -40,01 | ||||
| 2026-02-13 | 13F | Public Employees Retirement Association Of Colorado | 6 355 | 0,00 | 0 | |||||
| 2026-04-24 | 13F | Yousif Capital Management, Llc | 15 685 | -1,53 | 634 | 15,51 | ||||
| 2026-02-12 | 13F | Nuveen, LLC | 128 646 | -2,92 | 4 117 | 35,35 | ||||
| 2026-04-22 | 13F | Advocate Investing Services LLC | 104 | 0,00 | 4 | 33,33 | ||||
| 2026-02-11 | 13F | Curio Wealth, Llc | 1 000 | 0,00 | 34 | 50,00 | ||||
| 2025-11-12 | 13F | Simplex Trading, Llc | 0 | -100,00 | 0 | |||||
| 2026-02-13 | 13F | Barclays Plc | 92 618 | 8,04 | 2 964 | 50,64 | ||||
| 2026-01-30 | 13F | Torren Management, LLC | 826 | 26 | ||||||
| 2026-02-13 | 13F | Caxton Associates Llp | 48 480 | 10,65 | 1 551 | 54,33 | ||||
| 2026-02-17 | 13F | Ancora Advisors, LLC | 10 356 | -54,38 | 331 | -36,47 | ||||
| 2026-02-17 | 13F | MIRAE ASSET GLOBAL ETFS HOLDINGS Ltd. | 26 511 | -1,95 | 848 | 36,77 | ||||
| 2026-02-09 | 13F | Morningstar Investment Management LLC | 71 846 | 0,00 | 2 | 100,00 | ||||
| 2026-02-10 | 13F | State of Wyoming | 0 | -100,00 | 0 | -100,00 | ||||
| 2026-02-13 | 13F | Edgestream Partners, L.P. | 77 597 | 2 483 | ||||||
| 2026-02-17 | 13F | Bridgeway Capital Management Inc | 362 834 | 0,00 | 11 611 | 39,43 | ||||
| 2026-01-30 | 13F | Arlington Trust Co LLC | 0 | -100,00 | 0 | -100,00 | ||||
| 2026-01-30 | 13F | Us Bancorp \de\ | 501 | 7,97 | 16 | 60,00 | ||||
| 2026-02-17 | 13F | Fmr Llc | 15 060 | 16,31 | 482 | 61,95 | ||||
| 2026-02-13 | 13F | Ubs Asset Management Americas Inc | 86 127 | 15,01 | 2 756 | 60,42 | ||||
| 2026-02-13 | 13F | Martingale Asset Management L P | 111 261 | 12,55 | 3 560 | 56,97 | ||||
| 2026-02-17 | 13F | Canada Pension Plan Investment Board | 96 400 | 30,62 | 3 085 | 82,16 | ||||
| 2026-02-13 | 13F | Mml Investors Services, Llc | 13 431 | 430 | ||||||
| 2026-02-17 | 13F | Mercer Global Advisors Inc /adv | 18 849 | 7,69 | 603 | 50,37 | ||||
| 2026-02-11 | 13F | Barrow Hanley Mewhinney & Strauss Llc | 225 190 | 7 206 | ||||||
| 2026-02-03 | 13F | Kestrel Investment Management Corp | 201 850 | -3,49 | 6 | 50,00 | ||||
| 2025-11-14 | 13F | Lazard Asset Management Llc | 0 | -100,00 | 0 | |||||
| 2026-01-29 | 13F | IMC-Chicago, LLC | Call | 96 400 | 696,69 | 3 085 | 1 013,36 | |||
| 2026-02-17 | 13F | Engineers Gate Manager LP | 24 209 | -30,84 | 775 | -3,61 | ||||
| 2026-02-17 | 13F | Jones Financial Companies Lllp | 930 | -10,40 | 30 | 20,83 | ||||
| 2026-02-09 | 13F | Legal & General Group Plc | 147 710 | -10,49 | 4 727 | 24,80 | ||||
| 2026-02-04 | 13F | Pacific Ridge Capital Partners, LLC | 55 305 | -22,56 | 1 770 | 8,00 | ||||
| 2026-02-11 | 13F | Jpmorgan Chase & Co | 221 651 | -2,67 | 7 093 | 35,71 | ||||
| 2026-02-17 | 13F | Zacks Investment Management | 12 789 | 409 | ||||||
| 2026-02-11 | 13F | O'shaughnessy Asset Management, Llc | 142 520 | 39,70 | 4 561 | 94,79 | ||||
| 2026-02-13 | 13F | State Street Corp | 2 243 545 | 0,03 | 71 793 | 39,47 |
Other Listings
| US:PLAB | 48,13 USD |