Podstawowe statystyki
| Akcje instytucjonalne (długie) | 3 151 540 - 8,90% (ex 13D/G) - change of -0,66MM shares -17,16% MRQ |
| Wartość instytucjonalna (długa) | $ 9 559 USD ($1000) |
Własność instytucjonalna i akcjonariusze
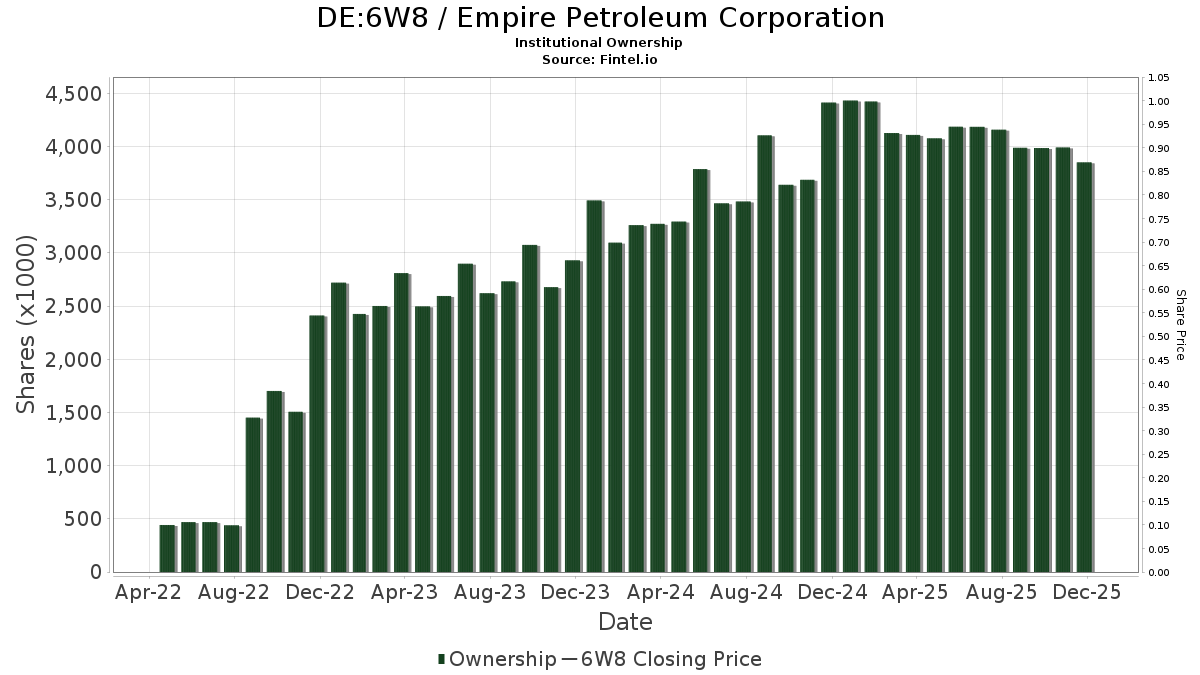
Empire Petroleum Corporation (DE:6W8) posiada 46 właściciele instytucjonalni i akcjonariusze, którzy złożyli formularze 13D/G lub 13F w Komisji Papierów Wartościowych (SEC). Instytucje te posiadają łącznie 3,151,540 akcji. Do największych akcjonariuszy należą BlackRock, Inc., Vanguard Group Inc, Geode Capital Management, Llc, State Street Corp, Northern Trust Corp, Wiley Bros.-aintree Capital, Llc, Wealth Enhancement Advisory Services, Llc, GWM Advisors LLC, Verdence Capital Advisors LLC, and Wellington Management Group Llp .
Empire Petroleum Corporation (DB:6W8) instytucjonalna struktura własności pokazuje aktualne pozycje w firmie według instytucji i funduszy, a także najnowsze zmiany w wielkości stanowisk. Głównymi akcjonariuszami mogą być inwestorzy indywidualni, fundusze inwestycyjne, fundusze hedgingowe lub instytucje. Załącznik 13D wskazuje, że inwestor posiada (lub posiadał) więcej niż 5% udziałów w spółce i zamierza (lub zamierzał) aktywnie dążyć do zmiany strategii biznesowej. Załącznik 13G wskazuje na inwestycję pasywną na poziomie ponad 5%.
The share price as of March 24, 2026 is 2,48 / share. Previously, on December 1, 2025, the share price was 2,42 / share. This represents an increase of 2,48% over that period.
Ocena sentymentu funduszu
Wskaźnik sentymentu funduszu (fka Ownership Accumulation Score) pozwala określić akcje, które są najczęściej kupowane przez fundusze. Jest to wynik zaawansowanego, wieloczynnikowego modelu ilościowego, który identyfikuje spółki o najwyższym poziomie akumulacji instytucjonalnej. Model oceny wykorzystuje kombinację całkowitego wzrostu liczby ujawnionych właścicieli, zmian w alokacji portfela wśród tych właścicieli i innych wskaźników. Liczba waha się od 0 do 100, przy czym wyższe liczby wskazują na wyższy poziom akumulacji w stosunku do innych spółek, a 50 oznacza średnią.
Częstotliwość aktualizacji: codziennie
Sprawdź Ownership Explorer, który zawiera listę firm o najwyższym rankingu.
AI+ Ask Fintel’s AI assistant about Empire Petroleum Corporation.
Select a question to share a public post with an AI-crafted answer.
Thinking of good questions…
Zgłoszenia 13F i NPORT
Szczegółowe dane dotyczące zgłoszeń 13F są bezpłatne. Szczegółowe dane dotyczące zgłoszeń NP wymagają członkostwa premium. Zielone rzędy wskazują nowe pozycje. Czerwone rzędy wskazują pozycje zamknięte. Kliknij w ikonę linku, aby zobaczyć pełną historię transakcji.
Aktualizacja
aby odblokować dane premium i eksportować do Excela ![]() .
.
| Data pliku | Źródło | Inwestor | Typ | Średnia cena (Est) |
Akcje | Akcje; Δ (%) |
Zgłoszono Wartość ($1000) |
Wartość; Δ (%) |
Przydział portu (%) |
|
|---|---|---|---|---|---|---|---|---|---|---|
| 2026-02-13 | 13F | Charles Schwab Investment Management Inc | 27 967 | -47,85 | 85 | -64,88 | ||||
| 2026-02-12 | 13F | Jane Street Group, Llc | 0 | -100,00 | 0 | |||||
| 2026-02-13 | 13F | Barclays Plc | 22 982 | 8,40 | 70 | -27,37 | ||||
| 2026-02-11 | 13F | Ameritas Investment Partners, Inc. | 508 | 2 | ||||||
| 2026-01-29 | 13F | Vanguard Group Inc | 766 281 | -8,14 | 2 329 | -38,22 | ||||
| 2026-02-09 | 13F | Geode Capital Management, Llc | 397 252 | 0,07 | 1 208 | -32,72 | ||||
| 2026-01-08 | 13F | Wealth Enhancement Advisory Services, Llc | 62 584 | 19,02 | 178 | -16,51 | ||||
| 2026-02-09 | 13F | Legal & General Group Plc | 1 421 | 0,00 | 4 | -33,33 | ||||
| 2026-02-17 | 13F | Northern Trust Corp | 125 680 | -5,52 | 382 | -36,44 | ||||
| 2026-02-12 | 13F | Nuveen, LLC | 37 869 | 0,00 | 115 | -32,75 | ||||
| 2026-02-13 | 13F | State Street Corp | 189 012 | -2,40 | 575 | -34,40 | ||||
| 2026-02-13 | 13F | Citigroup Inc | 584 | -56,35 | 2 | -83,33 | ||||
| 2026-01-05 | 13F | GAMMA Investing LLC | 104 | -66,56 | 0 | -100,00 | ||||
| 2026-01-29 | 13F | Verdence Capital Advisors LLC | 53 830 | 9,46 | 164 | -6,86 | ||||
| 2026-02-11 | 13F | Deutsche Bank Ag\ | 27 271 | 138,32 | 83 | 60,78 | ||||
| 2025-11-14 | 13F | Raymond James Financial Inc | 0 | -100,00 | 0 | |||||
| 2026-02-17 | 13F | Russell Investments Group, Ltd. | 1 951 | 58,49 | 6 | 0,00 | ||||
| 2026-02-13 | 13F | Rhumbline Advisers | 16 706 | -16,47 | 51 | -44,44 | ||||
| 2026-01-29 | 13F | UBS Group AG | 7 744 | -33,10 | 24 | -55,77 | ||||
| 2026-02-17 | 13F | Wiley Bros.-aintree Capital, Llc | 110 857 | 0,00 | 337 | -32,73 | ||||
| 2026-02-17 | 13F | Citadel Advisors Llc | 43 190 | 110,47 | 131 | 42,39 | ||||
| 2026-01-08 | 13F | Sanders Morris Harris Llc | 0 | -100,00 | 0 | |||||
| 2026-02-17 | 13F | Fmr Llc | 870 | -70,35 | 3 | -84,62 | ||||
| 2026-02-13 | 13F | Sterling Capital Management LLC | 159 | 54,37 | 0 | |||||
| 2025-10-23 | 13F | Nisa Investment Advisors, Llc | 0 | -100,00 | 0 | |||||
| 2025-09-29 | NP | RSSL - Global X Russell 2000 ETF | 8 105 | -11,85 | 37 | -14,29 | ||||
| 2026-02-10 | 13F | Bank of New York Mellon Corp | 45 793 | -1,62 | 139 | -33,81 | ||||
| 2026-02-13 | 13F | Transamerica Financial Advisors, Inc. | 19 | 0 | ||||||
| 2026-02-17 | 13F | Wellington Management Group Llp | 50 707 | 69,70 | 154 | 14,07 | ||||
| 2026-02-17 | 13F | MIRAE ASSET GLOBAL ETFS HOLDINGS Ltd. | 7 076 | -5,08 | 22 | -36,36 | ||||
| 2026-02-06 | 13F | Pnc Financial Services Group, Inc. | 46 | -92,08 | 0 | -100,00 | ||||
| 2026-02-12 | 13F | State Board Of Administration Of Florida Retirement System | 15 530 | 0,00 | 47 | -32,86 | ||||
| 2026-02-12 | 13F | BlackRock, Inc. | 893 204 | 1,60 | 2 715 | -31,66 | ||||
| 2026-02-12 | 13F | New York State Common Retirement Fund | 3 428 | 0,00 | 10 | -33,33 | ||||
| 2026-02-12 | 13F | Dimensional Fund Advisors Lp | 14 464 | 0,03 | 44 | -33,85 | ||||
| 2026-02-18 | 13F | GWM Advisors LLC | 56 064 | 0,00 | 170 | -32,81 | ||||
| 2025-09-29 | NP | SUNAMERICA SERIES TRUST - SA Small Cap Index Portfolio Class 1 | 1 951 | 8,45 | 9 | 0,00 | ||||
| 2026-02-11 | 13F | Jpmorgan Chase & Co | 9 148 | -53,01 | 28 | -69,32 | ||||
| 2026-02-10 | 13F | Bnp Paribas Arbitrage, Sa | 3 921 | 30,74 | 12 | -15,38 | ||||
| 2026-02-17 | 13F | California State Teachers Retirement System | 887 | -19,14 | 3 | -50,00 | ||||
| 2026-02-13 | 13F | Police & Firemen's Retirement System of New Jersey | 4 140 | 0,00 | 13 | -33,33 | ||||
| 2026-02-05 | 13F | Amalgamated Bank | 461 | -15,72 | 0 | |||||
| 2026-02-17 | 13F | Bank Of America Corp /de/ | 16 591 | 60,95 | 50 | 8,70 | ||||
| 2026-02-17 | 13F | Royal Bank Of Canada | 1 449 | 75,00 | 4 | 33,33 | ||||
| 2025-11-14 | 13F | Susquehanna International Group, Llp | 0 | -100,00 | 0 | -100,00 | ||||
| 2025-09-29 | NP | KCXIX - Knights of Columbus U.S. All Cap Index Fund I Shares | 51 | 8,51 | 0 | |||||
| 2026-02-17 | 13F | Tower Research Capital LLC (TRC) | 3 351 | 38,47 | 10 | 0,00 | ||||
| 2026-02-17 | 13F | Cetera Investment Advisers | 38 809 | -0,37 | 118 | -33,52 | ||||
| 2026-02-10 | 13F | Goldman Sachs Group Inc | 30 270 | 7,45 | 92 | -27,56 | ||||
| 2026-02-13 | 13F | Morgan Stanley | 35 163 | 67,82 | 107 | 12,77 | ||||
| 2026-02-13 | 13F | Wells Fargo & Company/mn | 16 090 | 73,36 | 49 | 17,07 |
Other Listings
| US:EP | 2,91 USD |