Podstawowe statystyki
| Akcje instytucjonalne (długie) | 69 643 032 - 26,20% (ex 13D/G) - change of -10,48MM shares -12,96% MRQ |
| Wartość instytucjonalna (długa) | $ 2 175 578 USD ($1000) |
Własność instytucjonalna i akcjonariusze
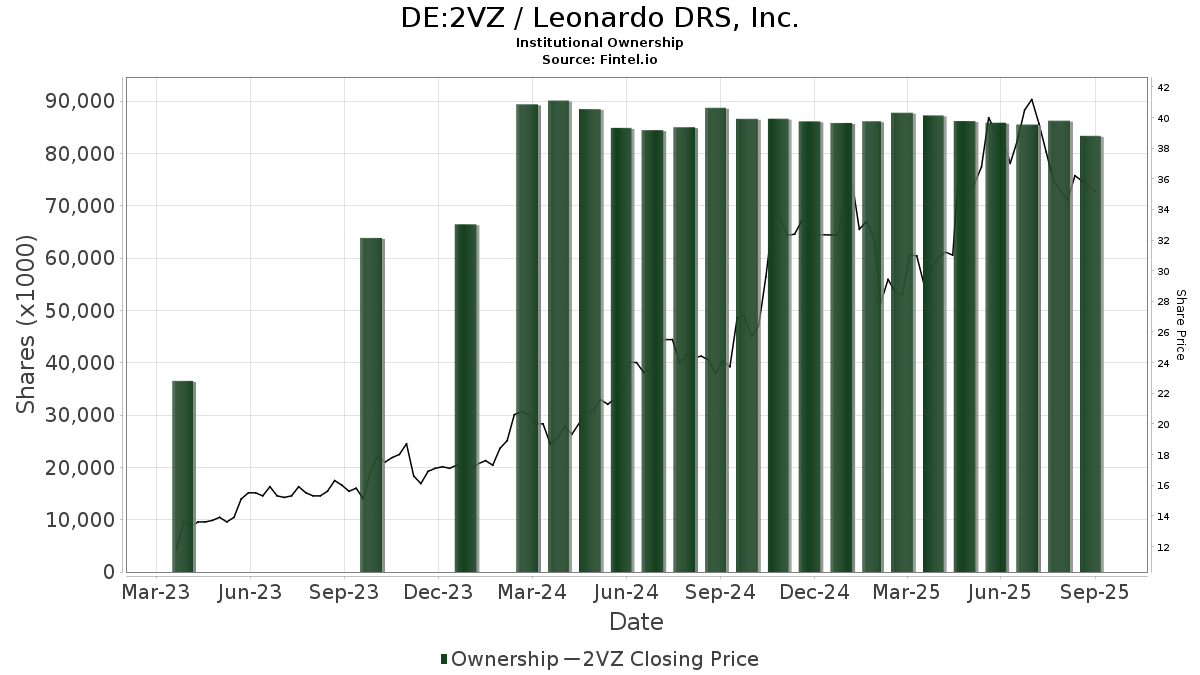
Leonardo DRS, Inc. (DE:2VZ) posiada 331 właściciele instytucjonalni i akcjonariusze, którzy złożyli formularze 13D/G lub 13F w Komisji Papierów Wartościowych (SEC). Instytucje te posiadają łącznie 69,643,032 akcji. Do największych akcjonariuszy należą Vanguard Group Inc, BlackRock, Inc., State Street Corp, Fmr Llc, First Trust Advisors Lp, Aqr Capital Management Llc, Price T Rowe Associates Inc /md/, Dimensional Fund Advisors Lp, Millennium Management Llc, and Van Eck Associates Corp .
Leonardo DRS, Inc. (DB:2VZ) instytucjonalna struktura własności pokazuje aktualne pozycje w firmie według instytucji i funduszy, a także najnowsze zmiany w wielkości stanowisk. Głównymi akcjonariuszami mogą być inwestorzy indywidualni, fundusze inwestycyjne, fundusze hedgingowe lub instytucje. Załącznik 13D wskazuje, że inwestor posiada (lub posiadał) więcej niż 5% udziałów w spółce i zamierza (lub zamierzał) aktywnie dążyć do zmiany strategii biznesowej. Załącznik 13G wskazuje na inwestycję pasywną na poziomie ponad 5%.
The share price as of March 26, 2026 is 39,95 / share. Previously, on March 27, 2025, the share price was 30,73 / share. This represents an increase of 30,00% over that period.
Ocena sentymentu funduszu
Wskaźnik sentymentu funduszu (fka Ownership Accumulation Score) pozwala określić akcje, które są najczęściej kupowane przez fundusze. Jest to wynik zaawansowanego, wieloczynnikowego modelu ilościowego, który identyfikuje spółki o najwyższym poziomie akumulacji instytucjonalnej. Model oceny wykorzystuje kombinację całkowitego wzrostu liczby ujawnionych właścicieli, zmian w alokacji portfela wśród tych właścicieli i innych wskaźników. Liczba waha się od 0 do 100, przy czym wyższe liczby wskazują na wyższy poziom akumulacji w stosunku do innych spółek, a 50 oznacza średnią.
Częstotliwość aktualizacji: codziennie
Sprawdź Ownership Explorer, który zawiera listę firm o najwyższym rankingu.
AI+ Ask Fintel’s AI assistant about Leonardo DRS, Inc..
Select a question to share a public post with an AI-crafted answer.
Thinking of good questions…
Zgłoszenia 13F i NPORT
Szczegółowe dane dotyczące zgłoszeń 13F są bezpłatne. Szczegółowe dane dotyczące zgłoszeń NP wymagają członkostwa premium. Zielone rzędy wskazują nowe pozycje. Czerwone rzędy wskazują pozycje zamknięte. Kliknij w ikonę linku, aby zobaczyć pełną historię transakcji.
Aktualizacja
aby odblokować dane premium i eksportować do Excela ![]() .
.
| Data pliku | Źródło | Inwestor | Typ | Średnia cena (Est) |
Akcje | Akcje; Δ (%) |
Zgłoszono Wartość ($1000) |
Wartość; Δ (%) |
Przydział portu (%) |
|
|---|---|---|---|---|---|---|---|---|---|---|
| 2026-02-11 | 13F | Sunrise Financial Services, LLC | 40 | 1 | ||||||
| 2025-11-14 | 13F | Point72 Asia (Singapore) Pte. Ltd. | 4 494 | 204 | ||||||
| 2026-02-17 | 13F | Gotham Asset Management, LLC | 13 229 | -13,02 | 451 | -34,78 | ||||
| 2025-11-12 | 13F | Picton Mahoney Asset Management | 0 | -100,00 | 0 | |||||
| 2026-02-12 | 13F | Jane Street Group, Llc | 359 573 | 568,02 | 12 258 | 401,72 | ||||
| 2026-02-02 | 13F | Cornerstone Planning Group LLC | 2 | 0 | ||||||
| 2026-02-11 | 13F | Ing Groep Nv | 40 500 | 1 381 | ||||||
| 2026-02-12 | 13F | Jane Street Group, Llc | Put | 7 200 | -32,71 | 245 | -49,48 | |||
| 2026-01-29 | 13F | Quent Capital, LLC | 19 074 | 42 286,67 | 650 | 32 400,00 | ||||
| 2026-02-12 | 13F | Jane Street Group, Llc | Call | 38 700 | -22,13 | 1 319 | -41,53 | |||
| 2026-02-12 | 13F | Loomis Sayles & Co L P | 441 875 | -2,42 | 15 064 | -26,73 | ||||
| 2026-02-17 | 13F | Glenmede Trust Co Na | 0 | -100,00 | 0 | |||||
| 2025-10-24 | 13F | Oliver Luxxe Assets LLC | 0 | -100,00 | 0 | -100,00 | ||||
| 2026-02-05 | 13F | Stephens Investment Management Group LLC | 1 020 223 | 24,80 | 34 779 | -6,29 | ||||
| 2026-02-24 | 13F | Bell Investment Advisors, Inc | 18 | -41,94 | 1 | -100,00 | ||||
| 2026-02-13 | 13F | Bank Of Nova Scotia | 153 338 | 5 227 | ||||||
| 2026-02-17 | 13F | Captrust Financial Advisors | 14 375 | 74,71 | 490 | 31,37 | ||||
| 2026-02-03 | 13F | Harel Insurance Investments & Financial Services Ltd. | 35 814 | -11,96 | 1 | 0,00 | ||||
| 2026-02-17 | 13F | Raymond James Financial Inc | 44 808 | -63,45 | 1 528 | -72,56 | ||||
| 2026-02-13 | 13F | Kennedy Capital Management, Inc. | 100 366 | 0,43 | 3 421 | -24,60 | ||||
| 2026-02-17 | 13F | Jones Financial Companies Lllp | 8 223 | 91,68 | 280 | 48,94 | ||||
| 2026-02-06 | 13F | Legato Capital Management LLC | 82 294 | 9,61 | 2 805 | -17,69 | ||||
| 2026-02-13 | 13F | Citigroup Inc | 139 844 | 18,48 | 4 767 | -11,03 | ||||
| 2026-01-09 | 13F | SG Americas Securities, LLC | 189 419 | 982,46 | 6 | |||||
| 2026-01-08 | 13F | Versant Capital Management, Inc | 107 | 365,22 | 4 | 200,00 | ||||
| 2026-01-15 | 13F | Trust Co | 11 | 0 | ||||||
| 2026-02-13 | 13F | Boston Partners | 0 | -100,00 | 0 | |||||
| 2026-02-17 | 13F | Janus Henderson Group Plc | 33 329 | 0,00 | 1 136 | -24,92 | ||||
| 2026-01-30 | 13F | Us Bancorp \de\ | 16 887 | 23,80 | 576 | -7,11 | ||||
| 2026-02-13 | 13F | Jacobs Levy Equity Management, Inc | 167 378 | 20,06 | 5 706 | -9,86 | ||||
| 2026-02-17 | 13F | Voleon Capital Management Lp | 86 166 | 2 937 | ||||||
| 2026-01-14 | 13F | ORG Partners LLC | 125 | 0,00 | 4 | -20,00 | ||||
| 2026-02-12 | 13F | Federated Hermes, Inc. | 295 856 | 27,00 | 10 086 | -4,64 | ||||
| 2026-02-17 | 13F | Canada Pension Plan Investment Board | 74 000 | -0,54 | 2 523 | -25,32 | ||||
| 2026-01-28 | 13F | Salomon & Ludwin, LLC | 0 | -100,00 | 0 | |||||
| 2026-02-06 | 13F | Creative Financial Designs Inc /adv | 50 | 0,00 | 2 | -50,00 | ||||
| 2026-02-17 | 13F | Optiver Holding B.V. | 0 | -100,00 | 0 | |||||
| 2025-11-13 | 13F | Lord, Abbett & Co. Llc | 0 | -100,00 | 0 | -100,00 | ||||
| 2026-02-05 | 13F | Td Private Client Wealth Llc | 53 | 0,00 | 2 | -50,00 | ||||
| 2026-02-17 | 13F | Royal Bank Of Canada | 11 234 | -50,42 | 383 | -62,78 | ||||
| 2026-02-09 | 13F | Legal & General Group Plc | 73 973 | -38,49 | 2 522 | -53,82 | ||||
| 2026-02-10 | 13F | Connor, Clark & Lunn Investment Management Ltd. | 450 951 | 60,17 | 15 373 | 20,26 | ||||
| 2025-09-29 | NP | APITX - Yorktown Growth Fund Class L Shares | 7 900 | 0,00 | 329 | 12,71 | ||||
| 2026-02-06 | 13F | Global Retirement Partners, LLC | 509 | 17 | ||||||
| 2026-02-03 | 13F | SBI Securities Co., Ltd. | 1 362 | 324,30 | 46 | 228,57 | ||||
| 2026-02-02 | 13F | Bay Harbor Wealth Management, LLC | 10 | -23,08 | 0 | |||||
| 2026-02-10 | 13F | Bnp Paribas Arbitrage, Sa | 90 539 | 56,95 | 3 086 | 17,88 | ||||
| 2026-02-13 | 13F | Diametric Capital, LP | 18 126 | 618 | ||||||
| 2026-01-23 | 13F | Farther Finance Advisors, LLC | 1 736 | 939,52 | 59 | 742,86 | ||||
| 2026-02-05 | 13F | Bessemer Group Inc | 50 | 0,00 | 0 | |||||
| 2026-01-27 | 13F | WealthCollab, LLC | 74 | 3 | ||||||
| 2026-02-17 | 13F | Perbak Capital Partners LLP | 0 | -100,00 | 0 | |||||
| 2026-02-10 | 13F | Goldman Sachs Group Inc | 526 073 | 115,92 | 17 934 | 62,13 | ||||
| 2026-01-23 | 13F | Assetmark, Inc | 3 | 0,00 | 0 | |||||
| 2026-02-10 | 13F | Principia Wealth Advisory, LLC | 0 | -100,00 | 0 | |||||
| 2026-02-11 | 13F | Franklin Resources Inc | 147 826 | -85,07 | 5 039 | -88,79 | ||||
| 2026-02-09 | 13F | Illumine Investment Management, LLC | 56 851 | -0,83 | 1 938 | -25,52 | ||||
| 2026-02-12 | 13F | ROSS\JOHNSON & Associates LLC | 2 | 0 | ||||||
| 2026-02-17 | 13F | Dark Forest Capital Management Lp | 36 256 | 26,50 | 1 236 | -5,07 | ||||
| 2026-02-13 | 13F | SRS Capital Advisors, Inc. | 40 | -99,49 | 1 | -99,72 | ||||
| 2026-02-13 | 13F | Baird Financial Group, Inc. | 64 671 | -48,17 | 2 205 | -61,09 | ||||
| 2026-02-17 | 13F | Twinbeech Capital Lp | 129 555 | 4 417 | ||||||
| 2026-02-12 | 13F | EntryPoint Capital, LLC | 13 465 | 459 | ||||||
| 2026-01-09 | 13F | Diversified Trust Co | 0 | -100,00 | 0 | |||||
| 2026-02-13 | 13F | BNP Paribas Asset Management Holding S.A. | 1 589 | 45,65 | 0 | |||||
| 2026-02-17 | 13F | Delaware Management Holdings, Inc. | 1 315 302 | 44 839 | ||||||
| 2026-02-17 | 13F | State Of Wisconsin Investment Board | 112 284 | 0,10 | 3 828 | -24,84 | ||||
| 2026-01-16 | 13F | Tema Etfs Llc | 296 | 10 | ||||||
| 2026-02-17 | 13F | Advisor Group Holdings, Inc. | 8 187 | 23,39 | 279 | 0,72 | ||||
| 2026-02-10 | 13F | Td Asset Management Inc | 15 222 | 0,00 | 519 | -25,04 | ||||
| 2026-02-17 | 13F | Equitable Holdings, Inc. | 17 480 | -56,82 | 596 | -67,61 | ||||
| 2026-02-12 | 13F | Elo Mutual Pension Insurance Co | 32 936 | 135,81 | 1 123 | 76,97 | ||||
| 2026-02-17 | 13F | Nomura Holdings Inc | 9 486 | 93,95 | 323 | 45,50 | ||||
| 2026-01-23 | 13F | Optima Capital Llc | 15 | 1 | ||||||
| 2026-02-17 | 13F | Two Sigma Investments, Lp | 0 | -100,00 | 0 | |||||
| 2025-11-13 | 13F | Riggs Asset Managment Co. Inc. | 0 | -100,00 | 0 | |||||
| 2026-02-03 | 13F | Chesapeake Capital Corp /il/ | 0 | -100,00 | 0 | |||||
| 2026-01-13 | 13F | Mather Group, Llc. | 0 | -100,00 | 0 | |||||
| 2026-02-10 | 13F | Eurizon Capital SGR S.p.A. | 2 147 | 73 | ||||||
| 2026-02-13 | 13F | Squarepoint Ops LLC | 451 236 | 296,57 | 15 383 | 197,81 | ||||
| 2026-01-16 | 13F | Ledgewood Wealth Advisors, LLC | 35 590 | -1,14 | 1 213 | -25,76 | ||||
| 2026-02-13 | 13F | State Street Corp | 3 988 403 | 4,01 | 135 965 | -21,90 | ||||
| 2026-01-08 | 13F | True Wealth Design, LLC | 675 | 24,77 | 23 | -4,17 | ||||
| 2026-02-12 | 13F | Great Lakes Advisors, Llc | 78 808 | -32,09 | 2 687 | -49,01 | ||||
| 2026-02-13 | 13F | OMERS ADMINISTRATION Corp | 0 | -100,00 | 0 | |||||
| 2026-02-17 | 13F | Schonfeld Strategic Advisors LLC | 139 295 | 56,07 | 4 749 | 17,21 | ||||
| 2025-11-17 | 13F | WJ Wealth Management, LLC | 0 | -100,00 | 0 | |||||
| 2026-02-17 | 13F | Wellington Management Group Llp | 773 817 | -0,40 | 26 379 | -25,21 | ||||
| 2025-11-14 | 13F | SummitTX Capital, L.P. | 0 | -100,00 | 0 | |||||
| 2026-02-13 | 13F | Prudential Financial Inc | 9 341 | 318 | ||||||
| 2026-01-27 | 13F | PFG Advisors | 17 560 | -46,28 | 599 | -59,68 | ||||
| 2026-02-13 | 13F | Victory Capital Management Inc | 8 690 | -90,51 | 296 | -92,88 | ||||
| 2026-02-11 | 13F | Twin Tree Management, LP | Call | 44 100 | 217,27 | 1 503 | 138,19 | |||
| 2026-02-11 | 13F | Twin Tree Management, LP | Put | 7 100 | 242 | |||||
| 2025-10-24 | 13F | Redwood Wealth Management Group, LLC | 0 | -100,00 | 0 | |||||
| 2026-02-13 | 13F | Charles Schwab Investment Management Inc | 496 429 | -8,73 | 16 923 | -31,47 | ||||
| 2026-02-13 | 13F | Herald Investment Management Ltd | 285 000 | 0,00 | 9 713 | -24,94 | ||||
| 2026-02-17 | 13F | Oxford Asset Management Llp | 7 241 | -53,41 | 247 | -65,11 | ||||
| 2026-02-17 | 13F | Fmr Llc | 3 036 209 | -28,31 | 103 504 | -46,17 | ||||
| 2026-02-17 | 13F | Caption Management, LLC | 0 | -100,00 | 0 | |||||
| 2026-02-17 | 13F | Northern Trust Corp | 345 089 | -3,04 | 11 764 | -27,19 | ||||
| 2026-02-12 | 13F | Swiss National Bank | 157 500 | 1,81 | 5 369 | -23,55 | ||||
| 2026-01-29 | 13F | Vanguard Group Inc | 7 717 551 | 0,45 | 263 091 | -24,57 | ||||
| 2025-09-29 | NP | LAGWX - LORD ABBETT DEVELOPING GROWTH FUND INC Class A | 508 040 | -2,56 | 21 134 | 9,67 | ||||
| 2026-02-17 | 13F | Harvest Investment Services, LLC | 0 | -100,00 | 0 | |||||
| 2026-02-10 | 13F | KERR FINANCIAL PLANNING Corp | 6 | 0 | ||||||
| 2026-01-28 | 13F | Eagle Global Advisors Llc | 97 000 | 0,00 | 3 307 | -24,91 | ||||
| 2026-02-13 | 13F | Barclays Plc | 117 343 | -8,43 | 4 000 | -31,24 | ||||
| 2026-02-17 | 13F | Public Employees Retirement System Of Ohio | 22 761 | -3,65 | 776 | -27,71 | ||||
| 2026-01-28 | 13F | WPG Advisers, LLC | 32 | 23,08 | 1 | 0,00 | ||||
| 2026-02-04 | 13F | Ameritas Advisory Services, LLC | 0 | -100,00 | 0 | |||||
| 2026-02-11 | 13F | Meeder Asset Management Inc | 7 655 | 261 | ||||||
| 2026-02-12 | 13F | Cloud Capital Management, LLC | 0 | -100,00 | 0 | |||||
| 2025-11-13 | 13F | Hudson Bay Capital Management LP | 0 | -100,00 | 0 | |||||
| 2026-02-13 | 13F | Pinnacle Wealth Planning Services, Inc. | 1 708 | 58 | ||||||
| 2026-02-17 | 13F | Aster Capital Management (DIFC) Ltd | 2 469 | -66,41 | 84 | -74,77 | ||||
| 2026-02-11 | 13F | Group One Trading, L.p. | 6 754 | 3,38 | 230 | -22,30 | ||||
| 2026-02-12 | 13F | MetLife Investment Management, LLC | 2 671 | 0,11 | 91 | -24,79 | ||||
| 2026-01-20 | 13F | AdvisorNet Financial, Inc | 33 | 0,00 | 1 | 0,00 | ||||
| 2026-02-03 | 13F | Morse Asset Management, Inc | 0 | -100,00 | 0 | |||||
| 2026-02-17 | 13F | Worldquant Millennium Advisors Llc | 66 505 | 29,42 | 2 267 | -2,79 | ||||
| 2026-02-17 | 13F | Mercer Global Advisors Inc /adv | 21 301 | 125,22 | 726 | 69,23 | ||||
| 2026-02-13 | 13F | American Century Companies Inc | 8 455 | -15,08 | 288 | -36,28 | ||||
| 2026-02-17 | 13F | Edmond De Rothschild Holding S.a. | 750 | 0,00 | 26 | -26,47 | ||||
| 2025-11-14 | 13F | Wolverine Trading, Llc | 18 888 | 7,17 | 827 | 4,16 | ||||
| 2025-11-14 | 13F | Wolverine Trading, Llc | Call | 38 000 | 25,00 | 1 663 | 21,40 | |||
| 2025-11-14 | 13F | Wolverine Trading, Llc | Put | 15 000 | 61,29 | 656 | 56,94 | |||
| 2026-02-13 | 13F | Morgan Stanley | 1 197 420 | 114,98 | 40 820 | 61,43 | ||||
| 2026-01-28 | 13F | Universal- Beteiligungs- und Servicegesellschaft mbH | 20 052 | 31,36 | 684 | -1,44 | ||||
| 2026-02-13 | 13F | Smartleaf Asset Management LLC | 21 | 1 | ||||||
| 2026-02-10 | 13F | Axq Capital, Lp | 44 872 | 301,61 | 1 530 | 201,58 | ||||
| 2026-02-13 | 13F | National Bank Of Canada /fi/ | 428 | -68,62 | 15 | -77,05 | ||||
| 2025-09-29 | NP | LFVAX - Lord Abbett Focused Small Cap Value Fund Class A | 23 772 | -42,90 | 989 | -35,76 | ||||
| 2026-02-17 | 13F | Price T Rowe Associates Inc /md/ | 2 100 982 | -18,31 | 72 | -38,79 | ||||
| 2026-02-13 | 13F | Marshall Wace, Llp | 152 900 | 5 212 | ||||||
| 2026-02-13 | 13F | Walleye Capital LLC | Put | 0 | -100,00 | 0 | ||||
| 2026-02-11 | 13F | Parallel Advisors, LLC | 70 | -4,11 | 2 | -33,33 | ||||
| 2026-02-13 | 13F | Walleye Capital LLC | Call | 0 | -100,00 | 0 | ||||
| 2026-02-13 | 13F | Walleye Capital LLC | 0 | -100,00 | 0 | |||||
| 2026-02-17 | 13F | Freestone Grove Partners LP | 41 714 | 1 422 | ||||||
| 2025-11-12 | 13F | Sciencast Management LP | 0 | -100,00 | 0 | |||||
| 2026-02-13 | 13F | Cornerstone Financial Management LLC | 36 | 1 | ||||||
| 2026-02-17 | 13F | Ancora Advisors, LLC | 595 | 20 | ||||||
| 2026-02-17 | 13F | Lazard Asset Management Llc | 40 931 | -58,67 | 1 395 | -68,97 | ||||
| 2026-02-23 | 13F | Virtu Financial LLC | 15 886 | 23,01 | 1 | |||||
| 2026-01-30 | 13F | New York State Teachers Retirement System | 6 909 | 0,00 | 0 | |||||
| 2026-01-12 | 13F | Contravisory Investment Management, Inc. | 355 | 0,00 | 12 | -25,00 | ||||
| 2025-10-22 | 13F | Geneos Wealth Management Inc. | 0 | -100,00 | 0 | -100,00 | ||||
| 2026-01-29 | 13F | Comerica Bank | 850 | -4,28 | 29 | -30,00 | ||||
| 2025-11-14 | 13F | Driehaus Capital Management Llc | 0 | -100,00 | 0 | |||||
| 2026-02-10 | 13F | Envestnet Asset Management Inc | 8 354 | -56,60 | 285 | -67,47 | ||||
| 2026-02-17 | 13F | Engineers Gate Manager LP | 146 985 | 21,12 | 5 011 | -9,06 | ||||
| 2025-11-12 | 13F | Bellwether Advisors, LLC | 0 | -100,00 | 0 | |||||
| 2026-01-29 | 13F | Dunhill Financial, LLC | 2 | 0 | ||||||
| 2026-01-12 | 13F | Silverberg Bernstein Capital Management LLC | 6 890 | -7,39 | 235 | -30,56 | ||||
| 2026-02-12 | 13F | JT Stratford LLC | 26 779 | 3,28 | 913 | -22,51 | ||||
| 2026-02-13 | 13F | Peak6 Llc | 0 | -100,00 | 0 | |||||
| 2026-02-17 | 13F | Signature Equity Partners, LLC | 8 | 0 | ||||||
| 2026-02-13 | 13F | Rhumbline Advisers | 67 558 | -2,30 | 2 303 | -26,63 | ||||
| 2025-09-29 | NP | CFMCX - Column Mid Cap Fund | 1 652 | 0,00 | 69 | -1,45 | ||||
| 2026-01-15 | 13F | Kieckhefer Group Llc | 0 | -100,00 | 0 | |||||
| 2026-02-11 | 13F | Motley Fool Asset Management LLC | 46 254 | -18,35 | 1 577 | -38,70 | ||||
| 2026-02-11 | 13F | Deutsche Bank Ag\ | 530 899 | 203,66 | 18 098 | 128,02 | ||||
| 2026-02-17 | 13F | Quantinno Capital Management LP | 24 958 | 206,72 | 851 | 130,35 | ||||
| 2025-10-30 | 13F | Jennison Associates Llc | 0 | -100,00 | 0 | |||||
| 2026-01-30 | 13F | Activest Wealth Management | 594 | 200,00 | 20 | 150,00 | ||||
| 2026-02-13 | 13F | JustInvest LLC | 10 026 | 18,34 | 342 | -11,20 | ||||
| 2026-02-13 | 13F | First Trust Advisors Lp | 2 411 211 | -34,14 | 82 198 | -50,55 | ||||
| 2026-02-10 | 13F | Norges Bank | 1 099 462 | 37 481 | ||||||
| 2026-02-06 | 13F | Pnc Financial Services Group, Inc. | 1 225 | 5,51 | 42 | -21,15 | ||||
| 2026-02-13 | 13F | Umb Bank N A/mo | 1 010 | 1,00 | 34 | -24,44 | ||||
| 2026-02-13 | 13F | Quarry LP | 857 | 7 041,67 | 29 | |||||
| 2026-02-12 | 13F | Bank Of Montreal /can/ | 19 513 | 1,61 | 665 | -23,65 | ||||
| 2026-02-13 | 13F | Bridgefront Capital, LLC | 30 687 | 1 046 | ||||||
| 2026-02-10 | 13F | CIBC World Markets Inc. | 7 128 | 6,34 | 243 | -20,39 | ||||
| 2026-02-13 | 13F | Stifel Financial Corp | 242 922 | -1,24 | 8 281 | -25,84 | ||||
| 2026-02-04 | 13F | Versor Investments LP | 23 038 | 141,01 | 785 | 81,29 | ||||
| 2026-02-13 | 13F | Peak6 Llc | Call | 0 | -100,00 | 0 | ||||
| 2026-02-10 | 13F | State of Wyoming | 0 | -100,00 | 0 | |||||
| 2026-02-14 | 13F | Militia Capital Partners, LP | 37 400 | 117,44 | 1 275 | 63,33 | ||||
| 2026-02-17 | 13F | Alliancebernstein L.p. | 262 642 | -86,04 | 8 953 | -89,52 | ||||
| 2026-02-12 | 13F | Philadelphia Trust Co | 499 111 | -1,99 | 17 | -26,09 | ||||
| 2026-02-14 | 13F | Rockefeller Capital Management L.P. | 935 | -2,91 | 32 | -27,91 | ||||
| 2026-02-17 | 13F | Prelude Capital Management, Llc | 8 383 | 286 | ||||||
| 2026-01-27 | 13F | TD Waterhouse Canada Inc. | 5 459 | -0,55 | 186 | -23,77 | ||||
| 2026-02-12 | 13F | Wealthspire Advisors, LLC | 0 | -100,00 | 0 | |||||
| 2026-02-12 | 13F | Dimensional Fund Advisors Lp | 1 995 989 | 15,50 | 68 043 | -13,25 | ||||
| 2026-02-12 | 13F | State Board Of Administration Of Florida Retirement System | 60 465 | 5,24 | 2 061 | -20,97 | ||||
| 2026-01-13 | 13F | CoreCap Advisors, LLC | 658 | -94,96 | 22 | -96,28 | ||||
| 2026-02-17 | 13F | Magnetar Financial LLC | 85 124 | 183,78 | 2 902 | 113,15 | ||||
| 2026-01-30 | 13F | Moody Aldrich Partners Llc | 0 | -100,00 | 0 | |||||
| 2026-02-17 | 13F | Credit Agricole S A | 0 | -100,00 | 0 | |||||
| 2026-01-05 | 13F | GAMMA Investing LLC | 698 | -7,06 | 24 | -32,35 | ||||
| 2026-02-11 | 13F | Winton Capital Group Ltd | 21 057 | 718 | ||||||
| 2026-02-17 | 13F | California State Teachers Retirement System | 75 567 | -0,12 | 2 576 | -24,99 | ||||
| 2026-02-11 | 13F | Simplex Trading, Llc | 5 310 | -22,53 | 181 | |||||
| 2026-01-15 | 13F | Fortitude Family Office, LLC | 18 | -68,97 | 1 | -100,00 | ||||
| 2026-01-26 | 13F | KBC Group NV | 3 003 | 0,00 | 0 | |||||
| 2025-11-14 | 13F | Quantessence Capital LLC | 0 | -100,00 | 0 | |||||
| 2026-02-13 | 13F | Ubs Asset Management Americas Inc | 129 966 | 1,85 | 4 431 | -23,53 | ||||
| 2026-02-13 | 13F | Platinum Investment Management Ltd | 0 | -100,00 | 0 | |||||
| 2026-02-17 | 13F | Russell Investments Group, Ltd. | 287 839 | -5,17 | 9 812 | -28,80 | ||||
| 2026-01-27 | 13F | Krilogy Financial LLC | 7 532 | 306 | ||||||
| 2025-11-14 | 13F | Ewing Morris & Co. Investment Partners Ltd. | 0 | -100,00 | 0 | -100,00 | ||||
| 2026-02-17 | 13F | Brevan Howard Capital Management LP | 42 874 | 18,96 | 1 462 | -10,70 | ||||
| 2025-11-21 | 13F | Nebula Research & Development LLC | 0 | -100,00 | 0 | |||||
| 2025-11-14 | 13F | Cubist Systematic Strategies, LLC | 411 979 | 98,23 | 18 704 | 93,63 | ||||
| 2026-01-29 | 13F | Verdence Capital Advisors LLC | 0 | -100,00 | 0 | |||||
| 2026-02-06 | 13F | VSM Wealth Advisory, LLC | 275 | 0,00 | 9 | -25,00 | ||||
| 2025-10-22 | 13F | New England Capital Financial Advisors LLC | 0 | -100,00 | 0 | |||||
| 2026-02-13 | 13F | Pathstone Holdings, LLC | 0 | -100,00 | 0 | |||||
| 2026-02-04 | 13F | Virginia Retirement Systems Et Al | 40 150 | -2,07 | 1 369 | -26,49 | ||||
| 2026-02-06 | 13F | Gsa Capital Partners Llp | 19 568 | 87,65 | 1 | |||||
| 2026-01-28 | 13F | Teacher Retirement System Of Texas | 18 791 | -24,78 | 641 | -43,56 | ||||
| 2026-02-17 | 13F | Blair William & Co/il | 28 487 | -3,94 | 971 | -27,86 | ||||
| 2026-02-09 | 13F | Jackson Creek Investment Advisors LLC | 0 | -100,00 | 0 | |||||
| 2026-02-12 | 13F | Hrt Financial Lp | 104 279 | 52,48 | 4 | 0,00 | ||||
| 2026-02-12 | 13F | Ci Investments Inc. | 0 | -100,00 | 0 | |||||
| 2026-02-12 | 13F | Aviva Plc | 18 039 | 33,08 | 615 | -0,16 | ||||
| 2026-02-11 | 13F | LPL Financial LLC | 129 545 | -9,56 | 4 416 | -32,09 | ||||
| 2026-02-17 | 13F | Numerai GP LLC | 8 939 | 305 | ||||||
| 2026-02-12 | 13F | BlackRock, Inc. | 5 015 296 | 6,19 | 170 971 | -20,26 | ||||
| 2026-02-10 | 13F | JTC Employer Solutions Trusteee Ltd | 1 400 | 0,00 | 0 | |||||
| 2026-02-09 | 13F | Leavell Investment Management, Inc. | 6 000 | -20,00 | 205 | -40,00 | ||||
| 2026-01-23 | 13F | Robeco Institutional Asset Management B.V. | 17 971 | 0,00 | 613 | -24,91 | ||||
| 2026-02-12 | 13F | Nuveen, LLC | 1 190 475 | 34,94 | 40 583 | 1,32 | ||||
| 2026-02-13 | 13F | Bridgewater Associates, LP | 0 | -100,00 | 0 | |||||
| 2026-02-06 | 13F | IFP Advisors, Inc | 1 898 | 181,19 | 65 | 113,33 | ||||
| 2026-02-06 | 13F | Leonteq Securities AG | 1 000 | 34 | ||||||
| 2026-02-10 | 13F | Savant Capital, LLC | 0 | -100,00 | 0 | |||||
| 2026-01-28 | 13F | Arizona State Retirement System | 22 366 | -5,29 | 762 | -28,92 | ||||
| 2026-02-10 | 13F | CIBC Asset Management Inc | 8 226 | 0,00 | 280 | -24,93 | ||||
| 2026-02-03 | 13F | Sequoia Financial Advisors, LLC | 7 228 | 4,66 | 246 | -21,41 | ||||
| 2026-02-10 | 13F | Meitav Dash Investments Ltd | 52 124 | 379,26 | 1 777 | 260,24 | ||||
| 2026-02-17 | 13F | XTX Topco Ltd | 19 794 | 193,33 | 675 | 120,26 | ||||
| 2025-11-13 | 13F | O'shaughnessy Asset Management, Llc | 0 | -100,00 | 0 | |||||
| 2026-02-13 | 13F | MAI Capital Management | 142 | 5 | ||||||
| 2026-02-19 | 13F | Invesco Ltd. | 1 720 244 | -23,56 | 58 643 | -42,60 | ||||
| 2026-02-13 | 13F | Colony Group, LLC | 11 230 | 150,39 | 383 | 88,18 | ||||
| 2026-02-09 | 13F | MRP Capital Investments, LLC | 21 475 | -42,86 | 732 | -58,08 | ||||
| 2025-11-13 | 13F | Mackenzie Financial Corp | 0 | -100,00 | 0 | |||||
| 2026-02-06 | 13F | Pathway Financial Advisers, LLC | 0 | -100,00 | 0 | |||||
| 2025-11-05 | 13F | SOUTH STATE Corp | 0 | -100,00 | 0 | |||||
| 2025-11-14 | 13F | Balyasny Asset Management Llc | 0 | -100,00 | 0 | |||||
| 2025-10-15 | 13F | Brookstone Capital Management | 0 | -100,00 | 0 | |||||
| 2026-01-26 | 13F | Cwm, Llc | 33 640 | -10,71 | 1 | 0,00 | ||||
| 2026-02-13 | 13F | Fieldview Capital Management, LLC | 32 457 | 1 106 | ||||||
| 2026-02-17 | 13F | Creative Planning | 41 179 | 44,32 | 1 404 | 8,34 | ||||
| 2025-11-12 | 13F | Cambridge Investment Research Advisors, Inc. | 0 | -100,00 | 0 | |||||
| 2026-01-23 | 13F | Yorktown Management & Research Co Inc | 7 900 | 0,00 | 269 | -24,86 | ||||
| 2026-01-23 | 13F | Tower View Investment Management & Research LLC | 95 450 | 1,23 | 3 254 | -24,00 | ||||
| 2026-02-05 | 13F | Atria Investments Llc | 0 | -100,00 | 0 | |||||
| 2026-02-17 | 13F | Millennium Management Llc | 1 887 797 | 6,28 | 64 355 | -20,19 | ||||
| 2025-11-17 | 13F | Laurion Capital Management LP | 0 | -100,00 | 0 | |||||
| 2026-02-03 | 13F | Pilgrim Partners Asia Pte Ltd | 1 360 | 46 | ||||||
| 2026-02-03 | 13F | Mitsubishi UFJ Kokusai Asset Management Co., Ltd. | 167 | 0,00 | 6 | -28,57 | ||||
| 2026-01-14 | 13F | Spire Wealth Management | 0 | -100,00 | 0 | |||||
| 2026-02-13 | 13F | Sei Investments Co | 96 159 | -20,63 | 3 278 | -40,42 | ||||
| 2026-02-13 | 13F | Rafferty Asset Management, LLC | 17 736 | -5,26 | 605 | -28,86 | ||||
| 2026-02-18 | 13F | Vident Advisory, LLC | 149 677 | 23,24 | 5 102 | -7,47 | ||||
| 2026-02-13 | 13F | Caxton Associates Llp | 50 350 | 1 716 | ||||||
| 2026-02-06 | 13F | Entrust Financial Llc | 49 | 2 | ||||||
| 2026-02-13 | 13F | Edgestream Partners, L.P. | 364 879 | 128,76 | 12 439 | 71,77 | ||||
| 2026-02-13 | 13F | Dynamic Technology Lab Private Ltd | 7 270 | -64,62 | 248 | -73,42 | ||||
| 2025-11-12 | 13F | Kingsview Wealth Management, LLC | 0 | -100,00 | 0 | |||||
| 2026-02-13 | 13F | Martingale Asset Management L P | 69 849 | -0,60 | 2 381 | -25,36 | ||||
| 2026-02-12 | 13F | Principal Securities, Inc. | 0 | -100,00 | 0 | |||||
| 2026-02-11 | 13F | Cerity Partners LLC | 37 330 | 43,60 | 1 273 | 7,80 | ||||
| 2026-02-13 | 13F | Schroder Investment Management Group | 7 306 | 249 | ||||||
| 2026-02-02 | 13F | Danske Bank A/s | 3 621 | 123 | ||||||
| 2025-11-14 | 13F | Skopos Labs, Inc. | 0 | -100,00 | 0 | |||||
| 2025-11-14 | 13F | Point72 (DIFC) Ltd | 10 484 | 76,62 | 476 | 72,73 | ||||
| 2026-01-14 | 13F | Hennion & Walsh Asset Management, Inc. | 11 965 | -0,99 | 408 | -25,73 | ||||
| 2026-01-29 | 13F | Pictet Asset Management Holding SA | 8 790 | -90,96 | 300 | -93,22 | ||||
| 2026-02-11 | 13F | Buckingham Strategic Partners | 11 486 | 78,71 | 392 | 44,28 | ||||
| 2025-11-13 | 13F | Natixis Advisors, L.p. | 0 | -100,00 | 0 | |||||
| 2026-02-13 | 13F | Toroso Investments, LLC | 0 | -100,00 | 0 | |||||
| 2025-10-15 | 13F | Harbor Capital Advisors, Inc. | 0 | -100,00 | 0 | |||||
| 2025-09-29 | NP | DFEN - Direxion Daily Aerospace & Defense Bull 3X Shares | 16 399 | 14,59 | 682 | 29,17 | ||||
| 2026-02-13 | 13F | Mariner, LLC | 68 802 | 219,25 | 2 345 | 139,78 | ||||
| 2026-02-09 | 13F | Geode Capital Management, Llc | 1 610 691 | 1,12 | 54 923 | -24,07 | ||||
| 2026-02-12 | 13F | BRYN MAWR TRUST Co | 0 | -100,00 | 0 | -100,00 | ||||
| 2026-02-10 | 13F/A | Northwestern Mutual Wealth Management Co | 400 | 0,00 | 14 | -27,78 | ||||
| 2026-01-30 | 13F | Bogart Wealth, LLC | 15 | 1 | ||||||
| 2026-02-06 | 13F | EverSource Wealth Advisors, LLC | 1 191 | -1,57 | 41 | -25,93 | ||||
| 2026-02-13 | 13F | Virtus ETF Advisers LLC | 21 304 | 0,00 | 726 | -24,92 | ||||
| 2025-11-10 | 13F | Empirical Financial Services, LLC d.b.a. Empirical Wealth Management | 0 | -100,00 | 0 | -100,00 | ||||
| 2026-03-06 | 13F | Hsbc Holdings Plc | 17 695 | 605 | ||||||
| 2026-02-06 | 13F | Resona Asset Management Co.,Ltd. | 10 753 | -23,33 | 367 | -42,45 | ||||
| 2026-02-02 | 13F | Total Clarity Wealth Management, Inc. | 6 655 | 0,00 | 227 | -25,17 | ||||
| 2026-02-17 | 13F | Trexquant Investment LP | 394 847 | 43,61 | 13 460 | 7,84 | ||||
| 2025-11-04 | 13F | Penserra Capital Management LLC | 0 | -100,00 | 0 | |||||
| 2026-02-17 | 13F | Cetera Investment Advisers | 14 906 | -45,16 | 508 | -58,80 | ||||
| 2026-02-17 | 13F | Man Group plc | 202 696 | 0,76 | 6 910 | -24,35 | ||||
| 2026-02-17 | 13F | Aquatic Capital Management LLC | 0 | -100,00 | 0 | |||||
| 2026-02-09 | 13F | Huntington National Bank | 220 | 8,91 | 8 | -22,22 | ||||
| 2026-02-12 | 13F | IFC & Insurance Marketing, Inc. | 100 | 0 | ||||||
| 2026-02-13 | 13F | Manufacturers Life Insurance Company, The | 0 | -100,00 | 0 | |||||
| 2026-02-17 | 13F | Qube Research & Technologies Ltd | 1 335 432 | 45,81 | 45 525 | 9,48 | ||||
| 2026-01-16 | 13F | DiNuzzo Private Wealth, Inc. | 15 | -25,00 | 1 | |||||
| 2026-02-13 | 13F | Entropy Technologies, LP | 42 517 | 205,94 | 1 449 | 130,00 | ||||
| 2026-02-02 | 13F | Oppenheimer Asset Management Inc. | 9 634 | -6,49 | 328 | -29,76 | ||||
| 2026-02-06 | 13F | HighTower Advisors, LLC | 10 025 | 0,41 | 342 | -24,72 | ||||
| 2025-11-10 | 13F | Rice Partnership, LLC | 0 | -100,00 | 0 | |||||
| 2025-11-14 | 13F | ExodusPoint Capital Management, LP | 155 579 | 612,91 | 7 063 | 706 200,00 | ||||
| 2026-02-17 | 13F | Susquehanna Fundamental Investments, Llc | 8 546 | 291 | ||||||
| 2026-02-09 | 13F | Catalyst Funds Management Pty Ltd | 5 930 | -60,28 | 202 | -70,16 | ||||
| 2025-10-24 | 13F | Hemington Wealth Management | 230 | -4,56 | 0 | |||||
| 2026-01-26 | 13F | Merit Financial Group, LLC | 7 983 | 272 | ||||||
| 2026-02-13 | 13F | Integrated Wealth Concepts LLC | 0 | -100,00 | 0 | |||||
| 2026-02-09 | 13F | Hartland & Co., LLC | 70 | -89,77 | 2 | -93,55 | ||||
| 2026-02-13 | 13F | Walleye Trading LLC | Call | 9 000 | -41,56 | 307 | -56,22 | |||
| 2026-02-13 | 13F | Walleye Trading LLC | Put | 1 500 | -85,71 | 51 | -89,29 | |||
| 2026-02-04 | 13F | Madison Asset Management, LLC | 105 538 | 0,65 | 3 598 | -24,43 | ||||
| 2026-02-12 | 13F | Steward Partners Investment Advisory, Llc | 575 | 0,00 | 20 | -26,92 | ||||
| 2025-11-14 | 13F | Point72 Hong Kong Ltd | 1 823 | -75,25 | 83 | -76,02 | ||||
| 2026-02-13 | 13F | MYDA Advisors LLC | 0 | -100,00 | 0 | |||||
| 2026-02-19 | 13F/A | T. Rowe Price Investment Management, Inc. | 1 083 052 | -35,79 | 37 | -52,63 | ||||
| 2025-11-14 | 13F | Bayesian Capital Management, LP | 0 | -100,00 | 0 | -100,00 | ||||
| 2026-02-12 | 13F | Voya Investment Management Llc | 1 604 470 | -11,21 | 54 696 | -33,33 | ||||
| 2026-01-27 | 13F | Forum Financial Management, LP | 0 | -100,00 | 0 | |||||
| 2026-02-17 | 13F | Graham Capital Management, L.P. | 10 916 | 372 | ||||||
| 2026-02-17 | 13F | Capital Fund Management S.a. | 126 311 | 65,20 | 4 306 | 24,03 | ||||
| 2026-02-17 | 13F | PharVision Advisers, LLC | 12 693 | 433 | ||||||
| 2026-02-17 | 13F | Advisory Services Network, LLC | 0 | -100,00 | 0 | |||||
| 2026-02-17 | 13F | Citadel Advisors Llc | Put | 46 300 | -51,42 | 1 578 | -63,52 | |||
| 2026-02-13 | 13F | Essex Investment Management Co Llc | 256 862 | -2,17 | 8 756 | -26,54 | ||||
| 2026-02-17 | 13F | Citadel Advisors Llc | Call | 102 800 | -31,92 | 3 504 | -48,88 | |||
| 2026-02-17 | 13F | Citadel Advisors Llc | 273 928 | -11,90 | 9 338 | -33,85 | ||||
| 2026-01-14 | 13F | Pallas Capital Advisors LLC | 5 874 | 200 | ||||||
| 2026-02-12 | 13F | SWAN Capital LLC | 25 | 0,00 | 1 | -100,00 | ||||
| 2026-02-11 | 13F | Fox Run Management, L.l.c. | 12 734 | 32,12 | 434 | -0,69 | ||||
| 2026-01-30 | 13F | State of New Jersey Common Pension Fund D | 0 | -100,00 | 0 | |||||
| 2026-02-13 | 13F | Public Employees Retirement Association Of Colorado | 11 393 | 0,00 | 0 | |||||
| 2026-02-13 | 13F | Aigen Investment Management, Lp | 21 576 | 736 | ||||||
| 2026-02-17 | 13F | Clear Street Markets Llc | 588 | 20 | ||||||
| 2026-01-21 | 13F | Stone House Investment Management, LLC | 0 | -100,00 | 0 | -100,00 | ||||
| 2026-02-13 | 13F | Y-Intercept (Hong Kong) Ltd | 144 156 | 235,38 | 4 914 | 151,87 | ||||
| 2026-02-13 | 13F | Anb Bank | 0 | -100,00 | 0 | |||||
| 2026-02-12 | 13F | CIBC Private Wealth Group, LLC | 200 | 0,00 | 7 | -33,33 | ||||
| 2026-02-13 | 13F | Macquarie Group Ltd | 0 | -100,00 | 0 | |||||
| 2026-02-17 | 13F | Amundi | 11 617 | -4,24 | 396 | -28,05 | ||||
| 2025-10-16 | 13F | Highland Capital Management, Llc | 0 | -100,00 | 0 | |||||
| 2026-02-06 | 13F | Cullen/frost Bankers, Inc. | 0 | -100,00 | 0 | |||||
| 2025-11-14 | 13F | EAM Global Investors LLC | 0 | -100,00 | 0 | |||||
| 2026-02-12 | 13F | Renaissance Technologies Llc | 265 394 | -30,52 | 9 047 | -47,83 | ||||
| 2026-02-17 | 13F | Susquehanna International Group, Llp | 82 557 | -30,98 | 2 814 | -48,18 | ||||
| 2026-01-27 | 13F | Zurcher Kantonalbank (Zurich Cantonalbank) | 37 723 | 1 286 | ||||||
| 2026-02-17 | 13F | Susquehanna International Group, Llp | Put | 35 200 | -27,72 | 1 200 | -45,75 | |||
| 2026-02-13 | 13F | Ieq Capital, Llc | 116 102 | 315,48 | 3 958 | 212,07 | ||||
| 2026-02-17 | 13F | Polymer Capital Management (US) LLC | 0 | -100,00 | 0 | |||||
| 2026-02-03 | 13F | International Assets Investment Management, Llc | 100 | 3 | ||||||
| 2025-11-14 | 13F | Two Sigma Advisers, Lp | 0 | -100,00 | 0 | |||||
| 2026-02-11 | 13F | Ramirez Asset Management, Inc. | 117 | 4 | ||||||
| 2026-02-17 | 13F | Voloridge Investment Management, Llc | 607 029 | 110,02 | 20 694 | 57,70 | ||||
| 2026-01-07 | 13F | Massmutual Trust Co Fsb/adv | 394 | 21,60 | 13 | -7,14 | ||||
| 2026-02-06 | 13F | Covestor Ltd | 4 447 | 17,55 | 0 | |||||
| 2025-11-14 | 13F | Centiva Capital, LP | 0 | -100,00 | 0 | |||||
| 2026-02-17 | 13F | Susquehanna International Group, Llp | Call | 98 900 | -45,36 | 3 372 | -58,98 | |||
| 2026-02-17 | 13F | Bank Of America Corp /de/ | 591 112 | -59,34 | 20 151 | -69,47 | ||||
| 2026-02-10 | 13F | Root Financial Partners, LLC | 227 | -30,37 | 8 | -50,00 | ||||
| 2025-09-29 | NP | SAWS - AAM SAWGRASS U.S. SMALL CAP QUALITY GROWTH ETF | 529 | 59,82 | 22 | 83,33 | ||||
| 2026-02-10 | 13F | IAG Wealth Partners, LLC | 400 | 0,00 | 14 | -27,78 | ||||
| 2025-11-14 | 13F | Maxi Investments CY Ltd | 0 | -100,00 | 0 | |||||
| 2026-02-06 | 13F | Csenge Advisory Group | 13 453 | 17,29 | 459 | -11,92 | ||||
| 2026-02-17 | 13F | Aqr Capital Management Llc | 2 255 400 | 77,11 | 76 887 | 37,30 | ||||
| 2026-01-20 | 13F | Signaturefd, Llc | 333 | 197,32 | 11 | 120,00 | ||||
| 2026-02-05 | 13F | Stephens Inc /ar/ | 12 165 | 3,30 | 415 | -22,47 | ||||
| 2026-02-17 | 13F | Tudor Investment Corp Et Al | Call | 11 700 | 116,67 | 399 | 62,45 | |||
| 2026-02-12 | 13F | Counterpoint Mutual Funds LLC | 0 | -100,00 | 0 | |||||
| 2026-02-09 | 13F | Keating Financial Advisory Services, Inc. | 48 | 2 | ||||||
| 2026-02-11 | 13F | Erste Asset Management GmbH | 142 750 | 4 872 | ||||||
| 2026-02-17 | 13F | Point72 Asset Management, L.P. | 869 364 | 2 469,27 | 29 637 | 1 829,43 | ||||
| 2026-02-06 | 13F | Larson Financial Group LLC | 208 | 141,86 | 7 | 133,33 | ||||
| 2026-02-17 | 13F | Tudor Investment Corp Et Al | 411 278 | 86,90 | 14 020 | 40,34 | ||||
| 2026-02-12 | 13F | Quadrant Capital Group Llc | 13 | 0 | ||||||
| 2025-09-29 | NP | CFSLX - Column Small Cap Fund | 6 041 | -63,46 | 252 | -64,09 | ||||
| 2026-02-10 | 13F | Rothschild Investment Llc | 733 | -58,19 | 25 | -69,62 | ||||
| 2026-02-06 | 13F | Tortoise Investment Management, LLC | 0 | -100,00 | 0 | |||||
| 2026-02-09 | 13F/A | Swedbank AB | 96 205 | 1 025,99 | 3 280 | 747,29 | ||||
| 2026-02-13 | 13F | Police & Firemen's Retirement System of New Jersey | 32 698 | 0,58 | 1 115 | -24,47 | ||||
| 2025-11-10 | 13F | O'Neil Global Advisors, Inc. | 0 | -100,00 | 0 | -100,00 | ||||
| 2026-02-12 | 13F | Federation des caisses Desjardins du Quebec | 9 550 | -0,77 | 326 | -25,46 | ||||
| 2026-02-12 | 13F | Campbell & CO Investment Adviser LLC | 111 045 | 3 786 | ||||||
| 2026-02-05 | 13F | Amalgamated Bank | 5 832 | 10,14 | 0 | |||||
| 2026-02-09 | 13F | Royce & Associates Lp | 296 759 | -2,51 | 10 117 | -26,80 | ||||
| 2026-02-13 | 13F | Verition Fund Management LLC | 12 392 | 42,91 | 422 | 7,38 | ||||
| 2025-11-14 | 13F | EAM Investors, LLC | 0 | -100,00 | 0 | |||||
| 2026-01-08 | 13F | Wealth Enhancement Advisory Services, Llc | 33 191 | 110,38 | 1 243 | 76,31 | ||||
| 2025-09-29 | NP | KCXIX - Knights of Columbus U.S. All Cap Index Fund I Shares | 339 | 10,42 | 14 | 27,27 | ||||
| 2026-01-15 | 13F | Nisa Investment Advisors, Llc | 117 | -83,77 | 4 | -90,62 | ||||
| 2026-02-13 | 13F | Kestra Advisory Services, LLC | 1 406 | 48 | ||||||
| 2026-02-13 | 13F | Clal Insurance Enterprises Holdings Ltd | 90 | 0,00 | 0 | |||||
| 2026-02-10 | 13F | Daiwa Securities Group Inc. | 7 533 | 0,00 | 0 | |||||
| 2026-01-29 | 13F | UBS Group AG | 870 543 | 22,34 | 29 677 | -8,14 | ||||
| 2026-02-13 | 13F | Brown Advisory Inc | 8 176 | -0,45 | 279 | -25,27 | ||||
| 2026-02-13 | 13F | Natixis | 60 597 | 16 411,44 | 2 066 | 12 806,25 | ||||
| 2025-11-13 | 13F | Farringdon Capital, Ltd. | 0 | -100,00 | 0 | |||||
| 2026-01-21 | 13F | SJS Investment Consulting Inc. | 173 | 917,65 | 6 | |||||
| 2026-02-17 | 13F | Occudo Quantitative Strategies Lp | 110 505 | 84,21 | 3 767 | 38,34 | ||||
| 2026-02-12 | 13F | Xponance, Inc. | 6 726 | 3,60 | 229 | -22,11 | ||||
| 2026-02-09 | 13F | Atlantic Trust, LLC | 0 | -100,00 | 0 | |||||
| 2025-11-06 | 13F | Aspect Partners, LLC | 0 | -100,00 | 0 | |||||
| 2026-02-17 | 13F | FIL Ltd | 34 429 | 3,12 | 1 174 | -22,57 | ||||
| 2026-02-17 | 13F | Capstone Investment Advisors, Llc | 0 | -100,00 | 0 | -100,00 | ||||
| 2026-02-17 | 13F | Algert Global Llc | 292 211 | -36,46 | 10 | -55,00 | ||||
| 2025-11-06 | 13F | Oppenheimer & Co Inc | 0 | -100,00 | 0 | |||||
| 2026-02-17 | 13F | D. E. Shaw & Co., Inc. | 1 043 175 | 748,50 | 35 562 | 537,18 | ||||
| 2026-02-09 | 13F | Quest Partners LLC | 69 161 | 76,31 | 2 358 | 32,42 | ||||
| 2026-02-05 | 13F | Allworth Financial LP | 1 063 | 20,52 | 36 | -10,00 | ||||
| 2025-11-14 | 13F | Mount Yale Investment Advisors, LLC | 0 | -100,00 | 0 | -100,00 | ||||
| 2026-02-13 | 13F | Treasurer of the State of North Carolina | 31 688 | -6,80 | 1 | 0,00 | ||||
| 2026-02-13 | 13F | Van Eck Associates Corp | 1 723 069 | -5,33 | 59 | -29,27 | ||||
| 2026-02-17 | 13F | Scientech Research LLC | 0 | -100,00 | 0 | |||||
| 2026-01-23 | 13F | Sumitomo Mitsui Trust Holdings, Inc. | 6 465 | 0,00 | 220 | -24,91 | ||||
| 2026-02-13 | 13F | Transamerica Financial Advisors, Inc. | 4 | 0 | ||||||
| 2025-11-14 | 13F | Weiss Asset Management LP | 0 | -100,00 | 0 | -100,00 | ||||
| 2026-02-17 | 13F | Jain Global LLC | 20 868 | 711 | ||||||
| 2026-02-17 | 13F | Ameriprise Financial Inc | 0 | -100,00 | 0 | |||||
| 2026-01-15 | 13F | Allspring Global Investments Holdings, LLC | 0 | -100,00 | 0 | |||||
| 2026-02-09 | 13F | MQS Management LLC | 0 | -100,00 | 0 | |||||
| 2026-02-17 | 13F | Silvercrest Asset Management Group Llc | 21 638 | -9,02 | 738 | -31,70 | ||||
| 2026-02-17 | 13F | Summit Trail Advisors, Llc | 13 790 | 17,96 | 470 | -11,32 | ||||
| 2026-01-05 | 13F | Union Bancaire Privee, UBP SA | 33 205 | 15,04 | 915 | -11,08 | ||||
| 2026-02-10 | 13F | Acadian Asset Management Llc | 12 456 | -76,54 | 0 | -100,00 | ||||
| 2025-11-14 | 13F | Susquehanna Portfolio Strategies, LLC | 0 | -100,00 | 0 | -100,00 | ||||
| 2025-11-13 | 13F | Arrowstreet Capital, Limited Partnership | 0 | -100,00 | 0 | |||||
| 2026-01-12 | 13F | Rialto Wealth Management, LLC | 10 | 11,11 | 0 | |||||
| 2026-02-10 | 13F | Bank of New York Mellon Corp | 501 817 | 129,76 | 17 107 | 72,53 | ||||
| 2026-02-11 | 13F | Jpmorgan Chase & Co | 951 356 | 19,30 | 32 432 | -10,42 | ||||
| 2026-02-17 | 13F | Tower Research Capital LLC (TRC) | 1 202 | -27,50 | 41 | -46,67 | ||||
| 2026-02-09 | 13F | Penn Capital Management Co Inc | 36 293 | -20,90 | 1 260 | -40,47 | ||||
| 2026-02-11 | 13F | Los Angeles Capital Management Llc | 601 245 | 76,56 | 21 675 | 40,20 | ||||
| 2026-02-04 | 13F | Atlantic Union Bankshares Corp | 1 500 | 0,00 | 51 | -25,00 | ||||
| 2025-11-13 | 13F | Jefferies Financial Group Inc. | 0 | -100,00 | 0 | -100,00 | ||||
| 2025-11-04 | 13F | Principal Financial Group Inc | 0 | -100,00 | 0 | |||||
| 2026-01-29 | 13F | UMA Financial Services, Inc. | 55 | 2 | ||||||
| 2026-02-17 | 13F | Munro Partners | 328 095 | 92,61 | 11 185 | 44,63 | ||||
| 2025-11-06 | 13F | CAPROCK Group, Inc. | 0 | -100,00 | 0 | |||||
| 2026-02-12 | 13F | New York State Common Retirement Fund | 39 035 | 0,00 | 1 331 | -24,94 | ||||
| 2026-01-13 | 13F | Matrix Trust Co | 0 | -100,00 | 0 | |||||
| 2026-02-11 | 13F | Twin Tree Management, LP | 0 | -100,00 | 0 | -100,00 | ||||
| 2026-02-17 | 13F | Capital Fund Management S.a. | Call | 0 | -100,00 | 0 | ||||
| 2025-09-29 | NP | PRFZ - Invesco FTSE RAFI US 1500 Small-Mid ETF This fund is a listed as child fund of Invesco Ltd. and if that institution has disclosed ownership in this security, then these positions will not be double counted when calculating total shares and total value | 69 935 | -12,46 | 2 909 | -1,46 | ||||
| 2026-01-29 | 13F | Huntleigh Advisors, Inc. | 81 146 | 2,68 | 2 766 | -22,89 | ||||
| 2026-02-10 | 13F | Quantbot Technologies LP | 81 149 | 8,78 | 2 766 | -18,31 | ||||
| 2026-02-17 | 13F | Jump Financial, LLC | 49 470 | 10,98 | 1 686 | -16,66 | ||||
| 2026-02-13 | 13F | Wells Fargo & Company/mn | 27 663 | -61,73 | 943 | -71,26 | ||||
| 2026-02-13 | 13F | Caitong International Asset Management Co., Ltd | 186 | 3 620,00 | 6 | |||||
| 2026-02-13 | 13F | Sterling Capital Management LLC | 2 928 | 1,60 | 100 | -23,85 | ||||
| 2025-11-12 | 13F | First Eagle Investment Management, LLC | 0 | -100,00 | 0 | |||||
| 2026-01-21 | 13F | Y.D. More Investments Ltd | 298 000 | 0,00 | 10 159 | -24,92 | ||||
| 2026-02-02 | 13F | Strs Ohio | 1 811 | 0,17 | 62 | -25,61 | ||||
| 2026-02-20 | 13F | Sunbelt Securities, Inc. | 0 | -100,00 | 0 | |||||
| 2026-02-05 | 13F | HFM Investment Advisors, LLC | 6 | -33,33 | 0 |
Other Listings
| US:DRS | 46,53 USD |