Esquire Financial Holdings, Inc.
Wstęp
Ta strona zawiera kompleksową analizę znanej historii wykorzystywania informacji poufnych w firmie Selig Zises. Insiderzy to członkowie kadry kierowniczej, dyrektorzy lub znaczący inwestorzy w spółce. Dokonywanie transakcji w ich firmach w oparciu o określone, niepubliczne informacje jest nielegalne. Nie oznacza to, że dokonywanie jakichkolwiek transakcji we własnych firmach jest nielegalne. Muszą jednak zgłaszać wszystkie transakcje do SEC za pośrednictwem formularza 4. Pomimo tych ograniczeń badania akademickie sugerują, że insiderzy – ogólnie rzecz biorąc – mają tendencję do osiągania lepszych wyników na rynku w swoich własnych firmach.
Średnia rentowność handlu
Średnia rentowność handlu to średni zwrot ze wszystkich zakupów na otwartym rynku dokonanych przez osobę mającą dostęp do informacji poufnych w ciągu ostatnich trzech lat. Aby to obliczyć, badamy każdy nieplanowany zakup na otwartym rynku dokonany przez insidera, z wyłączeniem wszystkich transakcji oznaczonych jako część planu handlowego 10b5-1. Następnie obliczamy średnią wydajność tych transakcji w ciągu 3, 6 i 12 miesięcy, uśredniając każdy z tych okresów, aby wygenerować ostateczny wskaźnik wydajności dla każdej transakcji. Na koniec uśredniamy wszystkie wskaźniki wydajności, aby obliczyć wskaźnik wydajności dla insidera. Na tej liście znajdują się wyłącznie insiderzy, którzy dokonali co najmniej trzech transakcji w ciągu ostatnich dwóch lat.
Jeśli rentowność handlu insiderów jest oznaczona notką„nie dotyczy”, oznacza to, że insider albo nie dokonał żadnych zakupów na otwartym rynku w ciągu ostatnich trzech lat, albo transakcje, których dokonał, są zbyt nowe, aby obliczyć wiarygodny wskaźnik wydajności.
Częstotliwość aktualizacji: codziennie
Spółki posiadające zgłoszone stanowiska osób mających dostęp do poufnych informacji
Z dokumentów SEC wynika, że Selig Zises zgłosił udziały lub transakcje w następujących spółkach:
| Papier wartościowy | Nazwa | Najnowsze raporty dotyczące udziałów |
|---|---|---|
| US:ESQ / Esquire Financial Holdings, Inc. | Director | 63 533 |
Jak interpretować wykresy
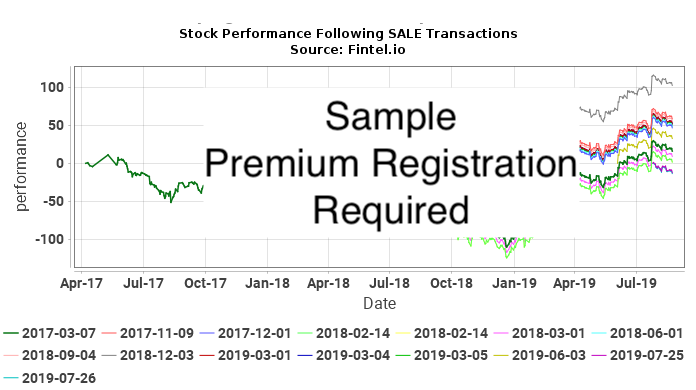
Poniższe wykresy przedstawiają notowania akcji papierów wartościowych po każdej niezaplanowanej transakcji na otwartym rynku dokonanej przez Selig Zises. Nieplanowane transakcje to transakcje, które nie zostały dokonane w ramach planu handlowego 10b5-1. Notowania akcji przedstawiono na wykresie jako skumulowaną procentową zmianę ceny akcji. Na przykład, jeśli 1 stycznia 2019 r. dokonano transakcji poufnej, wykres pokaże dzienną procentową zmianę papieru wartościowego do dnia dzisiejszego. Jeżeli cena akcji wzrosłaby w tym czasie z 10 do 15 dolarów, skumulowana procentowa zmiana ceny akcji wyniosłaby 50%. Zmiana ceny z 10$ na 20$ będzie wynosić 100%, a zmiana ceny z 10$ na 5$ będzie wynosić -50%.
Ostatecznie staramy się określić, jak blisko transakcje insiderów korelują z nadmiernymi zwrotami (dodatnimi lub ujemnymi) z ceny akcji, aby sprawdzić, czy insider dostosowuje swoje transakcje w taki sposób, aby czerpać korzyści z informacji poufnych. Rozważmy sytuację, w której zrobił to ktoś z wewnątrz. W tej sytuacji oczekiwalibyśmy albo (a) dodatnich zwrotów po zakupach, albo (b) ujemnych zwrotów po sprzedaży. W przypadku (a) wykres ZAKUPU pokazywałby serię krzywych nachylonych w górę, wskazujących dodatnie zwroty po każdej transakcji zakupu. W przypadku (b) wykres SPRZEDAŻ pokazywałby serię krzywych o nachyleniu w dół, wskazujących ujemne zwroty po każdej transakcji sprzedaży.
Samo to jednak nie wystarczy, aby wyciągnąć wnioski. Gdyby np. cena akcji spółki przez wiele lat rosła niecyklicznie, to spodziewalibyśmy się, że wszystkie wykresy po zakupie będą wykazywały tendencję wzrostową. Podobnie niecykliczne spadki na przestrzeni wielu lat spowodowałyby spadek linii na wykresie po transakcjach. Żaden z tych wykresów nie sugeruje wykorzystywania informacji poufnych.
Najsilniejszym wskaźnikiem byłaby sytuacja, gdy cena akcji miała charakter wyjątkowo cykliczny, a na wykresie KUPNO występowały zarówno pozytywne sygnały na wykresie KUPNA, jak i negatywne na wykresie SPRZEDAŻY. Sytuacja ta wysoce sugerowałaby osobę mającą dostęp do informacji poufnych, która wykorzystywała transakcje w celu uzyskania korzyści finansowej.
Zakupy insidera ESQ / Esquire Financial Holdings, Inc. – krótkoterminowa analiza zysków
W tej części analizujemy rentowność każdego nieplanowanego zakupu od poufnych informacji na otwartym rynku dokonanego w ESQ / Esquire Financial Holdings, Inc.. Analiza ta pomaga zrozumieć, czy insider konsekwentnie generuje nietypowe zyski i czy warto ją śledzić. Analiza ta obejmuje okres jednego roku po każdej transakcji, a wyniki mają charakter teoretyczny .
Poniższa tabela przedstawia najnowsze zakupy na otwartym rynku, które nie były częścią planu handlu automatycznego.
Cena skorygowana to cena skorygowana o podział. Akcje skorygowane to akcje skorygowane o podział.
Sprzedaż insidera ESQ / Esquire Financial Holdings, Inc. — analiza strat krótkoterminowych
W tej sekcji analizujemy możliwość uniknięcia krótkoterminowych strat w wyniku każdej nieplanowanej sprzedaży poufnych informacji na otwartym rynku dokonanej w ESQ / Esquire Financial Holdings, Inc.. Konsekwentny wzorzec unikania strat może sugerować, że przyszłe transakcje sprzedaży mogą przewidywać spadki cen. Analiza ta obejmuje okres jednego roku po każdej transakcji, a wyniki mają charakter teoretyczny .
Poniższa tabela przedstawia najnowsze sprzedaże na otwartym rynku, które nie były częścią planu handlu automatycznego.
Cena skorygowana to cena skorygowana o podział. Akcje skorygowane to akcje skorygowane o podział.
Historia handlu insiderów
Ta tabela przedstawia pełną listę transakcji insiderów dokonanych przez firmę Selig Zises ujawnioną Komisji Papierów Wartościowych (SEC).
| Data pliku | Data trans | Formularz | Ticker | Bezpieczeństwo | Kod | Akcje | Pozostałe akcje | Zmiana procent |
Cena udziału |
Wartość trans |
Pozostała Wartość |
|
|---|---|---|---|---|---|---|---|---|---|---|---|---|
| 2026-03-20 |
|
4 | ESQ |
Esquire Financial Holdings, Inc.
Common Stock |
S - Sale | -3 000 | 63 533 | -4,51 | 105,00 | -315 000 | 6 670 965 | |
| 2026-03-20 |
|
4 | ESQ |
Esquire Financial Holdings, Inc.
Common Stock |
S - Sale | -2 000 | 6 501 | -23,53 | 105,25 | -210 500 | 684 230 | |
| 2026-03-20 |
|
4 | ESQ |
Esquire Financial Holdings, Inc.
Common Stock |
S - Sale | -1 000 | 66 533 | -1,48 | 107,26 | -107 255 | 7 136 024 | |
| 2026-03-20 |
|
4 | ESQ |
Esquire Financial Holdings, Inc.
Common Stock |
S - Sale | -3 000 | 67 533 | -4,25 | 107,25 | -321 750 | 7 242 914 | |
| 2026-03-20 |
|
4 | ESQ |
Esquire Financial Holdings, Inc.
Common Stock |
S - Sale | -2 000 | 70 533 | -2,76 | 107,13 | -214 250 | 7 555 855 | |
| 2026-03-20 |
|
4 | ESQ |
Esquire Financial Holdings, Inc.
Common Stock |
S - Sale | -1 500 | 72 533 | -2,03 | 107,01 | -160 515 | 7 761 756 | |
| 2026-03-20 |
|
4 | ESQ |
Esquire Financial Holdings, Inc.
Common Stock |
S - Sale | -1 500 | 74 033 | -1,99 | 106,08 | -159 120 | 7 853 428 | |
| 2026-03-20 |
|
4 | ESQ |
Esquire Financial Holdings, Inc.
Common Stock |
S - Sale | -2 000 | 75 533 | -2,58 | 105,16 | -210 327 | 7 943 322 | |
| 2026-03-20 |
|
4 | ESQ |
Esquire Financial Holdings, Inc.
Common Stock |
S - Sale | -1 500 | 77 533 | -1,90 | 105,11 | -157 672 | 8 149 858 | |
| 2026-03-20 |
|
4 | ESQ |
Esquire Financial Holdings, Inc.
Common Stock |
S - Sale | -2 000 | 8 501 | -19,05 | 106,04 | -212 086 | 901 472 | |
| 2026-03-20 |
|
4 | ESQ |
Esquire Financial Holdings, Inc.
Common Stock |
S - Sale | -2 000 | 10 501 | -16,00 | 105,54 | -211 070 | 1 108 223 | |
| 2026-03-20 |
|
4 | ESQ |
Esquire Financial Holdings, Inc.
Common Stock |
S - Sale | -8 500 | 12 501 | -40,47 | 107,00 | -909 500 | 1 337 607 | |
| 2025-12-16 |
|
4 | ESQ |
Esquire Financial Holdings, Inc.
Common Stock |
A - Award | 753 | 15 716 | 5,03 | ||||
| 2025-08-26 |
|
4 | ESQ |
Esquire Financial Holdings, Inc.
Common Stock |
S - Sale | -1 500 | 79 033 | -1,86 | 99,94 | -149 910 | 7 898 558 | |
| 2025-08-26 |
|
4 | ESQ |
Esquire Financial Holdings, Inc.
Common Stock |
S - Sale | -1 500 | 79 033 | -1,86 | 99,94 | -149 910 | 7 898 558 | |
| 2025-08-26 |
|
4 | ESQ |
Esquire Financial Holdings, Inc.
Common Stock |
S - Sale | -1 500 | 80 533 | -1,83 | 99,67 | -149 500 | 8 026 442 | |
| 2025-08-26 |
|
4 | ESQ |
Esquire Financial Holdings, Inc.
Common Stock |
S - Sale | -1 500 | 82 033 | -1,80 | 99,64 | -149 461 | 8 173 826 | |
| 2025-08-26 |
|
4 | ESQ |
Esquire Financial Holdings, Inc.
Common Stock |
S - Sale | -1 500 | 83 533 | -1,76 | 99,57 | -149 359 | 8 317 590 | |
| 2025-08-26 |
|
4 | ESQ |
Esquire Financial Holdings, Inc.
Common Stock |
S - Sale | -1 500 | 85 033 | -1,73 | 99,53 | -149 290 | 8 463 037 | |
| 2025-08-26 |
|
4 | ESQ |
Esquire Financial Holdings, Inc.
Common Stock |
S - Sale | -1 000 | 86 533 | -1,14 | 99,45 | -99 449 | 8 605 655 | |
| 2025-08-26 |
|
4 | ESQ |
Esquire Financial Holdings, Inc.
Common Stock |
S - Sale | -1 500 | 21 001 | -6,67 | 100,00 | -150 000 | 2 100 100 | |
| 2025-08-26 |
|
4 | ESQ |
Esquire Financial Holdings, Inc.
Common Stock |
S - Sale | -1 500 | 24 001 | -5,88 | 99,80 | -149 692 | 2 395 180 | |
| 2025-08-26 |
|
4 | ESQ |
Esquire Financial Holdings, Inc.
Common Stock |
S - Sale | -1 000 | 25 501 | -3,77 | 99,76 | -99 757 | 2 543 906 | |
| 2025-08-26 |
|
4 | ESQ |
Esquire Financial Holdings, Inc.
Common Stock |
S - Sale | -1 500 | 26 501 | -5,36 | 99,64 | -149 457 | 2 640 512 | |
| 2025-08-26 |
|
4 | ESQ |
Esquire Financial Holdings, Inc.
Common Stock |
S - Sale | -1 500 | 28 001 | -5,08 | 99,54 | -149 310 | 2 787 220 | |
| 2025-08-01 |
|
4 | ESQ |
Esquire Financial Holdings, Inc.
Common Stock |
S - Sale | -1 500 | 87 533 | -1,68 | 95,68 | -143 512 | 8 374 720 | |
| 2025-08-01 |
|
4 | ESQ |
Esquire Financial Holdings, Inc.
Common Stock |
S - Sale | -1 500 | 89 033 | -1,66 | 95,31 | -142 962 | 8 485 539 | |
| 2025-08-01 |
|
4 | ESQ |
Esquire Financial Holdings, Inc.
Common Stock |
S - Sale | -1 000 | 90 533 | -1,09 | 95,25 | -95 250 | 8 623 268 | |
| 2025-08-01 |
|
4 | ESQ |
Esquire Financial Holdings, Inc.
Common Stock |
S - Sale | -1 000 | 29 501 | -3,28 | 95,20 | -95 200 | 2 808 495 | |
| 2025-05-01 |
|
4 | ESQ |
Esquire Financial Holdings, Inc.
Common Stock |
S - Sale | -2 000 | 91 533 | -2,14 | 84,34 | -168 673 | 7 719 591 | |
| 2025-05-01 |
|
4 | ESQ |
Esquire Financial Holdings, Inc.
Common Stock |
S - Sale | -2 000 | 93 533 | -2,09 | 84,30 | -168 609 | 7 885 262 | |
| 2025-05-01 |
|
4 | ESQ |
Esquire Financial Holdings, Inc.
Common Stock |
S - Sale | -2 000 | 95 533 | -2,05 | 84,00 | -168 000 | 8 024 772 | |
| 2025-05-01 |
|
4 | ESQ |
Esquire Financial Holdings, Inc.
Common Stock |
S - Sale | -2 000 | 97 533 | -2,01 | 83,95 | -167 900 | 8 187 895 | |
| 2025-05-01 |
|
4 | ESQ |
Esquire Financial Holdings, Inc.
Common Stock |
S - Sale | -2 000 | 30 501 | -6,15 | 84,02 | -168 031 | 2 562 563 | |
| 2025-05-01 |
|
4 | ESQ |
Esquire Financial Holdings, Inc.
Common Stock |
S - Sale | -1 500 | 32 501 | -4,41 | 84,00 | -126 000 | 2 730 084 | |
| 2025-05-01 |
|
4 | ESQ |
Esquire Financial Holdings, Inc.
Common Stock |
S - Sale | -1 500 | 34 001 | -4,23 | 83,95 | -125 925 | 2 854 384 | |
| 2025-03-04 |
|
4 | ESQ |
Esquire Financial Holdings, Inc.
Common Stock |
S - Sale | -1 500 | 35 501 | -4,05 | 78,32 | -117 481 | 2 780 456 | |
| 2025-03-04 |
|
4 | ESQ |
Esquire Financial Holdings, Inc.
Common Stock |
S - Sale | -4 500 | 37 001 | -10,84 | 77,80 | -350 100 | 2 878 678 | |
| 2025-03-04 |
|
4 | ESQ |
Esquire Financial Holdings, Inc.
Common Stock |
S - Sale | -1 500 | 41 501 | -3,49 | 77,75 | -116 625 | 3 226 703 | |
| 2025-03-04 |
|
4 | ESQ |
Esquire Financial Holdings, Inc.
Common Stock |
S - Sale | -3 000 | 43 001 | -6,52 | 77,70 | -233 100 | 3 341 178 | |
| 2025-03-04 |
|
4 | ESQ |
Esquire Financial Holdings, Inc.
Common Stock |
S - Sale | -1 000 | 46 001 | -2,13 | 77,67 | -77 672 | 3 572 967 | |
| 2025-03-04 |
|
4 | ESQ |
Esquire Financial Holdings, Inc.
Common Stock |
S - Sale | -1 500 | 47 001 | -3,09 | 77,65 | -116 479 | 3 649 755 | |
| 2025-03-04 |
|
4 | ESQ |
Esquire Financial Holdings, Inc.
Common Stock |
S - Sale | -1 500 | 48 501 | -3,00 | 77,60 | -116 400 | 3 763 678 | |
| 2025-03-04 |
|
4 | ESQ |
Esquire Financial Holdings, Inc.
Common Stock |
S - Sale | -1 500 | 50 001 | -2,91 | 77,30 | -115 957 | 3 865 322 | |
| 2025-03-04 |
|
4 | ESQ |
Esquire Financial Holdings, Inc.
Common Stock |
S - Sale | -1 500 | 51 501 | -2,83 | 77,20 | -115 800 | 3 975 877 | |
| 2025-03-04 |
|
4 | ESQ |
Esquire Financial Holdings, Inc.
Common Stock |
S - Sale | -1 500 | 53 001 | -2,75 | 76,97 | -115 455 | 4 079 487 | |
| 2025-03-04 |
|
4 | ESQ |
Esquire Financial Holdings, Inc.
Common Stock |
S - Sale | -1 000 | 54 501 | -1,80 | 76,70 | -76 700 | 4 180 227 | |
| 2025-02-27 |
|
4/A | ESQ |
Esquire Financial Holdings, Inc.
Common Stock |
G - Gift | -900 | 99 533 | -0,90 | ||||
| 2025-02-27 |
|
4/A | ESQ |
Esquire Financial Holdings, Inc.
Common Stock |
G - Gift | -2 000 | 100 433 | -1,95 | ||||
| 2025-02-27 |
|
4/A | ESQ |
Esquire Financial Holdings, Inc.
Common Stock |
G - Gift | -2 100 | 14 963 | -12,31 | ||||
| 2025-02-27 |
|
4/A | ESQ |
Esquire Financial Holdings, Inc.
Common Stock |
G - Gift | 2 100 | 17 036 | 14,06 | ||||
| 2025-02-27 |
|
4/A | ESQ |
Esquire Financial Holdings, Inc.
Common Stock |
G - Gift | -2 100 | 55 501 | -3,65 | ||||
| 2025-01-10 |
|
4 | ESQ |
Esquire Financial Holdings, Inc.
Common Stock |
G - Gift | -900 | 99 533 | -0,90 | ||||
| 2025-01-10 |
|
4 | ESQ |
Esquire Financial Holdings, Inc.
Common Stock |
G - Gift | -2 000 | 100 433 | -1,95 | ||||
| 2025-01-10 |
|
4 | ESQ |
Esquire Financial Holdings, Inc.
Common Stock |
G - Gift | -2 100 | 14 963 | -12,31 | ||||
| 2025-01-10 |
|
4 | ESQ |
Esquire Financial Holdings, Inc.
Common Stock |
G - Gift | 2 100 | 17 036 | 14,06 | ||||
| 2025-01-10 |
|
4 | ESQ |
Esquire Financial Holdings, Inc.
Common Stock |
G - Gift | -2 100 | 55 501 | -3,65 | ||||
| 2024-12-18 |
|
4 | ESQ |
Esquire Financial Holdings, Inc.
Common Stock |
S - Sale | -1 000 | 57 601 | -1,71 | 78,25 | -78 253 | 4 507 457 | |
| 2024-12-18 |
|
4 | ESQ |
Esquire Financial Holdings, Inc.
Common Stock |
S - Sale | -1 000 | 58 601 | -1,68 | 78,02 | -78 019 | 4 571 980 | |
| 2024-12-04 |
|
4 | ESQ |
Esquire Financial Holdings, Inc.
Common Stock |
A - Award | 1 027 | 14 963 | 7,37 | ||||
| 2024-12-02 |
|
4 | ESQ |
Esquire Financial Holdings, Inc.
Common Stock |
S - Sale | -1 000 | 59 601 | -1,65 | 76,80 | -76 800 | 4 577 357 | |
| 2024-12-02 |
|
4 | ESQ |
Esquire Financial Holdings, Inc.
Common Stock |
S - Sale | -1 000 | 60 601 | -1,62 | 76,65 | -76 650 | 4 645 067 | |
| 2024-12-02 |
|
4 | ESQ |
Esquire Financial Holdings, Inc.
Common Stock |
S - Sale | -1 000 | 61 601 | -1,60 | 76,49 | -76 490 | 4 711 860 | |
| 2024-11-27 |
|
4 | ESQ |
Esquire Financial Holdings, Inc.
Common Stock |
S - Sale | -1 000 | 62 601 | -1,57 | 77,20 | -77 200 | 4 832 810 | |
| 2024-11-27 |
|
4 | ESQ |
Esquire Financial Holdings, Inc.
Common Stock |
S - Sale | -1 000 | 63 601 | -1,55 | 77,00 | -77 000 | 4 897 277 | |
| 2024-11-27 |
|
4 | ESQ |
Esquire Financial Holdings, Inc.
Common Stock |
S - Sale | -900 | 64 601 | -1,37 | 76,66 | -68 998 | 4 952 636 | |
| 2024-11-27 |
|
4 | ESQ |
Esquire Financial Holdings, Inc.
Common Stock |
S - Sale | -600 | 102 433 | -0,58 | 77,99 | -46 796 | 7 989 077 | |
| 2024-11-27 |
|
4 | ESQ |
Esquire Financial Holdings, Inc.
Common Stock |
S - Sale | -1 000 | 103 033 | -0,96 | 77,40 | -77 400 | 7 974 754 | |
| 2024-11-27 |
|
4 | ESQ |
Esquire Financial Holdings, Inc.
Common Stock |
S - Sale | -1 000 | 104 033 | -0,95 | 76,77 | -76 768 | 7 986 395 | |
| 2024-11-27 |
|
4 | ESQ |
Esquire Financial Holdings, Inc.
Common Stock |
S - Sale | -1 000 | 105 033 | -0,94 | 76,44 | -76 444 | 8 029 195 | |
| 2024-11-27 |
|
4 | ESQ |
Esquire Financial Holdings, Inc.
Common Stock |
S - Sale | -600 | 106 033 | -0,56 | 75,80 | -45 482 | 8 037 715 | |
| 2024-11-27 |
|
4 | ESQ |
Esquire Financial Holdings, Inc.
Common Stock |
S - Sale | -900 | 106 633 | -0,84 | 75,60 | -68 040 | 8 061 455 | |
| 2024-06-18 |
|
4 | ESQ |
Esquire Financial Holdings, Inc.
Common Stock |
S - Sale | -1 000 | 107 533 | -0,92 | 45,92 | -45 923 | 4 938 216 | |
| 2024-06-18 |
|
4 | ESQ |
Esquire Financial Holdings, Inc.
Common Stock |
S - Sale | -1 000 | 108 533 | -0,91 | 45,90 | -45 895 | 4 981 122 | |
| 2024-06-18 |
|
4 | ESQ |
Esquire Financial Holdings, Inc.
Common Stock |
S - Sale | -500 | 109 533 | -0,45 | 45,80 | -22 900 | 5 016 611 | |
| 2024-05-24 |
|
4 | ESQ |
Esquire Financial Holdings, Inc.
Common Stock |
S - Sale | -1 000 | 110 033 | -0,90 | 47,62 | -47 625 | 5 240 322 | |
| 2024-05-24 |
|
4 | ESQ |
Esquire Financial Holdings, Inc.
Common Stock |
S - Sale | -1 000 | 111 033 | -0,89 | 47,52 | -47 521 | 5 276 355 | |
| 2024-05-24 |
|
4 | ESQ |
Esquire Financial Holdings, Inc.
Common Stock |
S - Sale | -1 000 | 112 033 | -0,88 | 47,45 | -47 454 | 5 316 459 | |
| 2024-05-24 |
|
4 | ESQ |
Esquire Financial Holdings, Inc.
Common Stock |
S - Sale | -1 000 | 113 033 | -0,88 | 47,37 | -47 371 | 5 354 520 | |
| 2024-05-24 |
|
4 | ESQ |
Esquire Financial Holdings, Inc.
Common Stock |
S - Sale | -1 000 | 114 033 | -0,87 | 46,95 | -46 951 | 5 353 998 | |
| 2024-05-24 |
|
4 | ESQ |
Esquire Financial Holdings, Inc.
Common Stock |
S - Sale | -1 000 | 115 033 | -0,86 | 48,08 | -48 080 | 5 530 787 | |
| 2024-05-24 |
|
4 | ESQ |
Esquire Financial Holdings, Inc.
Common Stock |
S - Sale | -1 000 | 116 033 | -0,85 | 47,87 | -47 867 | 5 554 140 | |
| 2024-05-24 |
|
4 | ESQ |
Esquire Financial Holdings, Inc.
Common Stock |
S - Sale | -1 000 | 117 033 | -0,85 | 47,88 | -47 885 | 5 604 125 | |
| 2024-05-24 |
|
4 | ESQ |
Esquire Financial Holdings, Inc.
Common Stock |
S - Sale | -500 | 118 033 | -0,42 | 47,84 | -23 922 | 5 647 289 | |
| 2024-05-24 |
|
4 | ESQ |
Esquire Financial Holdings, Inc.
Common Stock |
S - Sale | -500 | 118 533 | -0,42 | 47,82 | -23 912 | 5 668 604 | |
| 2024-05-24 |
|
4 | ESQ |
Esquire Financial Holdings, Inc.
Common Stock |
S - Sale | -1 000 | 119 033 | -0,83 | 47,80 | -47 798 | 5 689 539 | |
| 2024-05-24 |
|
4 | ESQ |
Esquire Financial Holdings, Inc.
Common Stock |
S - Sale | -1 000 | 120 033 | -0,83 | 47,77 | -47 770 | 5 733 988 | |
| 2024-05-24 |
|
4 | ESQ |
Esquire Financial Holdings, Inc.
Common Stock |
S - Sale | -1 000 | 121 033 | -0,82 | 47,66 | -47 662 | 5 768 687 | |
| 2024-05-24 |
|
4 | ESQ |
Esquire Financial Holdings, Inc.
Common Stock |
S - Sale | -500 | 122 033 | -0,41 | 47,62 | -23 810 | 5 811 211 | |
| 2024-05-24 |
|
4 | ESQ |
Esquire Financial Holdings, Inc.
Common Stock |
S - Sale | -500 | 122 533 | -0,41 | 47,61 | -23 806 | 5 833 980 | |
| 2024-05-24 |
|
4 | ESQ |
Esquire Financial Holdings, Inc.
Common Stock |
S - Sale | -1 000 | 123 033 | -0,81 | 47,60 | -47 600 | 5 856 383 | |
| 2024-05-24 |
|
4 | ESQ |
Esquire Financial Holdings, Inc.
Common Stock |
S - Sale | -500 | 124 033 | -0,40 | 47,57 | -23 787 | 5 900 709 | |
| 2024-05-24 |
|
4 | ESQ |
Esquire Financial Holdings, Inc.
Common Stock |
S - Sale | -500 | 124 533 | -0,40 | 47,50 | -23 750 | 5 915 318 | |
| 2024-03-06 |
|
4 | ESQ |
Esquire Financial Holdings, Inc.
Common Stock |
S - Sale | -3 000 | 125 033 | -2,34 | 49,95 | -149 850 | 6 245 398 | |
| 2024-03-06 |
|
4 | ESQ |
Esquire Financial Holdings, Inc.
Common Stock |
S - Sale | -1 000 | 128 033 | -0,77 | 49,91 | -49 906 | 6 389 602 | |
| 2024-03-06 |
|
4 | ESQ |
Esquire Financial Holdings, Inc.
Common Stock |
S - Sale | -1 000 | 129 033 | -0,77 | 49,90 | -49 900 | 6 438 747 | |
| 2024-03-06 |
|
4 | ESQ |
Esquire Financial Holdings, Inc.
Common Stock |
S - Sale | -2 000 | 130 033 | -1,51 | 49,80 | -99 600 | 6 475 643 | |
| 2024-03-06 |
|
4 | ESQ |
Esquire Financial Holdings, Inc.
Common Stock |
S - Sale | -1 000 | 132 033 | -0,75 | 49,75 | -49 750 | 6 568 642 | |
| 2024-03-06 |
|
4 | ESQ |
Esquire Financial Holdings, Inc.
Common Stock |
S - Sale | -1 000 | 133 033 | -0,75 | 49,61 | -49 608 | 6 599 448 | |
| 2024-03-06 |
|
4 | ESQ |
Esquire Financial Holdings, Inc.
Common Stock |
S - Sale | -1 000 | 134 033 | -0,74 | 49,60 | -49 600 | 6 648 037 | |
| 2024-03-06 |
|
4 | ESQ |
Esquire Financial Holdings, Inc.
Common Stock |
S - Sale | -1 000 | 135 033 | -0,74 | 49,25 | -49 246 | 6 649 862 | |
| 2024-03-06 |
|
4 | ESQ |
Esquire Financial Holdings, Inc.
Common Stock |
S - Sale | -1 000 | 136 033 | -0,73 | 49,45 | -49 454 | 6 727 376 | |
| 2024-03-06 |
|
4 | ESQ |
Esquire Financial Holdings, Inc.
Common Stock |
S - Sale | -5 000 | 137 033 | -3,52 | 49,80 | -249 000 | 6 824 243 | |
| 2024-03-06 |
|
4 | ESQ |
Esquire Financial Holdings, Inc.
Common Stock |
S - Sale | -1 000 | 142 033 | -0,70 | 49,88 | -49 880 | 7 084 606 | |
| 2024-03-06 |
|
4 | ESQ |
Esquire Financial Holdings, Inc.
Common Stock |
S - Sale | -1 000 | 143 033 | -0,69 | 49,93 | -49 930 | 7 141 638 | |
| 2024-03-06 |
|
4 | ESQ |
Esquire Financial Holdings, Inc.
Common Stock |
S - Sale | -1 000 | 144 033 | -0,69 | 50,10 | -50 100 | 7 216 053 | |
| 2024-03-06 |
|
4 | ESQ |
Esquire Financial Holdings, Inc.
Common Stock |
S - Sale | -1 000 | 145 033 | -0,68 | 50,18 | -50 183 | 7 278 191 | |
| 2024-03-06 |
|
4 | ESQ |
Esquire Financial Holdings, Inc.
Common Stock |
S - Sale | -1 000 | 146 033 | -0,68 | 50,29 | -50 295 | 7 344 671 | |
| 2023-12-19 |
|
4 | ESQ |
Esquire Financial Holdings, Inc.
Common Stock |
A - Award | 1 656 | 13 936 | 13,49 | ||||
| 2023-11-13 |
|
4 | ESQ |
Esquire Financial Holdings, Inc.
Common Stock |
S - Sale | -1 000 | 147 033 | -0,68 | 45,93 | -45 929 | 6 753 020 | |
| 2023-11-13 |
|
4 | ESQ |
Esquire Financial Holdings, Inc.
Common Stock |
S - Sale | -1 000 | 65 501 | -1,50 | 45,74 | -45 742 | 2 996 153 | |
| 2023-11-13 |
|
4 | ESQ |
Esquire Financial Holdings, Inc.
Common Stock |
S - Sale | -1 000 | 66 501 | -1,48 | 46,74 | -46 740 | 3 108 257 | |
| 2023-11-13 |
|
4 | ESQ |
Esquire Financial Holdings, Inc.
Common Stock |
S - Sale | -1 000 | 67 501 | -1,46 | 46,42 | -46 422 | 3 133 518 | |
| 2023-11-13 |
|
4 | ESQ |
Esquire Financial Holdings, Inc.
Common Stock |
S - Sale | -700 | 68 501 | -1,01 | 47,06 | -32 942 | 3 223 616 | |
| 2023-11-13 |
|
4 | ESQ |
Esquire Financial Holdings, Inc.
Common Stock |
S - Sale | -500 | 69 201 | -0,72 | 46,85 | -23 426 | 3 242 150 | |
| 2023-11-13 |
|
4 | ESQ |
Esquire Financial Holdings, Inc.
Common Stock |
S - Sale | -397 | 69 701 | -0,57 | 46,40 | -18 422 | 3 234 398 | |
| 2023-11-13 |
|
4 | ESQ |
Esquire Financial Holdings, Inc.
Common Stock |
S - Sale | -500 | 70 098 | -0,71 | 46,62 | -23 308 | 3 267 618 | |
| 2023-11-13 |
|
4 | ESQ |
Esquire Financial Holdings, Inc.
Common Stock |
S - Sale | -500 | 70 598 | -0,70 | 46,66 | -23 331 | 3 294 209 | |
| 2023-11-13 |
|
4 | ESQ |
Esquire Financial Holdings, Inc.
Common Stock |
S - Sale | -350 | 148 033 | -0,24 | 47,35 | -16 573 | 7 009 747 | |
| 2023-11-13 |
|
4 | ESQ |
Esquire Financial Holdings, Inc.
Common Stock |
S - Sale | -650 | 148 383 | -0,44 | 47,33 | -30 767 | 7 023 591 | |
| 2023-11-13 |
|
4 | ESQ |
Esquire Financial Holdings, Inc.
Common Stock |
S - Sale | -403 | 71 098 | -0,56 | 47,31 | -19 066 | 3 363 646 | |
| 2023-09-13 |
|
4 | ESQ |
Esquire Financial Holdings, Inc.
Common Stock |
S - Sale | -1 000 | 71 501 | -1,38 | 46,90 | -46 900 | 3 353 418 | |
| 2023-09-13 |
|
4 | ESQ |
Esquire Financial Holdings, Inc.
Common Stock |
S - Sale | -1 000 | 72 501 | -1,36 | 46,55 | -46 550 | 3 374 922 | |
| 2023-09-13 |
|
4 | ESQ |
Esquire Financial Holdings, Inc.
Common Stock |
S - Sale | -1 000 | 73 501 | -1,34 | 48,28 | -48 280 | 3 548 628 | |
| 2023-09-13 |
|
4 | ESQ |
Esquire Financial Holdings, Inc.
Common Stock |
S - Sale | -1 000 | 74 501 | -1,32 | 48,17 | -48 172 | 3 588 862 | |
| 2023-09-13 |
|
4 | ESQ |
Esquire Financial Holdings, Inc.
Common Stock |
S - Sale | -1 000 | 75 501 | -1,31 | 47,20 | -47 200 | 3 563 647 | |
| 2023-08-23 |
|
4 | ESQ |
Esquire Financial Holdings, Inc.
Common Stock |
S - Sale | -1 000 | 149 033 | -0,67 | 47,81 | -47 812 | 7 125 521 | |
| 2023-08-23 |
|
4 | ESQ |
Esquire Financial Holdings, Inc.
Common Stock |
S - Sale | -1 500 | 150 033 | -0,99 | 47,80 | -71 704 | 7 172 027 | |
| 2023-08-23 |
|
4 | ESQ |
Esquire Financial Holdings, Inc.
Common Stock |
S - Sale | -1 500 | 151 533 | -0,98 | 47,75 | -71 625 | 7 235 701 | |
| 2023-08-23 |
|
4 | ESQ |
Esquire Financial Holdings, Inc.
Common Stock |
S - Sale | -1 000 | 153 033 | -0,65 | 47,65 | -47 650 | 7 292 022 | |
| 2023-06-13 |
|
4 | ESQ |
Esquire Financial Holdings, Inc.
Common Stock |
F - Taxes | -829 | 12 280 | -6,32 | 45,07 | -37 363 | 553 460 | |
| 2023-06-13 |
|
4 | ESQ |
Esquire Financial Holdings, Inc.
Common Stock |
M - Exercise | 1 500 | 13 109 | 12,92 | 24,90 | 37 350 | 326 414 | |
| 2023-06-13 |
|
4 | ESQ |
Esquire Financial Holdings, Inc.
Common Stock |
F - Taxes | -641 | 11 609 | -5,23 | 45,07 | -28 890 | 523 218 | |
| 2023-06-13 |
|
4 | ESQ |
Esquire Financial Holdings, Inc.
Common Stock |
M - Exercise | 1 500 | 12 250 | 13,95 | 19,25 | 28 875 | 235 812 | |
| 2023-05-22 |
|
4 | ESQ |
Esquire Financial Holdings, Inc.
Common Stock |
S - Sale | -2 000 | 154 033 | -1,28 | 42,35 | -84 700 | 6 523 298 | |
| 2023-05-22 |
|
4 | ESQ |
Esquire Financial Holdings, Inc.
Common Stock |
S - Sale | -2 000 | 156 033 | -1,27 | 42,25 | -84 500 | 6 592 394 | |
| 2023-05-22 |
|
4 | ESQ |
Esquire Financial Holdings, Inc.
Common Stock |
S - Sale | -1 952 | 158 033 | -1,22 | 42,05 | -82 082 | 6 645 288 | |
| 2023-05-22 |
|
4 | ESQ |
Esquire Financial Holdings, Inc.
Common Stock |
S - Sale | -48 | 159 985 | -0,03 | 42,50 | -2 040 | 6 799 362 | |
| 2023-05-22 |
|
4 | ESQ |
Esquire Financial Holdings, Inc.
Common Stock |
S - Sale | -2 000 | 160 033 | -1,23 | 42,89 | -85 776 | 6 863 495 | |
| 2023-05-22 |
|
4 | ESQ |
Esquire Financial Holdings, Inc.
Common Stock |
S - Sale | -628 | 162 033 | -0,39 | 41,99 | -26 370 | 6 803 766 | |
| 2023-05-22 |
|
4 | ESQ |
Esquire Financial Holdings, Inc.
Common Stock |
S - Sale | -1 372 | 162 661 | -0,84 | 42,40 | -58 173 | 6 896 826 | |
| 2023-05-22 |
|
4 | ESQ |
Esquire Financial Holdings, Inc.
Common Stock |
S - Sale | -2 000 | 164 033 | -1,20 | 42,17 | -84 343 | 6 917 518 | |
| 2023-05-22 |
|
4 | ESQ |
Esquire Financial Holdings, Inc.
Common Stock |
S - Sale | -2 000 | 166 033 | -1,19 | 42,50 | -85 000 | 7 056 402 | |
| 2023-05-22 |
|
4 | ESQ |
Esquire Financial Holdings, Inc.
Common Stock |
S - Sale | -2 000 | 168 033 | -1,18 | 42,40 | -84 800 | 7 124 599 | |
| 2023-05-22 |
|
4 | ESQ |
Esquire Financial Holdings, Inc.
Common Stock |
S - Sale | -2 000 | 170 033 | -1,16 | 42,25 | -84 500 | 7 183 894 | |
| 2023-05-22 |
|
4 | ESQ |
Esquire Financial Holdings, Inc.
Common Stock |
S - Sale | -2 000 | 172 033 | -1,15 | 41,89 | -83 780 | 7 206 462 | |
| 2023-02-28 |
|
4 | ESQ |
Esquire Financial Holdings, Inc.
Common Stock |
S - Sale | -1 500 | 76 501 | -1,92 | 45,98 | -68 970 | 3 517 516 | |
| 2023-02-28 |
|
4 | ESQ |
Esquire Financial Holdings, Inc.
Common Stock |
S - Sale | -800 | 78 001 | -1,02 | 45,67 | -36 536 | 3 562 306 | |
| 2023-02-28 |
|
4 | ESQ |
Esquire Financial Holdings, Inc.
Common Stock |
S - Sale | -700 | 78 801 | -0,88 | 45,57 | -31 896 | 3 590 662 | |
| 2022-12-21 |
|
4 | ESQ |
Esquire Financial Holdings, Inc.
Common Stock |
A - Award | 1 750 | 184 783 | 0,96 | ||||
| 2022-11-17 |
|
4 | ESQ |
Esquire Financial Holdings, Inc.
Common Stock |
S - Sale | -800 | 79 501 | -1,00 | 44,14 | -35 312 | 3 509 174 | |
| 2022-11-17 |
|
4 | ESQ |
Esquire Financial Holdings, Inc.
Common Stock |
S - Sale | -1 000 | 80 301 | -1,23 | 44,10 | -44 104 | 3 541 587 | |
| 2022-11-17 |
|
4 | ESQ |
Esquire Financial Holdings, Inc.
Common Stock |
S - Sale | -500 | 81 301 | -0,61 | 44,00 | -22 000 | 3 577 244 | |
| 2022-11-17 |
|
4 | ESQ |
Esquire Financial Holdings, Inc.
Common Stock |
S - Sale | -500 | 81 801 | -0,61 | 43,87 | -21 935 | 3 588 610 | |
| 2022-11-17 |
|
4 | ESQ |
Esquire Financial Holdings, Inc.
Common Stock |
S - Sale | -700 | 82 301 | -0,84 | 43,42 | -30 394 | 3 573 509 | |
| 2022-11-15 |
|
4 | ESQ |
Esquire Financial Holdings, Inc.
Common Stock |
S - Sale | -500 | 83 001 | -0,60 | 45,23 | -22 613 | 3 753 753 | |
| 2022-11-15 |
|
4 | ESQ |
Esquire Financial Holdings, Inc.
Common Stock |
S - Sale | -500 | 83 501 | -0,60 | 43,46 | -21 730 | 3 628 953 | |
| 2022-11-10 |
|
4 | ESQ |
Esquire Financial Holdings, Inc.
Common Stock |
S - Sale | -130 | 84 001 | -0,15 | 44,22 | -5 749 | 3 714 524 | |
| 2022-11-10 |
|
4 | ESQ |
Esquire Financial Holdings, Inc.
Common Stock |
S - Sale | -500 | 84 131 | -0,59 | 43,58 | -21 790 | 3 666 362 | |
| 2022-11-10 |
|
4 | ESQ |
Esquire Financial Holdings, Inc.
Common Stock |
S - Sale | -370 | 84 631 | -0,44 | 43,08 | -15 940 | 3 645 903 | |
| 2022-11-10 |
|
4 | ESQ |
Esquire Financial Holdings, Inc.
Common Stock |
S - Sale | -500 | 85 001 | -0,58 | 45,36 | -22 678 | 3 855 373 | |
| 2022-11-10 |
|
4 | ESQ |
Esquire Financial Holdings, Inc.
Common Stock |
S - Sale | -500 | 85 501 | -0,58 | 45,23 | -22 616 | 3 867 407 | |
| 2022-11-10 |
|
4 | ESQ |
Esquire Financial Holdings, Inc.
Common Stock |
S - Sale | -500 | 86 001 | -0,58 | 45,23 | -22 613 | 3 889 464 | |
| 2022-11-10 |
|
4 | ESQ |
Esquire Financial Holdings, Inc.
Common Stock |
S - Sale | -500 | 86 501 | -0,57 | 45,22 | -22 610 | 3 911 575 | |
| 2022-11-10 |
|
4 | ESQ |
Esquire Financial Holdings, Inc.
Common Stock |
S - Sale | -100 | 87 001 | -0,11 | 45,05 | -4 505 | 3 919 395 | |
| 2022-11-10 |
|
4 | ESQ |
Esquire Financial Holdings, Inc.
Common Stock |
S - Sale | -400 | 87 101 | -0,46 | 44,76 | -17 904 | 3 898 641 | |
| 2022-08-31 |
|
4 | ESQ |
Esquire Financial Holdings, Inc.
Common Stock |
S - Sale | -500 | 87 501 | -0,57 | 37,74 | -18 870 | 3 302 288 | |
| 2022-08-31 |
|
4 | ESQ |
Esquire Financial Holdings, Inc.
Common Stock |
S - Sale | -500 | 88 001 | -0,56 | 37,69 | -18 846 | 3 317 004 | |
| 2022-08-31 |
|
4 | ESQ |
Esquire Financial Holdings, Inc.
Common Stock |
S - Sale | -500 | 88 501 | -0,56 | 37,60 | -18 800 | 3 327 602 | |
| 2022-08-31 |
|
4 | ESQ |
Esquire Financial Holdings, Inc.
Common Stock |
S - Sale | -500 | 89 001 | -0,56 | 37,38 | -18 691 | 3 326 973 | |
| 2022-08-31 |
|
4 | ESQ |
Esquire Financial Holdings, Inc.
Common Stock |
S - Sale | -500 | 89 501 | -0,56 | 37,30 | -18 649 | 3 338 155 | |
| 2022-08-31 |
|
4 | ESQ |
Esquire Financial Holdings, Inc.
Common Stock |
S - Sale | -500 | 90 001 | -0,55 | 37,21 | -18 603 | 3 348 640 | |
| 2022-08-30 |
|
4 | ESQ |
Esquire Financial Holdings, Inc.
Common Stock |
S - Sale | -600 | 90 501 | -0,66 | 37,93 | -22 756 | 3 432 377 | |
| 2022-08-30 |
|
4 | ESQ |
Esquire Financial Holdings, Inc.
Common Stock |
S - Sale | -500 | 91 101 | -0,55 | 37,89 | -18 945 | 3 451 817 | |
| 2022-08-30 |
|
4 | ESQ |
Esquire Financial Holdings, Inc.
Common Stock |
S - Sale | -500 | 91 601 | -0,54 | 37,88 | -18 940 | 3 469 846 | |
| 2022-08-30 |
|
4 | ESQ |
Esquire Financial Holdings, Inc.
Common Stock |
S - Sale | -500 | 92 101 | -0,54 | 37,81 | -18 906 | 3 482 505 | |
| 2022-08-30 |
|
4 | ESQ |
Esquire Financial Holdings, Inc.
Common Stock |
S - Sale | -500 | 92 601 | -0,54 | 37,76 | -18 880 | 3 496 697 | |
| 2022-08-30 |
|
4 | ESQ |
Esquire Financial Holdings, Inc.
Common Stock |
S - Sale | -500 | 93 101 | -0,53 | 37,74 | -18 868 | 3 513 241 | |
| 2022-08-30 |
|
4 | ESQ |
Esquire Financial Holdings, Inc.
Common Stock |
S - Sale | -600 | 93 601 | -0,64 | 37,63 | -22 576 | 3 521 831 | |
| 2022-08-30 |
|
4 | ESQ |
Esquire Financial Holdings, Inc.
Common Stock |
S - Sale | -500 | 94 201 | -0,53 | 37,62 | -18 810 | 3 543 842 | |
| 2022-08-30 |
|
4 | ESQ |
Esquire Financial Holdings, Inc.
Common Stock |
S - Sale | -500 | 94 701 | -0,53 | 38,69 | -19 345 | 3 663 982 | |
| 2022-08-30 |
|
4 | ESQ |
Esquire Financial Holdings, Inc.
Common Stock |
S - Sale | -500 | 95 201 | -0,52 | 38,40 | -19 200 | 3 655 718 | |
| 2022-08-30 |
|
4 | ESQ |
Esquire Financial Holdings, Inc.
Common Stock |
S - Sale | -400 | 95 701 | -0,42 | 38,38 | -15 353 | 3 673 224 | |
| 2022-08-30 |
|
4 | ESQ |
Esquire Financial Holdings, Inc.
Common Stock |
S - Sale | -600 | 96 101 | -0,62 | 38,31 | -22 985 | 3 681 504 | |
| 2022-08-30 |
|
4 | ESQ |
Esquire Financial Holdings, Inc.
Common Stock |
S - Sale | -500 | 96 701 | -0,51 | 38,24 | -19 119 | 3 697 701 | |
| 2022-08-30 |
|
4 | ESQ |
Esquire Financial Holdings, Inc.
Common Stock |
S - Sale | -600 | 97 201 | -0,61 | 38,30 | -22 982 | 3 723 168 | |
| 2022-08-30 |
|
4 | ESQ |
Esquire Financial Holdings, Inc.
Common Stock |
S - Sale | -500 | 97 801 | -0,51 | 39,23 | -19 615 | 3 836 733 | |
| 2022-08-30 |
|
4 | ESQ |
Esquire Financial Holdings, Inc.
Common Stock |
S - Sale | -500 | 98 301 | -0,51 | 38,15 | -19 074 | 3 750 026 | |
| 2022-08-30 |
|
4 | ESQ |
Esquire Financial Holdings, Inc.
Common Stock |
S - Sale | -500 | 98 801 | -0,50 | 39,09 | -19 545 | 3 862 131 | |
| 2022-08-30 |
|
4 | ESQ |
Esquire Financial Holdings, Inc.
Common Stock |
S - Sale | -600 | 99 301 | -0,60 | 39,02 | -23 414 | 3 875 122 | |
| 2022-08-30 |
|
4 | ESQ |
Esquire Financial Holdings, Inc.
Common Stock |
S - Sale | -300 | 99 901 | -0,30 | 38,74 | -11 622 | 3 870 165 | |
| 2022-08-29 |
|
4 | ESQ |
Esquire Financial Holdings, Inc.
Common Stock |
S - Sale | -600 | 90 501 | -0,66 | 37,93 | -22 756 | 3 432 377 | |
| 2022-08-29 |
|
4 | ESQ |
Esquire Financial Holdings, Inc.
Common Stock |
S - Sale | -500 | 91 101 | -0,55 | 37,89 | -18 945 | 3 451 817 | |
| 2022-08-29 |
|
4 | ESQ |
Esquire Financial Holdings, Inc.
Common Stock |
S - Sale | -500 | 91 601 | -0,54 | 37,88 | -18 940 | 3 469 846 | |
| 2022-08-29 |
|
4 | ESQ |
Esquire Financial Holdings, Inc.
Common Stock |
S - Sale | -500 | 92 101 | -0,54 | 37,81 | -18 906 | 3 482 505 | |
| 2022-08-29 |
|
4 | ESQ |
Esquire Financial Holdings, Inc.
Common Stock |
S - Sale | -500 | 92 601 | -0,54 | 37,76 | -18 880 | 3 496 697 | |
| 2022-08-29 |
|
4 | ESQ |
Esquire Financial Holdings, Inc.
Common Stock |
S - Sale | -500 | 93 101 | -0,53 | 37,74 | -18 868 | 3 513 241 | |
| 2022-08-29 |
|
4 | ESQ |
Esquire Financial Holdings, Inc.
Common Stock |
S - Sale | -600 | 93 601 | -0,64 | 37,63 | -22 576 | 3 521 831 | |
| 2022-08-29 |
|
4 | ESQ |
Esquire Financial Holdings, Inc.
Common Stock |
S - Sale | -500 | 94 201 | -0,53 | 37,62 | -18 810 | 3 543 842 | |
| 2022-08-29 |
|
4 | ESQ |
Esquire Financial Holdings, Inc.
Common Stock |
S - Sale | -500 | 94 701 | -0,53 | 38,69 | -19 345 | 3 663 982 | |
| 2022-08-29 |
|
4 | ESQ |
Esquire Financial Holdings, Inc.
Common Stock |
S - Sale | -500 | 95 201 | -0,52 | 38,40 | -19 200 | 3 655 718 | |
| 2022-08-29 |
|
4 | ESQ |
Esquire Financial Holdings, Inc.
Common Stock |
S - Sale | -400 | 95 701 | -0,42 | 38,38 | -15 353 | 3 673 224 | |
| 2022-08-29 |
|
4 | ESQ |
Esquire Financial Holdings, Inc.
Common Stock |
S - Sale | -600 | 96 101 | -0,62 | 38,31 | -22 985 | 3 681 504 | |
| 2022-08-29 |
|
4 | ESQ |
Esquire Financial Holdings, Inc.
Common Stock |
S - Sale | -500 | 96 701 | -0,51 | 38,24 | -19 119 | 3 697 701 | |
| 2022-08-29 |
|
4 | ESQ |
Esquire Financial Holdings, Inc.
Common Stock |
S - Sale | -600 | 97 201 | -0,61 | 38,30 | -22 982 | 3 723 168 | |
| 2022-08-29 |
|
4 | ESQ |
Esquire Financial Holdings, Inc.
Common Stock |
S - Sale | -500 | 97 801 | -0,51 | 39,23 | -19 615 | 3 836 733 | |
| 2022-08-29 |
|
4 | ESQ |
Esquire Financial Holdings, Inc.
Common Stock |
S - Sale | -500 | 98 301 | -0,51 | 38,15 | -19 074 | 3 750 026 | |
| 2022-08-29 |
|
4 | ESQ |
Esquire Financial Holdings, Inc.
Common Stock |
S - Sale | -500 | 98 801 | -0,50 | 39,09 | -19 545 | 3 862 131 | |
| 2022-08-29 |
|
4 | ESQ |
Esquire Financial Holdings, Inc.
Common Stock |
S - Sale | -600 | 99 301 | -0,60 | 39,02 | -23 414 | 3 875 122 | |
| 2022-08-29 |
|
4 | ESQ |
Esquire Financial Holdings, Inc.
Common Stock |
S - Sale | -300 | 99 901 | -0,30 | 38,74 | -11 622 | 3 870 165 | |
| 2022-08-25 |
|
4 | ESQ |
Esquire Financial Holdings, Inc.
Common Stock |
S - Sale | -300 | 100 201 | -0,30 | 38,80 | -11 640 | 3 887 799 | |
| 2022-08-25 |
|
4 | ESQ |
Esquire Financial Holdings, Inc.
Common Stock |
S - Sale | -300 | 100 501 | -0,30 | 38,79 | -11 638 | 3 898 765 | |
| 2022-08-25 |
|
4 | ESQ |
Esquire Financial Holdings, Inc.
Common Stock |
S - Sale | -400 | 100 801 | -0,40 | 38,70 | -15 481 | 3 901 210 | |
| 2022-08-25 |
|
4 | ESQ |
Esquire Financial Holdings, Inc.
Common Stock |
S - Sale | -460 | 101 201 | -0,45 | 39,70 | -18 262 | 4 017 680 | |
| 2022-08-25 |
|
4 | ESQ |
Esquire Financial Holdings, Inc.
Common Stock |
S - Sale | -300 | 101 661 | -0,29 | 38,60 | -11 579 | 3 923 840 | |
| 2022-08-25 |
|
4 | ESQ |
Esquire Financial Holdings, Inc.
Common Stock |
S - Sale | -600 | 101 961 | -0,59 | 39,20 | -23 520 | 3 996 871 | |
| 2022-08-25 |
|
4 | ESQ |
Esquire Financial Holdings, Inc.
Common Stock |
S - Sale | -440 | 102 561 | -0,43 | 39,11 | -17 208 | 4 011 161 | |
| 2022-08-25 |
|
4 | ESQ |
Esquire Financial Holdings, Inc.
Common Stock |
S - Sale | -500 | 103 001 | -0,48 | 38,91 | -19 453 | 4 007 357 | |
| 2022-05-18 |
|
4 | ESQ |
Esquire Financial Holdings, Inc.
Common Stock |
G - Gift | -1 000 | 183 033 | -0,54 | ||||
| 2022-02-22 |
|
4 | ESQ |
Esquire Financial Holdings, Inc.
Common Stock |
G - Gift | -1 525 | 184 033 | -0,82 | ||||
| 2021-12-13 |
|
4 | ESQ |
Esquire Financial Holdings, Inc.
Common Stock |
A - Award | 1 500 | 185 558 | 0,81 | ||||
| 2021-08-03 |
|
4 | ESQ |
Esquire Financial Holdings, Inc.
Stock Options |
M - Exercise | -34 681 | 0 | -100,00 | ||||
| 2021-08-03 |
|
4 | ESQ |
Esquire Financial Holdings, Inc.
Common Stock |
F - Taxes | -18 063 | 184 058 | -8,94 | 24,00 | -433 512 | 4 417 392 | |
| 2021-08-03 |
|
4 | ESQ |
Esquire Financial Holdings, Inc.
Common Stock |
M - Exercise | 34 681 | 202 121 | 20,71 | 12,50 | 433 512 | 2 526 512 | |
| 2020-12-18 |
|
4 | ESQ |
Esquire Financial Holdings, Inc.
Common Stock |
A - Award | 2 000 | 167 440 | 1,21 | ||||
| 2020-04-09 |
|
4 | ESQ |
Esquire Financial Holdings, Inc.
Common Stock |
G - Gift | 10 000 | 25 500 | 64,52 | ||||
| 2020-04-09 |
|
4 | ESQ |
Esquire Financial Holdings, Inc.
Common Stock |
G - Gift | -10 000 | 165 440 | -5,70 | ||||
| 2019-12-23 |
|
4 | ESQ |
Esquire Financial Holdings, Inc.
Common Stock |
A - Award | 1 500 | 175 440 | 0,86 | ||||
| 2018-12-21 |
|
4 | ESQ |
Esquire Financial Holdings, Inc.
Stock Options |
A - Award | 1 500 | 1 500 | |||||
| 2018-08-27 |
|
4 | ESQ |
Esquire Financial Holdings, Inc.
Common Stock |
G - Gift | 5 000 | 15 500 | 47,62 | ||||
| 2018-08-27 |
|
4 | ESQ |
Esquire Financial Holdings, Inc.
Common Stock |
G - Gift | -5 000 | 173 940 | -2,79 | ||||
| 2018-08-06 |
|
4 | ESQ |
Esquire Financial Holdings, Inc.
Common Stock |
P - Purchase | 500 | 103 501 | 0,49 | 25,28 | 12 638 | 2 616 174 | |
| 2018-05-18 |
|
4 | ESQ |
Esquire Financial Holdings, Inc.
Common Stock |
P - Purchase | 500 | 103 001 | 0,49 | 24,52 | 12 260 | 2 525 585 | |
| 2018-02-28 |
|
4 | ESQ |
Esquire Financial Holdings, Inc.
Common Stock |
P - Purchase | 100 | 102 501 | 0,10 | 22,94 | 2 294 | 2 351 373 | |
| 2018-02-28 |
|
4 | ESQ |
Esquire Financial Holdings, Inc.
Common Stock |
P - Purchase | 100 | 102 401 | 0,10 | 22,89 | 2 289 | 2 343 959 | |
| 2018-02-28 |
|
4 | ESQ |
Esquire Financial Holdings, Inc.
Common Stock |
P - Purchase | 100 | 102 301 | 0,10 | 22,88 | 2 288 | 2 340 647 | |
| 2018-02-28 |
|
4 | ESQ |
Esquire Financial Holdings, Inc.
Common Stock |
P - Purchase | 200 | 102 201 | 0,20 | 22,60 | 4 520 | 2 309 743 | |
| 2018-02-16 |
|
4 | ESQ |
Esquire Financial Holdings, Inc.
Common Stock |
P - Purchase | 500 | 102 001 | 0,49 | 22,00 | 11 000 | 2 244 022 | |
| 2018-02-07 |
|
4 | ESQ |
Esquire Financial Holdings, Inc.
Stock Options |
A - Award | 1 500 | 1 500 | |||||
| 2018-01-29 |
|
4 | ESQ |
Esquire Financial Holdings, Inc.
Common Stock |
P - Purchase | 500 | 101 501 | 0,50 | 20,50 | 10 250 | 2 080 770 | |
| 2018-01-29 |
|
4 | ESQ |
Esquire Financial Holdings, Inc.
Common Stock |
P - Purchase | 144 | 101 001 | 0,14 | 20,49 | 2 951 | 2 069 510 | |
| 2018-01-29 |
|
4 | ESQ |
Esquire Financial Holdings, Inc.
Common Stock |
P - Purchase | 166 | 100 857 | 0,16 | 20,48 | 3 400 | 2 065 551 | |
| 2018-01-29 |
|
4 | ESQ |
Esquire Financial Holdings, Inc.
Common Stock |
P - Purchase | 190 | 100 691 | 0,19 | 20,45 | 3 886 | 2 059 131 | |
| 2017-11-09 |
|
4 | ESQ |
Esquire Financial Holdings, Inc.
Common Stock |
P - Purchase | 69 | 100 501 | 0,07 | 16,70 | 1 152 | 1 678 367 | |
| 2017-11-09 |
|
4 | ESQ |
Esquire Financial Holdings, Inc.
Common Stock |
P - Purchase | 1 631 | 100 432 | 1,65 | 16,69 | 27 221 | 1 676 210 | |
| 2017-11-09 |
|
4 | ESQ |
Esquire Financial Holdings, Inc.
Common Stock |
P - Purchase | 800 | 98 801 | 0,82 | 16,67 | 13 336 | 1 647 013 | |
| 2017-09-27 |
|
4 | ESQ |
Esquire Financial Holdings, Inc.
Stock Options |
M - Exercise | -11 560 | 34 681 | -25,00 | ||||
| 2017-09-27 |
|
4 | ESQ |
Esquire Financial Holdings, Inc.
Common Stock |
M - Exercise | 11 560 | 189 440 | 6,50 | 12,50 | 144 500 | 2 368 000 | |
| 2017-09-19 |
|
4 | ESQ |
Esquire Financial Holdings, Inc.
Common Stock |
P - Purchase | 545 | 98 001 | 0,56 | 15,17 | 8 268 | 1 486 675 | |
| 2017-09-19 |
|
4 | ESQ |
Esquire Financial Holdings, Inc.
Common Stock |
P - Purchase | 200 | 97 456 | 0,21 | 15,16 | 3 032 | 1 477 433 | |
| 2017-09-19 |
|
4 | ESQ |
Esquire Financial Holdings, Inc.
Common Stock |
P - Purchase | 155 | 97 256 | 0,16 | 15,15 | 2 348 | 1 473 428 | |
| 2017-09-19 |
|
4 | ESQ |
Esquire Financial Holdings, Inc.
Common Stock |
P - Purchase | 100 | 97 101 | 0,10 | 15,14 | 1 514 | 1 470 109 | |
| 2017-09-15 |
|
4 | ESQ |
Esquire Financial Holdings, Inc.
Common Stock |
P - Purchase | 300 | 97 001 | 0,31 | 15,25 | 4 575 | 1 479 265 | |
| 2017-09-15 |
|
4 | ESQ |
Esquire Financial Holdings, Inc.
Common Stock |
P - Purchase | 200 | 96 701 | 0,21 | 15,24 | 3 048 | 1 473 723 | |
| 2017-09-15 |
|
4 | ESQ |
Esquire Financial Holdings, Inc.
Common Stock |
P - Purchase | 100 | 96 501 | 0,10 | 15,23 | 1 523 | 1 469 710 | |
| 2017-09-15 |
|
4 | ESQ |
Esquire Financial Holdings, Inc.
Common Stock |
P - Purchase | 200 | 96 401 | 0,21 | 15,21 | 3 042 | 1 466 259 | |
| 2017-09-15 |
|
4 | ESQ |
Esquire Financial Holdings, Inc.
Common Stock |
P - Purchase | 100 | 96 201 | 0,10 | 15,15 | 1 515 | 1 457 445 | |
| 2017-09-15 |
|
4 | ESQ |
Esquire Financial Holdings, Inc.
Common Stock |
P - Purchase | 100 | 96 101 | 0,10 | 15,12 | 1 512 | 1 453 047 | |
| 2017-08-30 |
|
4 | ESQ |
Esquire Financial Holdings, Inc.
Common Stock |
P - Purchase | 500 | 96 001 | 0,52 | 14,85 | 7 425 | 1 425 615 | |
| 2017-08-30 |
|
4 | ESQ |
Esquire Financial Holdings, Inc.
Common Stock |
P - Purchase | 500 | 95 501 | 0,53 | 14,80 | 7 400 | 1 413 415 | |
| 2017-08-25 |
|
4 | ESQ |
Esquire Financial Holdings, Inc.
Common Stock |
P - Purchase | 200 | 95 001 | 0,21 | 15,50 | 3 100 | 1 472 516 | |
| 2017-08-25 |
|
4 | ESQ |
Esquire Financial Holdings, Inc.
Common Stock |
P - Purchase | 100 | 94 801 | 0,11 | 15,45 | 1 545 | 1 464 675 | |
| 2017-08-25 |
|
4 | ESQ |
Esquire Financial Holdings, Inc.
Common Stock |
P - Purchase | 300 | 94 701 | 0,32 | 15,35 | 4 605 | 1 453 660 | |
| 2017-08-25 |
|
4 | ESQ |
Esquire Financial Holdings, Inc.
Common Stock |
P - Purchase | 200 | 94 401 | 0,21 | 15,32 | 3 064 | 1 446 223 | |
| 2017-08-25 |
|
4 | ESQ |
Esquire Financial Holdings, Inc.
Common Stock |
P - Purchase | 100 | 94 201 | 0,11 | 15,12 | 1 512 | 1 423 848 | |
| 2017-08-25 |
|
4 | ESQ |
Esquire Financial Holdings, Inc.
Common Stock |
P - Purchase | 100 | 94 101 | 0,11 | 15,05 | 1 505 | 1 416 220 | |
| 2017-08-22 |
|
4 | ESQ |
Esquire Financial Holdings, Inc.
Common Stock |
P - Purchase | 200 | 94 001 | 0,21 | 16,00 | 3 200 | 1 504 016 | |
| 2017-08-22 |
|
4 | ESQ |
Esquire Financial Holdings, Inc.
Common Stock |
P - Purchase | 200 | 93 801 | 0,21 | 15,99 | 3 198 | 1 499 878 | |
| 2017-08-22 |
|
4 | ESQ |
Esquire Financial Holdings, Inc.
Common Stock |
P - Purchase | 1 600 | 93 601 | 1,74 | 15,97 | 25 552 | 1 494 808 | |
| 2017-08-10 |
|
4 | ESQ |
Esquire Financial Holdings, Inc.
Common Stock |
P - Purchase | 3 300 | 92 001 | 3,72 | 15,15 | 49 995 | 1 393 815 | |
| 2017-08-10 |
|
4 | ESQ |
Esquire Financial Holdings, Inc.
Common Stock |
P - Purchase | 500 | 88 701 | 0,57 | 15,14 | 7 570 | 1 342 933 | |
| 2017-08-07 |
|
4 | ESQ |
Esquire Financial Holdings, Inc.
Common Stock |
P - Purchase | 6 251 | 88 201 | 7,63 | 14,90 | 93 140 | 1 314 195 | |
| 2017-08-07 |
|
4 | ESQ |
Esquire Financial Holdings, Inc.
Common Stock |
P - Purchase | 5 000 | 81 950 | 6,50 | 14,79 | 73 950 | 1 212 040 | |
| 2017-08-04 |
|
4/A | ESQ |
Esquire Financial Holdings, Inc.
Common Stock |
P - Purchase | 3 000 | 76 950 | 4,06 | 14,75 | 44 250 | 1 135 012 | |
| 2017-08-04 |
|
4/A | ESQ |
Esquire Financial Holdings, Inc.
Common Stock |
P - Purchase | 1 950 | 73 950 | 2,71 | 14,75 | 28 762 | 1 090 762 | |
| 2017-08-01 |
|
4 | ESQ |
Esquire Financial Holdings, Inc.
Common Stock |
P - Purchase | 3 200 | 77 000 | 4,34 | 14,75 | 47 200 | 1 135 750 | |
| 2017-08-01 |
|
4 | ESQ |
Esquire Financial Holdings, Inc.
Common Stock |
P - Purchase | 1 800 | 73 800 | 2,50 | 14,75 | 26 550 | 1 088 550 | |
| 2017-07-28 |
|
4 | ESQ |
Esquire Financial Holdings, Inc.
Common Stock |
P - Purchase | 10 000 | 72 000 | 16,13 | 14,75 | 147 500 | 1 062 000 | |
| 2017-07-27 |
|
4 | ESQ |
Esquire Financial Holdings, Inc.
Stock Options |
M - Exercise | -11 560 | 46 241 | -20,00 | ||||
| 2017-07-27 |
|
4 | ESQ |
Esquire Financial Holdings, Inc.
Stock Options |
M - Exercise | -9 000 | 0 | -100,00 | ||||
| 2017-07-27 |
|
4 | ESQ |
Esquire Financial Holdings, Inc.
Common Stock |
M - Exercise | 11 560 | 177 880 | 6,95 | 12,50 | 144 500 | 2 223 500 | |
| 2017-07-27 |
|
4 | ESQ |
Esquire Financial Holdings, Inc.
Common Stock |
M - Exercise | 9 000 | 166 320 | 5,72 | 12,50 | 112 500 | 2 079 000 | |
| 2017-07-27 |
|
4 | ESQ |
Esquire Financial Holdings, Inc.
Common Stock |
P - Purchase | 10 000 | 62 000 | 19,23 | 14,75 | 147 500 | 914 500 | |
| 2017-06-26 | 3 | ESQ |
Esquire Financial Holdings, Inc.
Common Stock |
379 240 | ||||||||
| 2017-06-26 | 3 | ESQ |
Esquire Financial Holdings, Inc.
Common Stock |
234 520 | ||||||||
| 2017-06-26 | 3 | ESQ |
Esquire Financial Holdings, Inc.
Common Stock |
273 920 | ||||||||
| 2017-06-26 | 3 | ESQ |
Esquire Financial Holdings, Inc.
Common Stock |
379 240 | ||||||||
| 2017-06-26 | 3 | ESQ |
Esquire Financial Holdings, Inc.
Common Stock |
234 520 | ||||||||
| 2017-06-26 | 3 | ESQ |
Esquire Financial Holdings, Inc.
Common Stock |
273 920 |
P
Otwarty rynek lub prywatny zakup niepochodnych lub pochodnych papierów wartościowych
S
Otwarty rynek lub prywatna sprzedaż niepochodnych lub pochodnych papierów wartościowych
A
Grant, nagroda lub inne nabycie papierów wartościowych od spółki (np. opcja)
C
Konwersja instrumentu pochodnego
D
Sprzedaż lub przeniesienie papierów wartościowych z powrotem do spółki
F
Zapłata ceny wykonania lub zobowiązania podatkowego z wykorzystaniem części papierów wartościowych otrzymanych od spółki
G
Darowizna papierów wartościowych przez lub na rzecz insidera
K
Swapy kapitałowe i podobne transakcje zabezpieczające
M
Wykonanie lub konwersja pochodnego papieru wartościowego otrzymanego od spółki (takiego jak opcja)
V
Transakcja dobrowolnie zgłoszona na Formularzu 4
J
Inne (wraz z przypisem opisującym transakcję)