Penguin Solutions, Inc.
Wstęp
Ta strona zawiera kompleksową analizę znanej historii wykorzystywania informacji poufnych w firmie Jack A Pacheco. Insiderzy to członkowie kadry kierowniczej, dyrektorzy lub znaczący inwestorzy w spółce. Dokonywanie transakcji w ich firmach w oparciu o określone, niepubliczne informacje jest nielegalne. Nie oznacza to, że dokonywanie jakichkolwiek transakcji we własnych firmach jest nielegalne. Muszą jednak zgłaszać wszystkie transakcje do SEC za pośrednictwem formularza 4. Pomimo tych ograniczeń badania akademickie sugerują, że insiderzy – ogólnie rzecz biorąc – mają tendencję do osiągania lepszych wyników na rynku w swoich własnych firmach.
Średnia rentowność handlu
Średnia rentowność handlu to średni zwrot ze wszystkich zakupów na otwartym rynku dokonanych przez osobę mającą dostęp do informacji poufnych w ciągu ostatnich trzech lat. Aby to obliczyć, badamy każdy nieplanowany zakup na otwartym rynku dokonany przez insidera, z wyłączeniem wszystkich transakcji oznaczonych jako część planu handlowego 10b5-1. Następnie obliczamy średnią wydajność tych transakcji w ciągu 3, 6 i 12 miesięcy, uśredniając każdy z tych okresów, aby wygenerować ostateczny wskaźnik wydajności dla każdej transakcji. Na koniec uśredniamy wszystkie wskaźniki wydajności, aby obliczyć wskaźnik wydajności dla insidera. Na tej liście znajdują się wyłącznie insiderzy, którzy dokonali co najmniej trzech transakcji w ciągu ostatnich dwóch lat.
Jeśli rentowność handlu insiderów jest oznaczona notką„nie dotyczy”, oznacza to, że insider albo nie dokonał żadnych zakupów na otwartym rynku w ciągu ostatnich trzech lat, albo transakcje, których dokonał, są zbyt nowe, aby obliczyć wiarygodny wskaźnik wydajności.
Częstotliwość aktualizacji: codziennie
Spółki posiadające zgłoszone stanowiska osób mających dostęp do poufnych informacji
Z dokumentów SEC wynika, że Jack A Pacheco zgłosił udziały lub transakcje w następujących spółkach:
| Papier wartościowy | Nazwa | Najnowsze raporty dotyczące udziałów |
|---|---|---|
| US:PENG / Penguin Solutions, Inc. | EVP, COO, Pres, Integrated Mem | 239 364 |
Jak interpretować wykresy
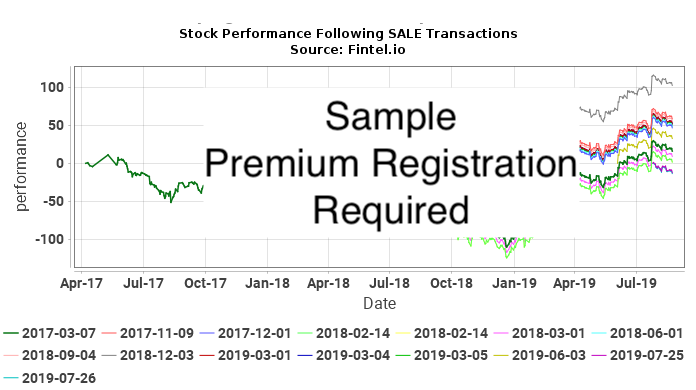
Poniższe wykresy przedstawiają notowania akcji papierów wartościowych po każdej niezaplanowanej transakcji na otwartym rynku dokonanej przez Jack A Pacheco. Nieplanowane transakcje to transakcje, które nie zostały dokonane w ramach planu handlowego 10b5-1. Notowania akcji przedstawiono na wykresie jako skumulowaną procentową zmianę ceny akcji. Na przykład, jeśli 1 stycznia 2019 r. dokonano transakcji poufnej, wykres pokaże dzienną procentową zmianę papieru wartościowego do dnia dzisiejszego. Jeżeli cena akcji wzrosłaby w tym czasie z 10 do 15 dolarów, skumulowana procentowa zmiana ceny akcji wyniosłaby 50%. Zmiana ceny z 10$ na 20$ będzie wynosić 100%, a zmiana ceny z 10$ na 5$ będzie wynosić -50%.
Ostatecznie staramy się określić, jak blisko transakcje insiderów korelują z nadmiernymi zwrotami (dodatnimi lub ujemnymi) z ceny akcji, aby sprawdzić, czy insider dostosowuje swoje transakcje w taki sposób, aby czerpać korzyści z informacji poufnych. Rozważmy sytuację, w której zrobił to ktoś z wewnątrz. W tej sytuacji oczekiwalibyśmy albo (a) dodatnich zwrotów po zakupach, albo (b) ujemnych zwrotów po sprzedaży. W przypadku (a) wykres ZAKUPU pokazywałby serię krzywych nachylonych w górę, wskazujących dodatnie zwroty po każdej transakcji zakupu. W przypadku (b) wykres SPRZEDAŻ pokazywałby serię krzywych o nachyleniu w dół, wskazujących ujemne zwroty po każdej transakcji sprzedaży.
Samo to jednak nie wystarczy, aby wyciągnąć wnioski. Gdyby np. cena akcji spółki przez wiele lat rosła niecyklicznie, to spodziewalibyśmy się, że wszystkie wykresy po zakupie będą wykazywały tendencję wzrostową. Podobnie niecykliczne spadki na przestrzeni wielu lat spowodowałyby spadek linii na wykresie po transakcjach. Żaden z tych wykresów nie sugeruje wykorzystywania informacji poufnych.
Najsilniejszym wskaźnikiem byłaby sytuacja, gdy cena akcji miała charakter wyjątkowo cykliczny, a na wykresie KUPNO występowały zarówno pozytywne sygnały na wykresie KUPNA, jak i negatywne na wykresie SPRZEDAŻY. Sytuacja ta wysoce sugerowałaby osobę mającą dostęp do informacji poufnych, która wykorzystywała transakcje w celu uzyskania korzyści finansowej.
Zakupy insidera PENG / Penguin Solutions, Inc. – krótkoterminowa analiza zysków
W tej części analizujemy rentowność każdego nieplanowanego zakupu od poufnych informacji na otwartym rynku dokonanego w PENG / Penguin Solutions, Inc.. Analiza ta pomaga zrozumieć, czy insider konsekwentnie generuje nietypowe zyski i czy warto ją śledzić. Analiza ta obejmuje okres jednego roku po każdej transakcji, a wyniki mają charakter teoretyczny .
Poniższa tabela przedstawia najnowsze zakupy na otwartym rynku, które nie były częścią planu handlu automatycznego.
| Data transakcji | Ticker | Insider | Zgłoszone Akcje |
Zgłoszona Cena |
Skorygowane Akcje |
Skorygowana Cena |
Podstawa kalkulacji kosztów | Dni do maks |
Cena maks |
Maks Zysk ($) |
Maksymalny zwrot (%) |
|---|---|---|---|---|---|---|---|
| Nie znane są żadne nieplanowane transakcje na otwarttm rynku dla tej kombinacji insidera i papieru wartościowego |
Cena skorygowana to cena skorygowana o podział. Akcje skorygowane to akcje skorygowane o podział.
Sprzedaż insidera PENG / Penguin Solutions, Inc. — analiza strat krótkoterminowych
W tej sekcji analizujemy możliwość uniknięcia krótkoterminowych strat w wyniku każdej nieplanowanej sprzedaży poufnych informacji na otwartym rynku dokonanej w PENG / Penguin Solutions, Inc.. Konsekwentny wzorzec unikania strat może sugerować, że przyszłe transakcje sprzedaży mogą przewidywać spadki cen. Analiza ta obejmuje okres jednego roku po każdej transakcji, a wyniki mają charakter teoretyczny .
Poniższa tabela przedstawia najnowsze sprzedaże na otwartym rynku, które nie były częścią planu handlu automatycznego.
Cena skorygowana to cena skorygowana o podział. Akcje skorygowane to akcje skorygowane o podział.
Historia handlu insiderów
Ta tabela przedstawia pełną listę transakcji insiderów dokonanych przez firmę Jack A Pacheco ujawnioną Komisji Papierów Wartościowych (SEC).
| Data pliku | Data trans | Formularz | Ticker | Bezpieczeństwo | Kod | Akcje | Pozostałe akcje | Zmiana procent |
Cena udziału |
Wartość trans |
Pozostała Wartość |
|
|---|---|---|---|---|---|---|---|---|---|---|---|---|
| 2025-10-22 |
|
4 | PENG |
Penguin Solutions, Inc.
Common Stock |
F - Taxes | -11 778 | 239 364 | -4,69 | 21,74 | -256 054 | 5 203 773 | |
| 2025-10-16 |
|
4 | PENG |
Penguin Solutions, Inc.
Common Stock |
F - Taxes | -24 669 | 251 142 | -8,94 | 22,32 | -550 612 | 5 605 489 | |
| 2025-10-16 |
|
4 | PENG |
Penguin Solutions, Inc.
Common Stock |
A - Award | 48 580 | 275 811 | 21,38 | ||||
| 2025-07-22 |
|
4 | PENG |
Penguin Solutions, Inc.
Common Stock |
S - Sale | X | -60 000 | 227 231 | -20,89 | 24,83 | -1 489 992 | 5 642 873 |
| 2025-07-22 |
|
4 | PENG |
Penguin Solutions, Inc.
Common Stock |
M - Exercise | 60 000 | 287 231 | 26,40 | 10,78 | 646 500 | 3 094 914 | |
| 2025-07-22 |
|
4 | PENG |
Penguin Solutions, Inc.
Common Stock |
S - Sale | X | -3 447 | 227 231 | -1,49 | 24,84 | -85 608 | 5 643 418 |
| 2025-07-22 |
|
4 | PENG |
Penguin Solutions, Inc.
Common Stock |
M - Exercise | 3 447 | 230 678 | 1,52 | 9,20 | 31 695 | 2 121 084 | |
| 2025-07-22 |
|
4 | PENG |
Penguin Solutions, Inc.
Common Stock |
F - Taxes | -2 158 | 227 231 | -0,94 | 24,43 | -52 720 | 5 551 253 | |
| 2025-04-22 |
|
4 | PENG |
Penguin Solutions, Inc.
Ordinary Shares |
F - Taxes | -2 159 | 229 389 | -0,93 | 15,88 | -34 285 | 3 642 697 | |
| 2025-03-26 |
|
4 | PENG |
Penguin Solutions, Inc.
Ordinary Shares |
S - Sale | X | -3 219 | 231 548 | -1,37 | 20,00 | -64 386 | 4 631 423 |
| 2025-03-26 |
|
4 | PENG |
Penguin Solutions, Inc.
Ordinary Shares |
M - Exercise | 3 219 | 234 767 | 1,39 | 9,20 | 29 599 | 2 158 683 | |
| 2025-02-21 |
|
4 | PENG |
Penguin Solutions, Inc.
Ordinary Shares |
S - Sale | X | -6 667 | 231 548 | -2,80 | 22,14 | -147 594 | 5 126 010 |
| 2025-02-21 |
|
4 | PENG |
Penguin Solutions, Inc.
Ordinary Shares |
M - Exercise | 6 667 | 238 215 | 2,88 | 9,20 | 61 303 | 2 190 387 | |
| 2025-01-22 |
|
4 | PENG |
Penguin Solutions, Inc.
Ordinary Shares |
S - Sale | X | -6 667 | 231 548 | -2,80 | 20,55 | -137 024 | 4 758 913 |
| 2025-01-22 |
|
4 | PENG |
Penguin Solutions, Inc.
Ordinary Shares |
M - Exercise | 6 667 | 238 215 | 2,88 | 9,20 | 61 303 | 2 190 387 | |
| 2025-01-22 |
|
4 | PENG |
Penguin Solutions, Inc.
Ordinary Shares |
F - Taxes | -4 412 | 231 548 | -1,87 | 20,51 | -90 490 | 4 749 049 | |
| 2024-12-27 |
|
4 | PENG |
Penguin Solutions, Inc.
Ordinary Shares |
S - Sale | X | -6 666 | 235 960 | -2,75 | 20,00 | -133 320 | 4 719 200 |
| 2024-12-27 |
|
4 | PENG |
Penguin Solutions, Inc.
Ordinary Shares |
M - Exercise | 6 666 | 242 626 | 2,83 | 9,20 | 61 294 | 2 230 946 | |
| 2024-12-11 |
|
4 | PENG |
Penguin Solutions, Inc.
Ordinary Shares |
S - Sale | X | -13 334 | 235 960 | -5,35 | 20,05 | -267 367 | 4 731 352 |
| 2024-12-11 |
|
4 | PENG |
Penguin Solutions, Inc.
Ordinary Shares |
M - Exercise | 13 334 | 249 294 | 5,65 | 9,20 | 122 606 | 2 292 258 | |
| 2024-10-22 |
|
4 | PENG |
Penguin Solutions, Inc.
Ordinary Shares |
F - Taxes | -4 057 | 235 960 | -1,69 | 15,69 | -63 654 | 3 702 212 | |
| 2024-10-22 |
|
4 | PENG |
Penguin Solutions, Inc.
Ordinary Shares |
F - Taxes | -9 438 | 240 017 | -3,78 | 15,69 | -148 082 | 3 765 867 | |
| 2024-10-22 |
|
4 | PENG |
Penguin Solutions, Inc.
Ordinary Shares |
A - Award | 18 622 | 249 455 | 8,07 | ||||
| 2024-10-02 |
|
4 | SGH |
SMART Global Holdings, Inc.
Ordinary Shares |
A - Award | 18 937 | 230 833 | 8,94 | ||||
| 2024-09-24 |
|
4 | SGH |
SMART Global Holdings, Inc.
Ordinary Shares |
S - Sale | X | -13 334 | 211 896 | -5,92 | 20,02 | -266 951 | 4 242 221 |
| 2024-09-24 |
|
4 | SGH |
SMART Global Holdings, Inc.
Ordinary Shares |
M - Exercise | 13 334 | 225 230 | 6,29 | 9,20 | 122 606 | 2 070 990 | |
| 2024-08-22 |
|
4 | SGH |
SMART Global Holdings, Inc.
Ordinary Shares |
S - Sale | X | -13 333 | 211 896 | -5,92 | 21,14 | -281 822 | 4 478 888 |
| 2024-08-22 |
|
4 | SGH |
SMART Global Holdings, Inc.
Ordinary Shares |
M - Exercise | 13 333 | 225 229 | 6,29 | 9,20 | 122 597 | 2 070 981 | |
| 2024-07-30 |
|
4 | SGH |
SMART Global Holdings, Inc.
Ordinary Shares |
S - Sale | X | -13 333 | 211 896 | -5,92 | 23,16 | -308 835 | 4 908 189 |
| 2024-07-30 |
|
4 | SGH |
SMART Global Holdings, Inc.
Ordinary Shares |
M - Exercise | 13 333 | 225 229 | 6,29 | 9,20 | 122 597 | 2 070 981 | |
| 2024-07-23 |
|
4 | SGH |
SMART Global Holdings, Inc.
Ordinary Shares |
F - Taxes | -4 055 | 211 896 | -1,88 | 23,86 | -96 752 | 5 055 839 | |
| 2024-04-23 |
|
4 | SGH |
SMART Global Holdings, Inc.
Ordinary Shares |
F - Taxes | -4 056 | 215 951 | -1,84 | 16,92 | -68 628 | 3 653 891 | |
| 2024-02-22 |
|
4 | SGH |
SMART Global Holdings, Inc.
Ordinary Shares |
S - Sale | X | -2 500 | 220 007 | -1,12 | 20,02 | -50 061 | 4 405 486 |
| 2024-02-22 |
|
4 | SGH |
SMART Global Holdings, Inc.
Ordinary Shares |
M - Exercise | 2 500 | 222 507 | 1,14 | 9,20 | 22 988 | 2 045 952 | |
| 2024-01-23 |
|
4 | SGH |
SMART Global Holdings, Inc.
Ordinary Shares |
S - Sale | X | -100 | 220 007 | -0,05 | 23,22 | -2 322 | 5 108 563 |
| 2024-01-23 |
|
4 | SGH |
SMART Global Holdings, Inc.
Ordinary Shares |
S - Sale | X | -2 400 | 220 107 | -1,08 | 22,50 | -53 990 | 4 951 527 |
| 2024-01-23 |
|
4 | SGH |
SMART Global Holdings, Inc.
Ordinary Shares |
M - Exercise | 2 500 | 222 507 | 1,14 | 9,20 | 22 988 | 2 045 952 | |
| 2024-01-23 |
|
4 | SGH |
SMART Global Holdings, Inc.
Ordinary Shares |
F - Taxes | -4 055 | 220 007 | -1,81 | 22,89 | -92 819 | 5 035 960 | |
| 2024-01-12 |
|
4 | SGH |
SMART Global Holdings, Inc.
Ordinary Shares |
S - Sale | X | -7 500 | 224 062 | -3,24 | 20,90 | -156 756 | 4 683 075 |
| 2024-01-12 |
|
4 | SGH |
SMART Global Holdings, Inc.
Ordinary Shares |
M - Exercise | 7 500 | 231 562 | 3,35 | 9,20 | 68 962 | 2 129 213 | |
| 2023-10-24 |
|
4 | SGH |
SMART Global Holdings, Inc.
Ordinary Shares |
F - Taxes | -1 984 | 224 062 | -0,88 | 14,27 | -28 312 | 3 197 365 | |
| 2023-10-24 |
|
4 | SGH |
SMART Global Holdings, Inc.
Ordinary Shares |
F - Taxes | -3 137 | 226 046 | -1,37 | 14,27 | -44 765 | 3 225 676 | |
| 2023-09-27 |
|
4 | SGH |
SMART Global Holdings, Inc.
Ordinary Shares |
A - Award | 26 808 | 229 183 | 13,25 | ||||
| 2023-09-22 |
|
4 | SGH |
SMART Global Holdings, Inc.
Ordinary Shares |
S - Sale | X | -2 500 | 202 375 | -1,22 | 23,37 | -58 419 | 4 729 038 |
| 2023-09-22 |
|
4 | SGH |
SMART Global Holdings, Inc.
Ordinary Shares |
M - Exercise | 2 500 | 204 875 | 1,24 | 9,20 | 22 988 | 1 883 826 | |
| 2023-08-25 |
|
4 | SGH |
SMART Global Holdings, Inc.
Ordinary Shares |
S - Sale | X | -5 000 | 202 375 | -2,41 | 25,08 | -125 375 | 5 074 553 |
| 2023-08-25 |
|
4 | SGH |
SMART Global Holdings, Inc.
Ordinary Shares |
M - Exercise | 5 000 | 207 375 | 2,47 | 10,78 | 53 900 | 2 235 502 | |
| 2023-08-23 |
|
4 | SGH |
SMART Global Holdings, Inc.
Ordinary Shares |
S - Sale | X | -2 500 | 202 375 | -1,22 | 23,57 | -58 913 | 4 769 007 |
| 2023-08-23 |
|
4 | SGH |
SMART Global Holdings, Inc.
Ordinary Shares |
M - Exercise | 2 500 | 204 875 | 1,24 | 9,20 | 22 988 | 1 883 826 | |
| 2023-07-24 |
|
4 | SGH |
SMART Global Holdings, Inc.
Ordinary Shares |
S - Sale | X | -7 500 | 202 375 | -3,57 | 25,48 | -191 102 | 5 156 576 |
| 2023-07-24 |
|
4 | SGH |
SMART Global Holdings, Inc.
Ordinary Shares |
M - Exercise | 5 000 | 209 875 | 2,44 | 10,78 | 53 900 | 2 262 452 | |
| 2023-07-24 |
|
4 | SGH |
SMART Global Holdings, Inc.
Ordinary Shares |
M - Exercise | 2 500 | 204 875 | 1,24 | 9,20 | 22 988 | 1 883 826 | |
| 2023-07-24 |
|
4 | SGH |
SMART Global Holdings, Inc.
Ordinary Shares |
F - Taxes | -3 136 | 202 375 | -1,53 | 26,00 | -81 536 | 5 261 750 | |
| 2023-06-22 |
|
4 | SGH |
SMART Global Holdings, Inc.
Ordinary Shares |
S - Sale | X | -7 500 | 205 511 | -3,52 | 27,00 | -202 506 | 5 548 961 |
| 2023-06-22 |
|
4 | SGH |
SMART Global Holdings, Inc.
Ordinary Shares |
M - Exercise | 5 000 | 213 011 | 2,40 | 10,78 | 53 900 | 2 296 259 | |
| 2023-06-22 |
|
4 | SGH |
SMART Global Holdings, Inc.
Ordinary Shares |
M - Exercise | 2 500 | 208 011 | 1,22 | 9,20 | 22 988 | 1 912 661 | |
| 2023-06-15 |
|
4 | SGH |
SMART Global Holdings, Inc.
Ordinary Shares |
S - Sale | X | -15 000 | 205 511 | -6,80 | 25,00 | -375 006 | 5 137 857 |
| 2023-06-15 |
|
4 | SGH |
SMART Global Holdings, Inc.
Ordinary Shares |
M - Exercise | 5 000 | 220 511 | 2,32 | 10,78 | 53 900 | 2 377 109 | |
| 2023-06-15 |
|
4 | SGH |
SMART Global Holdings, Inc.
Ordinary Shares |
M - Exercise | 10 000 | 215 511 | 4,87 | 9,20 | 91 950 | 1 981 624 | |
| 2023-05-23 |
|
4 | SGH |
SMART Global Holdings, Inc.
Ordinary Shares |
S - Sale | X | -2 500 | 205 511 | -1,20 | 20,00 | -50 000 | 4 110 220 |
| 2023-05-23 |
|
4 | SGH |
SMART Global Holdings, Inc.
Ordinary Shares |
M - Exercise | 2 500 | 208 011 | 1,22 | 9,20 | 22 988 | 1 912 661 | |
| 2023-05-23 |
|
4 | SGH |
SMART Global Holdings, Inc.
Ordinary Shares |
S - Sale | X | -5 000 | 205 511 | -2,38 | 20,00 | -100 000 | 4 110 220 |
| 2023-05-23 |
|
4 | SGH |
SMART Global Holdings, Inc.
Ordinary Shares |
M - Exercise | 5 000 | 210 511 | 2,43 | 9,20 | 45 975 | 1 935 649 | |
| 2023-04-24 |
|
4 | SGH |
SMART Global Holdings, Inc.
Ordinary Shares |
F - Taxes | -1 384 | 205 511 | -0,67 | 16,35 | -22 628 | 3 360 105 | |
| 2023-04-24 |
|
4 | SGH |
SMART Global Holdings, Inc.
Ordinary Shares |
F - Taxes | -4 954 | 206 895 | -2,34 | 16,35 | -80 998 | 3 382 733 | |
| 2023-01-24 |
|
4 | SGH |
SMART Global Holdings, Inc.
Ordinary Shares |
F - Taxes | -2 580 | 211 849 | -1,20 | 16,54 | -42 673 | 3 503 982 | |
| 2022-10-24 |
|
4 | SGH |
SMART Global Holdings, Inc.
Ordinary Shares |
F - Taxes | -1 984 | 214 429 | -0,92 | 13,00 | -25 792 | 2 787 577 | |
| 2022-10-24 |
|
4 | SGH |
SMART Global Holdings, Inc.
Ordinary Shares |
F - Taxes | -7 918 | 216 413 | -3,53 | 13,00 | -102 934 | 2 813 369 | |
| 2022-09-28 |
|
4 | SGH |
SMART Global Holdings, Inc.
Ordinary Shares |
A - Award | 24 290 | 224 331 | 12,14 | ||||
| 2022-07-22 |
|
4 | SGH |
SMART Global Holdings, Inc.
Ordinary Shares |
F - Taxes | -1 577 | 200 041 | -0,78 | 18,40 | -29 017 | 3 680 754 | |
| 2022-04-22 |
|
4 | SGH |
SMART Global Holdings, Inc.
Ordinary Shares |
F - Taxes | -5 448 | 201 618 | -2,63 | 24,51 | -133 530 | 4 941 657 | |
| 2022-01-24 |
|
4 | SGH |
SMART Global Holdings, Inc.
Ordinary Shares |
S - Sale | -2 602 | 103 533 | -2,45 | 61,06 | -158 878 | 6 321 725 | |
| 2021-10-22 |
|
4 | SGH |
SMART Global Holdings, Inc.
Ordinary Shares |
F - Taxes | -3 966 | 106 135 | -3,60 | 51,94 | -205 994 | 5 512 652 | |
| 2021-10-22 |
|
4 | SGH |
SMART Global Holdings, Inc.
Ordinary Shares |
A - Award | 12 000 | 102 409 | 13,27 | ||||
| 2021-10-07 |
|
4 | SGH |
SMART Global Holdings, Inc.
Ordinary Shares |
F - Taxes | -743 | 98 101 | -0,75 | 44,08 | -32 751 | 4 324 292 | |
| 2021-10-05 |
|
4 | SGH |
SMART Global Holdings, Inc.
Ordinary Shares |
A - Award | 8 435 | 98 844 | 9,33 | ||||
| 2021-08-24 |
|
4 | SGH |
SMART Global Holdings, Inc.
Employee Stock Option (right to buy) |
M - Exercise | -7 500 | 40 000 | -15,79 | ||||
| 2021-08-24 |
|
4 | SGH |
SMART Global Holdings, Inc.
Ordinary Shares |
S - Sale | X | -644 | 90 409 | -0,71 | 42,57 | -27 416 | 3 848 774 |
| 2021-08-24 |
|
4 | SGH |
SMART Global Holdings, Inc.
Ordinary Shares |
S - Sale | X | -6 856 | 91 053 | -7,00 | 42,04 | -288 232 | 3 827 950 |
| 2021-08-24 |
|
4 | SGH |
SMART Global Holdings, Inc.
Ordinary Shares |
M - Exercise | 7 500 | 97 909 | 8,30 | 21,55 | 161 625 | 2 109 939 | |
| 2021-07-22 |
|
4 | SGH |
SMART Global Holdings, Inc.
Employee Stock Option (right to buy) |
M - Exercise | -7 500 | 47 500 | -13,64 | ||||
| 2021-07-22 |
|
4 | SGH |
SMART Global Holdings, Inc.
Ordinary Shares |
S - Sale | X | -745 | 90 409 | -0,82 | 47,53 | -35 407 | 4 296 760 |
| 2021-07-22 |
|
4 | SGH |
SMART Global Holdings, Inc.
Ordinary Shares |
S - Sale | X | -6 755 | 91 154 | -6,90 | 46,91 | -316 908 | 4 276 453 |
| 2021-07-22 |
|
4 | SGH |
SMART Global Holdings, Inc.
Ordinary Shares |
M - Exercise | 7 500 | 97 909 | 8,30 | 21,55 | 161 625 | 2 109 939 | |
| 2021-07-07 |
|
4 | SGH |
SMART Global Holdings, Inc.
Ordinary Shares |
F - Taxes | -743 | 90 409 | -0,82 | 48,10 | -35 738 | 4 348 673 | |
| 2021-06-23 |
|
4 | SGH |
SMART Global Holdings, Inc.
Employee Stock Option (right to buy) |
M - Exercise | -7 500 | 55 000 | -12,00 | ||||
| 2021-06-23 |
|
4 | SGH |
SMART Global Holdings, Inc.
Ordinary Shares |
S - Sale | X | -7 500 | 91 152 | -7,60 | 43,96 | -329 733 | 4 007 443 |
| 2021-06-23 |
|
4 | SGH |
SMART Global Holdings, Inc.
Ordinary Shares |
M - Exercise | 7 500 | 98 652 | 8,23 | 21,55 | 161 625 | 2 125 951 | |
| 2021-05-24 |
|
4 | SGH |
SMART Global Holdings, Inc.
Employee Stock Option (right to buy) |
M - Exercise | -7 500 | 62 500 | -10,71 | ||||
| 2021-05-24 |
|
4 | SGH |
SMART Global Holdings, Inc.
Ordinary Shares |
S - Sale | X | -1 200 | 91 152 | -1,30 | 45,58 | -54 696 | 4 154 745 |
| 2021-05-24 |
|
4 | SGH |
SMART Global Holdings, Inc.
Ordinary Shares |
S - Sale | X | -6 300 | 92 352 | -6,39 | 45,08 | -284 035 | 4 163 681 |
| 2021-05-24 |
|
4 | SGH |
SMART Global Holdings, Inc.
Ordinary Shares |
M - Exercise | X | 7 500 | 98 652 | 8,23 | 21,55 | 161 625 | 2 125 951 |
| 2021-04-22 |
|
4 | SGH |
SMART Global Holdings, Inc.
Ordinary Shares |
S - Sale | X | -373 | 91 152 | -0,41 | 55,69 | -20 772 | 5 076 255 |
| 2021-04-22 |
|
4 | SGH |
SMART Global Holdings, Inc.
Ordinary Shares |
F - Taxes | -2 766 | 91 525 | -2,93 | 55,33 | -153 043 | 5 064 078 | |
| 2021-04-08 |
|
4 | SGH |
SMART Global Holdings, Inc.
Ordinary Shares |
F - Taxes | -515 | 94 291 | -0,54 | 48,55 | -25 003 | 4 577 828 | |
| 2021-03-23 |
|
4 | SGH |
SMART Global Holdings, Inc.
Ordinary Shares |
S - Sale | -400 | 94 806 | -0,42 | 46,89 | -18 755 | 4 445 216 | |
| 2021-03-23 |
|
4 | SGH |
SMART Global Holdings, Inc.
Ordinary Shares |
S - Sale | -3 350 | 95 206 | -3,40 | 46,17 | -154 679 | 4 395 928 | |
| 2021-01-07 |
|
4 | SGH |
SMART Global Holdings, Inc.
Ordinary Shares |
F - Taxes | -616 | 98 556 | -0,62 | 38,64 | -23 802 | 3 808 204 | |
| 2020-12-23 |
|
4 | SGH |
SMART Global Holdings, Inc.
Employee Stock Option (right to buy) |
M - Exercise | -753 | 0 | -100,00 | ||||
| 2020-12-23 |
|
4 | SGH |
SMART Global Holdings, Inc.
Employee Stock Option (right to buy) |
M - Exercise | -2 230 | 0 | -100,00 | ||||
| 2020-12-23 |
|
4 | SGH |
SMART Global Holdings, Inc.
Ordinary Shares |
S - Sale | -2 983 | 99 172 | -2,92 | 32,93 | -98 227 | 3 265 625 | |
| 2020-12-23 |
|
4 | SGH |
SMART Global Holdings, Inc.
Ordinary Shares |
M - Exercise | 753 | 102 155 | 0,74 | 11,55 | 8 697 | 1 179 890 | |
| 2020-12-23 |
|
4 | SGH |
SMART Global Holdings, Inc.
Ordinary Shares |
M - Exercise | 2 230 | 101 402 | 2,25 | 24,93 | 55 594 | 2 527 952 | |
| 2020-12-16 |
|
4 | SGH |
SMART Global Holdings, Inc.
Ordinary Shares |
A - Award | 30 000 | 99 172 | 43,37 | ||||
| 2020-11-24 |
|
4 | SGH |
SMART Global Holdings, Inc.
Employee Stock Option (right to buy) |
M - Exercise | -4 000 | 2 230 | -64,21 | ||||
| 2020-11-24 |
|
4 | SGH |
SMART Global Holdings, Inc.
Ordinary Shares |
S - Sale | -4 000 | 69 172 | -5,47 | 30,18 | -120 708 | 2 087 410 | |
| 2020-11-24 |
|
4 | SGH |
SMART Global Holdings, Inc.
Ordinary Shares |
M - Exercise | 4 000 | 73 172 | 5,78 | 24,93 | 99 720 | 1 824 178 | |
| 2020-11-24 |
|
4 | SGH |
SMART Global Holdings, Inc.
Employee Stock Option (right to buy) |
M - Exercise | -3 500 | 6 230 | -35,97 | ||||
| 2020-11-24 |
|
4 | SGH |
SMART Global Holdings, Inc.
Ordinary Shares |
S - Sale | -3 500 | 69 172 | -4,82 | 30,06 | -105 214 | 2 079 393 | |
| 2020-11-24 |
|
4 | SGH |
SMART Global Holdings, Inc.
Ordinary Shares |
M - Exercise | 3 500 | 72 672 | 5,06 | 24,93 | 87 255 | 1 811 713 | |
| 2020-11-10 |
|
4 | SGH |
SMART Global Holdings, Inc.
Employee Stock Option (right to buy) |
M - Exercise | -35 400 | 9 730 | -78,44 | ||||
| 2020-11-10 |
|
4 | SGH |
SMART Global Holdings, Inc.
Ordinary Shares |
S - Sale | -49 005 | 69 172 | -41,47 | 30,31 | -1 485 302 | 2 096 548 | |
| 2020-11-10 |
|
4 | SGH |
SMART Global Holdings, Inc.
Ordinary Shares |
M - Exercise | 35 400 | 118 177 | 42,77 | 24,93 | 882 522 | 2 946 153 | |
| 2020-11-10 |
|
4 | SGH |
SMART Global Holdings, Inc.
Employee Stock Option (right to buy) |
M - Exercise | -2 100 | 45 130 | -4,45 | ||||
| 2020-11-10 |
|
4 | SGH |
SMART Global Holdings, Inc.
Ordinary Shares |
S - Sale | -3 495 | 82 777 | -4,05 | 30,00 | -104 857 | 2 483 484 | |
| 2020-11-10 |
|
4 | SGH |
SMART Global Holdings, Inc.
Ordinary Shares |
M - Exercise | 2 100 | 86 272 | 2,49 | 24,93 | 52 353 | 2 150 761 | |
| 2020-10-06 |
|
4 | SGH |
SMART Global Holdings, Inc.
Ordinary Shares |
F - Taxes | -518 | 84 172 | -0,61 | 24,89 | -12 893 | 2 095 041 | |
| 2020-07-07 |
|
4 | SGH |
SMART Global Holdings, Inc.
Ordinary Shares |
F - Taxes | -518 | 84 690 | -0,61 | 27,03 | -14 002 | 2 289 171 | |
| 2020-06-09 |
|
4 | SGH |
SMART Global Holdings, Inc.
Employee Stock Option (right to buy) |
M - Exercise | -7 500 | 47 230 | -13,70 | ||||
| 2020-06-09 |
|
4 | SGH |
SMART Global Holdings, Inc.
Ordinary Shares |
S - Sale | -3 750 | 85 208 | -4,22 | 30,00 | -112 500 | 2 556 240 | |
| 2020-06-09 |
|
4 | SGH |
SMART Global Holdings, Inc.
Ordinary Shares |
S - Sale | -7 500 | 88 958 | -7,78 | 30,00 | -225 000 | 2 668 740 | |
| 2020-06-09 |
|
4 | SGH |
SMART Global Holdings, Inc.
Ordinary Shares |
M - Exercise | X | 7 500 | 96 458 | 8,43 | 24,93 | 186 975 | 2 404 698 |
| 2020-04-07 |
|
4 | SGH |
SMART Global Holdings, Inc.
Ordinary Shares |
F - Taxes | -518 | 88 958 | -0,58 | 20,67 | -10 707 | 1 838 762 | |
| 2020-03-16 |
|
4 | SGH |
SMART Global Holdings, Inc.
Employee Stock Options (right to buy) |
A - Award | 60 000 | 60 000 | |||||
| 2020-03-16 |
|
4 | SGH |
SMART Global Holdings, Inc.
Ordinary Shares |
A - Award | 24 000 | 89 476 | 36,65 | ||||
| 2020-01-31 |
|
4 | SGH |
SMART Global Holdings, Inc.
Ordinary Shares |
F - Taxes | -6 636 | 65 476 | -9,20 | 32,12 | -213 148 | 2 103 089 | |
| 2020-01-07 |
|
4 | SGH |
SMART Global Holdings, Inc.
Ordinary Shares |
F - Taxes | -613 | 72 112 | -0,84 | 37,75 | -23 141 | 2 722 228 | |
| 2019-10-08 |
|
4 | SGH |
SMART Global Holdings, Inc.
Ordinary Shares |
F - Taxes | -743 | 72 725 | -1,01 | 27,29 | -20 276 | 1 984 665 | |
| 2019-08-01 |
|
4 | SGH |
SMART Global Holdings, Inc.
Ordinary Shares |
F - Taxes | -8 668 | 73 468 | -10,55 | 31,99 | -277 289 | 2 350 241 | |
| 2019-07-24 |
|
4 | SGH |
SMART Global Holdings, Inc.
Ordinary Shares |
F - Taxes | -518 | 82 136 | -0,63 | 24,34 | -12 608 | 1 999 190 | |
| 2019-04-09 |
|
4 | SGH |
SMART Global Holdings, Inc.
Ordinary Shares |
F - Taxes | -518 | 82 654 | -0,62 | 21,58 | -11 178 | 1 783 673 | |
| 2019-02-01 |
|
4 | SGH |
SMART Global Holdings, Inc.
Ordinary Shares |
F - Taxes | -6 384 | 83 172 | -7,13 | 23,81 | -152 003 | 1 980 325 | |
| 2019-01-25 |
|
4 | SGH |
SMART Global Holdings, Inc.
Employee Stock Options (right to buy) |
A - Award | 70 000 | 70 000 | |||||
| 2019-01-08 |
|
4 | SGH |
SMART Global Holdings, Inc.
Ordinary Shares |
F - Taxes | -2 338 | 89 556 | -2,54 | 29,65 | -69 322 | 2 655 335 | |
| 2018-10-24 |
|
4 | SGH |
SMART Global Holdings, Inc.
Employee Stock Options (right to buy) |
M - Exercise | -7 500 | 753 | -90,88 | ||||
| 2018-10-24 |
|
4 | SGH |
SMART Global Holdings, Inc.
Ordinary Shares |
S - Sale | -796 | 91 894 | -0,86 | 29,53 | -23 506 | 2 713 630 | |
| 2018-10-24 |
|
4 | SGH |
SMART Global Holdings, Inc.
Ordinary Shares |
S - Sale | -6 704 | 92 690 | -6,74 | 29,07 | -194 885 | 2 694 498 | |
| 2018-10-24 |
|
4 | SGH |
SMART Global Holdings, Inc.
Ordinary Shares |
M - Exercise | X | 7 500 | 99 394 | 8,16 | 11,55 | 86 625 | 1 148 001 |
| 2018-09-21 |
|
4 | SGH |
SMART Global Holdings, Inc.
Employee Stock Options (right to buy) |
M - Exercise | -7 500 | 8 253 | -47,61 | ||||
| 2018-09-21 |
|
4 | SGH |
SMART Global Holdings, Inc.
Ordinary Shares |
S - Sale | -7 500 | 91 894 | -7,55 | 30,25 | -226 875 | 2 779 794 | |
| 2018-09-21 |
|
4 | SGH |
SMART Global Holdings, Inc.
Ordinary Shares |
M - Exercise | X | 7 500 | 99 394 | 8,16 | 11,55 | 86 625 | 1 148 001 |
| 2018-08-23 |
|
4 | SGH |
SMART Global Holdings, Inc.
Employee Stock Options (right to buy) |
M - Exercise | -7 500 | 15 753 | -32,25 | ||||
| 2018-08-23 |
|
4 | SGH |
SMART Global Holdings, Inc.
Ordinary Shares |
S - Sale | -7 500 | 91 894 | -7,55 | 31,59 | -236 925 | 2 902 931 | |
| 2018-08-23 |
|
4 | SGH |
SMART Global Holdings, Inc.
Ordinary Shares |
M - Exercise | X | 7 500 | 99 394 | 8,16 | 11,55 | 86 625 | 1 148 001 |
| 2018-08-01 |
|
4 | SGH |
SMART Global Holdings, Inc.
Ordinary Shares |
S - Sale | X | -5 848 | 91 894 | -5,98 | 31,83 | -186 142 | 2 924 986 |
| 2018-08-01 |
|
4 | SGH |
SMART Global Holdings, Inc.
Ordinary Shares |
S - Sale | X | -12 577 | 97 742 | -11,40 | 30,54 | -384 102 | 2 985 041 |
| 2018-07-24 |
|
4 | SGH |
SMART Global Holdings, Inc.
Employee Stock Options (right to buy) |
M - Exercise | -7 500 | 23 253 | -24,39 | ||||
| 2018-07-24 |
|
4 | SGH |
SMART Global Holdings, Inc.
Ordinary Shares |
S - Sale | X | -3 985 | 110 319 | -3,49 | 31,94 | -127 281 | 3 523 589 |
| 2018-07-24 |
|
4 | SGH |
SMART Global Holdings, Inc.
Ordinary Shares |
S - Sale | X | -3 515 | 114 304 | -2,98 | 31,46 | -110 582 | 3 596 004 |
| 2018-07-24 |
|
4 | SGH |
SMART Global Holdings, Inc.
Ordinary Shares |
M - Exercise | 7 500 | 117 819 | 6,80 | 11,55 | 86 625 | 1 360 809 | |
| 2018-06-25 |
|
4 | SGH |
SMART Global Holdings, Inc.
Employee Stock Options (right to buy) |
M - Exercise | -7 500 | 30 753 | -19,61 | ||||
| 2018-06-25 |
|
4 | SGH |
SMART Global Holdings, Inc.
Ordinary Shares |
S - Sale | X | -101 | 110 319 | -0,09 | 41,99 | -4 241 | 4 632 295 |
| 2018-06-25 |
|
4 | SGH |
SMART Global Holdings, Inc.
Ordinary Shares |
S - Sale | X | -1 563 | 110 420 | -1,40 | 40,89 | -63 911 | 4 515 074 |
| 2018-06-25 |
|
4 | SGH |
SMART Global Holdings, Inc.
Ordinary Shares |
S - Sale | X | -5 836 | 111 983 | -4,95 | 40,09 | -233 965 | 4 489 398 |
| 2018-06-25 |
|
4 | SGH |
SMART Global Holdings, Inc.
Ordinary Shares |
M - Exercise | 7 500 | 117 819 | 6,80 | 11,55 | 86 625 | 1 360 809 | |
| 2018-05-22 |
|
4 | SGH |
SMART Global Holdings, Inc.
Employee Stock Options (right to buy) |
M - Exercise | -7 500 | 38 253 | -16,39 | ||||
| 2018-05-22 |
|
4 | SGH |
SMART Global Holdings, Inc.
Ordinary Shares |
S - Sale | X | -500 | 110 319 | -0,45 | 44,58 | -22 292 | 4 918 462 |
| 2018-05-22 |
|
4 | SGH |
SMART Global Holdings, Inc.
Ordinary Shares |
S - Sale | X | -7 000 | 110 819 | -5,94 | 43,83 | -306 836 | 4 857 607 |
| 2018-05-22 |
|
4 | SGH |
SMART Global Holdings, Inc.
Ordinary Shares |
M - Exercise | 7 500 | 117 819 | 6,80 | 11,55 | 86 625 | 1 360 809 | |
| 2018-04-25 |
|
4 | SGH |
SMART Global Holdings, Inc.
Employee Stock Options (right to buy) |
M - Exercise | -7 500 | 45 753 | -14,08 | ||||
| 2018-04-25 |
|
4 | SGH |
SMART Global Holdings, Inc.
Ordinary Shares |
S - Sale | X | -1 300 | 110 319 | -1,16 | 41,51 | -53 968 | 4 579 761 |
| 2018-04-25 |
|
4 | SGH |
SMART Global Holdings, Inc.
Ordinary Shares |
S - Sale | X | -3 495 | 111 619 | -3,04 | 40,58 | -141 840 | 4 529 923 |
| 2018-04-25 |
|
4 | SGH |
SMART Global Holdings, Inc.
Ordinary Shares |
S - Sale | X | -2 705 | 115 114 | -2,30 | 39,12 | -105 812 | 4 502 926 |
| 2018-04-25 |
|
4 | SGH |
SMART Global Holdings, Inc.
Ordinary Shares |
M - Exercise | 7 500 | 117 819 | 6,80 | 11,55 | 86 625 | 1 360 809 | |
| 2018-03-23 |
|
4 | SGH |
SMART Global Holdings, Inc.
Employee Stock Options (right to buy) |
M - Exercise | -7 500 | 53 253 | -12,35 | ||||
| 2018-03-23 |
|
4 | SGH |
SMART Global Holdings, Inc.
Ordinary Shares |
S - Sale | -2 501 | 110 319 | -2,22 | 47,02 | -117 601 | 5 187 376 | |
| 2018-03-23 |
|
4 | SGH |
SMART Global Holdings, Inc.
Ordinary Shares |
S - Sale | -4 999 | 112 820 | -4,24 | 46,29 | -231 387 | 5 222 054 | |
| 2018-03-23 |
|
4 | SGH |
SMART Global Holdings, Inc.
Ordinary Shares |
M - Exercise | X | 7 500 | 117 819 | 6,80 | 11,55 | 86 625 | 1 360 809 |
| 2018-02-23 |
|
4 | SGH |
SMART Global Holdings, Inc.
Employee Stock Options (right to buy) |
M - Exercise | -7 500 | 60 753 | -10,99 | ||||
| 2018-02-23 |
|
4 | SGH |
SMART Global Holdings, Inc.
Ordinary Shares |
S - Sale | X | -7 500 | 110 319 | -6,37 | 33,40 | -250 500 | 3 684 655 |
| 2018-02-23 |
|
4 | SGH |
SMART Global Holdings, Inc.
Ordinary Shares |
M - Exercise | 7 500 | 117 819 | 6,80 | 11,55 | 86 625 | 1 360 809 | |
| 2018-02-01 |
|
4 | SGH |
SMART Global Holdings, Inc.
Ordinary Shares |
S - Sale | X | -100 | 110 319 | -0,09 | 38,28 | -3 828 | 4 223 011 |
| 2018-02-01 |
|
4 | SGH |
SMART Global Holdings, Inc.
Ordinary Shares |
S - Sale | X | -4 907 | 110 419 | -4,25 | 36,31 | -178 173 | 4 009 314 |
| 2018-02-01 |
|
4 | SGH |
SMART Global Holdings, Inc.
Ordinary Shares |
S - Sale | X | -13 417 | 115 326 | -10,42 | 35,70 | -478 987 | 4 117 138 |
| 2018-01-24 |
|
4 | SGH |
SMART Global Holdings, Inc.
Employee Stock Options (right to buy) |
M - Exercise | -7 500 | 68 253 | -9,90 | ||||
| 2018-01-24 |
|
4 | SGH |
SMART Global Holdings, Inc.
Ordinary Shares |
S - Sale | X | -7 500 | 128 743 | -5,50 | 38,64 | -289 800 | 4 974 630 |
| 2018-01-24 |
|
4 | SGH |
SMART Global Holdings, Inc.
Ordinary Shares |
M - Exercise | 7 500 | 136 243 | 5,83 | 11,55 | 86 625 | 1 573 607 | |
| 2017-12-21 |
|
4 | SGH |
SMART Global Holdings, Inc.
Employee Stock Options (right to buy) |
M - Exercise | -7 500 | 75 753 | -9,01 | ||||
| 2017-12-21 |
|
4 | SGH |
SMART Global Holdings, Inc.
Ordinary Shares |
S - Sale | X | -1 500 | 128 743 | -1,15 | 31,57 | -47 355 | 4 064 417 |
| 2017-12-21 |
|
4 | SGH |
SMART Global Holdings, Inc.
Ordinary Shares |
S - Sale | X | -6 000 | 130 243 | -4,40 | 30,93 | -185 580 | 4 028 416 |
| 2017-12-21 |
|
4 | SGH |
SMART Global Holdings, Inc.
Ordinary Shares |
M - Exercise | 7 500 | 136 243 | 5,83 | 11,55 | 86 625 | 1 573 607 | |
| 2017-12-21 |
|
4 | SGH |
SMART Global Holdings, Inc.
Ordinary Shares |
A - Award | 24 000 | 128 743 | 22,91 | ||||
| 2017-11-22 |
|
4 | SGH |
SMART Global Holdings, Inc.
Employee Stock Options (right to buy) |
M - Exercise | -7 500 | 83 253 | -8,26 | ||||
| 2017-11-22 |
|
4 | SGH |
SMART Global Holdings, Inc.
Ordinary Shares |
S - Sale | X | -300 | 104 743 | -0,29 | 36,69 | -11 007 | 3 843 021 |
| 2017-11-22 |
|
4 | SGH |
SMART Global Holdings, Inc.
Ordinary Shares |
S - Sale | X | -2 800 | 105 043 | -2,60 | 36,11 | -101 108 | 3 793 103 |
| 2017-11-22 |
|
4 | SGH |
SMART Global Holdings, Inc.
Ordinary Shares |
S - Sale | X | -3 700 | 107 843 | -3,32 | 35,19 | -130 203 | 3 794 995 |
| 2017-11-22 |
|
4 | SGH |
SMART Global Holdings, Inc.
Ordinary Shares |
S - Sale | X | -700 | 111 543 | -0,62 | 34,03 | -23 821 | 3 795 808 |
| 2017-11-22 |
|
4 | SGH |
SMART Global Holdings, Inc.
Ordinary Shares |
M - Exercise | 7 500 | 112 243 | 7,16 | 11,55 | 86 625 | 1 296 407 | |
| 2017-08-11 |
|
4 | SGH |
SMART Global Holdings, Inc.
Common Stock |
F - Taxes | -6 923 | 104 743 | -6,20 | 18,40 | -127 383 | 1 927 271 | |
| 2017-05-23 | 3 | SGH |
SMART Global Holdings, Inc.
Ordinary Shares |
223 332 | ||||||||
| 2017-05-23 | 3 | SGH |
SMART Global Holdings, Inc.
Ordinary Shares |
223 332 |
P
Otwarty rynek lub prywatny zakup niepochodnych lub pochodnych papierów wartościowych
S
Otwarty rynek lub prywatna sprzedaż niepochodnych lub pochodnych papierów wartościowych
A
Grant, nagroda lub inne nabycie papierów wartościowych od spółki (np. opcja)
C
Konwersja instrumentu pochodnego
D
Sprzedaż lub przeniesienie papierów wartościowych z powrotem do spółki
F
Zapłata ceny wykonania lub zobowiązania podatkowego z wykorzystaniem części papierów wartościowych otrzymanych od spółki
G
Darowizna papierów wartościowych przez lub na rzecz insidera
K
Swapy kapitałowe i podobne transakcje zabezpieczające
M
Wykonanie lub konwersja pochodnego papieru wartościowego otrzymanego od spółki (takiego jak opcja)
V
Transakcja dobrowolnie zgłoszona na Formularzu 4
J
Inne (wraz z przypisem opisującym transakcję)