Research Solutions, Inc.
Wstęp
Ta strona zawiera kompleksową analizę znanej historii wykorzystywania informacji poufnych w firmie Peter Derycz. Insiderzy to członkowie kadry kierowniczej, dyrektorzy lub znaczący inwestorzy w spółce. Dokonywanie transakcji w ich firmach w oparciu o określone, niepubliczne informacje jest nielegalne. Nie oznacza to, że dokonywanie jakichkolwiek transakcji we własnych firmach jest nielegalne. Muszą jednak zgłaszać wszystkie transakcje do SEC za pośrednictwem formularza 4. Pomimo tych ograniczeń badania akademickie sugerują, że insiderzy – ogólnie rzecz biorąc – mają tendencję do osiągania lepszych wyników na rynku w swoich własnych firmach.
Średnia rentowność handlu
Średnia rentowność handlu to średni zwrot ze wszystkich zakupów na otwartym rynku dokonanych przez osobę mającą dostęp do informacji poufnych w ciągu ostatnich trzech lat. Aby to obliczyć, badamy każdy nieplanowany zakup na otwartym rynku dokonany przez insidera, z wyłączeniem wszystkich transakcji oznaczonych jako część planu handlowego 10b5-1. Następnie obliczamy średnią wydajność tych transakcji w ciągu 3, 6 i 12 miesięcy, uśredniając każdy z tych okresów, aby wygenerować ostateczny wskaźnik wydajności dla każdej transakcji. Na koniec uśredniamy wszystkie wskaźniki wydajności, aby obliczyć wskaźnik wydajności dla insidera. Na tej liście znajdują się wyłącznie insiderzy, którzy dokonali co najmniej trzech transakcji w ciągu ostatnich dwóch lat.
Jeśli rentowność handlu insiderów jest oznaczona notką„nie dotyczy”, oznacza to, że insider albo nie dokonał żadnych zakupów na otwartym rynku w ciągu ostatnich trzech lat, albo transakcje, których dokonał, są zbyt nowe, aby obliczyć wiarygodny wskaźnik wydajności.
Częstotliwość aktualizacji: codziennie
Spółki posiadające zgłoszone stanowiska osób mających dostęp do poufnych informacji
Z dokumentów SEC wynika, że Peter Derycz zgłosił udziały lub transakcje w następujących spółkach:
| Papier wartościowy | Nazwa | Najnowsze raporty dotyczące udziałów |
|---|---|---|
| US:RSSS / Research Solutions, Inc. | 10% Owner | 2 955 587 |
| US:ISIG / Insignia Systems, Inc. | Director | 5 576 |
Jak interpretować wykresy
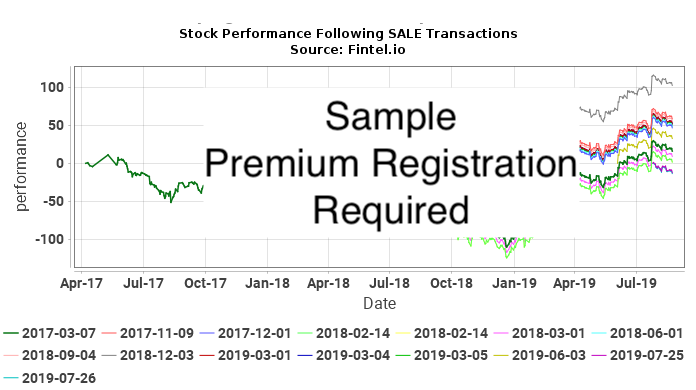
Poniższe wykresy przedstawiają notowania akcji papierów wartościowych po każdej niezaplanowanej transakcji na otwartym rynku dokonanej przez Peter Derycz. Nieplanowane transakcje to transakcje, które nie zostały dokonane w ramach planu handlowego 10b5-1. Notowania akcji przedstawiono na wykresie jako skumulowaną procentową zmianę ceny akcji. Na przykład, jeśli 1 stycznia 2019 r. dokonano transakcji poufnej, wykres pokaże dzienną procentową zmianę papieru wartościowego do dnia dzisiejszego. Jeżeli cena akcji wzrosłaby w tym czasie z 10 do 15 dolarów, skumulowana procentowa zmiana ceny akcji wyniosłaby 50%. Zmiana ceny z 10$ na 20$ będzie wynosić 100%, a zmiana ceny z 10$ na 5$ będzie wynosić -50%.
Ostatecznie staramy się określić, jak blisko transakcje insiderów korelują z nadmiernymi zwrotami (dodatnimi lub ujemnymi) z ceny akcji, aby sprawdzić, czy insider dostosowuje swoje transakcje w taki sposób, aby czerpać korzyści z informacji poufnych. Rozważmy sytuację, w której zrobił to ktoś z wewnątrz. W tej sytuacji oczekiwalibyśmy albo (a) dodatnich zwrotów po zakupach, albo (b) ujemnych zwrotów po sprzedaży. W przypadku (a) wykres ZAKUPU pokazywałby serię krzywych nachylonych w górę, wskazujących dodatnie zwroty po każdej transakcji zakupu. W przypadku (b) wykres SPRZEDAŻ pokazywałby serię krzywych o nachyleniu w dół, wskazujących ujemne zwroty po każdej transakcji sprzedaży.
Samo to jednak nie wystarczy, aby wyciągnąć wnioski. Gdyby np. cena akcji spółki przez wiele lat rosła niecyklicznie, to spodziewalibyśmy się, że wszystkie wykresy po zakupie będą wykazywały tendencję wzrostową. Podobnie niecykliczne spadki na przestrzeni wielu lat spowodowałyby spadek linii na wykresie po transakcjach. Żaden z tych wykresów nie sugeruje wykorzystywania informacji poufnych.
Najsilniejszym wskaźnikiem byłaby sytuacja, gdy cena akcji miała charakter wyjątkowo cykliczny, a na wykresie KUPNO występowały zarówno pozytywne sygnały na wykresie KUPNA, jak i negatywne na wykresie SPRZEDAŻY. Sytuacja ta wysoce sugerowałaby osobę mającą dostęp do informacji poufnych, która wykorzystywała transakcje w celu uzyskania korzyści finansowej.
Zakupy insidera RSSS / Research Solutions, Inc. – krótkoterminowa analiza zysków
W tej części analizujemy rentowność każdego nieplanowanego zakupu od poufnych informacji na otwartym rynku dokonanego w RSSS / Research Solutions, Inc.. Analiza ta pomaga zrozumieć, czy insider konsekwentnie generuje nietypowe zyski i czy warto ją śledzić. Analiza ta obejmuje okres jednego roku po każdej transakcji, a wyniki mają charakter teoretyczny .
Poniższa tabela przedstawia najnowsze zakupy na otwartym rynku, które nie były częścią planu handlu automatycznego.
Cena skorygowana to cena skorygowana o podział. Akcje skorygowane to akcje skorygowane o podział.
Sprzedaż insidera RSSS / Research Solutions, Inc. — analiza strat krótkoterminowych
W tej sekcji analizujemy możliwość uniknięcia krótkoterminowych strat w wyniku każdej nieplanowanej sprzedaży poufnych informacji na otwartym rynku dokonanej w RSSS / Research Solutions, Inc.. Konsekwentny wzorzec unikania strat może sugerować, że przyszłe transakcje sprzedaży mogą przewidywać spadki cen. Analiza ta obejmuje okres jednego roku po każdej transakcji, a wyniki mają charakter teoretyczny .
Poniższa tabela przedstawia najnowsze sprzedaże na otwartym rynku, które nie były częścią planu handlu automatycznego.
Cena skorygowana to cena skorygowana o podział. Akcje skorygowane to akcje skorygowane o podział.
Zakupy insidera TULP / Bloomia Holdings, Inc. – krótkoterminowa analiza zysków
W tej części analizujemy rentowność każdego nieplanowanego zakupu od poufnych informacji na otwartym rynku dokonanego w RSSS / Research Solutions, Inc.. Analiza ta pomaga zrozumieć, czy insider konsekwentnie generuje nietypowe zyski i czy warto ją śledzić. Analiza ta obejmuje okres jednego roku po każdej transakcji, a wyniki mają charakter teoretyczny .
Poniższa tabela przedstawia najnowsze zakupy na otwartym rynku, które nie były częścią planu handlu automatycznego.
| Data transakcji | Ticker | Insider | Zgłoszone Akcje |
Zgłoszona Cena |
Skorygowane Akcje |
Skorygowana Cena |
Podstawa kalkulacji kosztów | Dni do maks |
Cena maks |
Maks Zysk ($) |
Maksymalny zwrot (%) |
|---|---|---|---|---|---|---|---|
| Nie znane są żadne nieplanowane transakcje na otwarttm rynku dla tej kombinacji insidera i papieru wartościowego |
Cena skorygowana to cena skorygowana o podział. Akcje skorygowane to akcje skorygowane o podział.
Sprzedaż insidera TULP / Bloomia Holdings, Inc. — analiza strat krótkoterminowych
W tej sekcji analizujemy możliwość uniknięcia krótkoterminowych strat w wyniku każdej nieplanowanej sprzedaży poufnych informacji na otwartym rynku dokonanej w RSSS / Research Solutions, Inc.. Konsekwentny wzorzec unikania strat może sugerować, że przyszłe transakcje sprzedaży mogą przewidywać spadki cen. Analiza ta obejmuje okres jednego roku po każdej transakcji, a wyniki mają charakter teoretyczny .
Poniższa tabela przedstawia najnowsze sprzedaże na otwartym rynku, które nie były częścią planu handlu automatycznego.
| Data transakcji | Ticker | Insider | Zgłoszone Akcje |
Zgłoszona Cena |
Skorygowane Akcje |
Skorygowana Cena |
Podstawa kalkulacji kosztów | Dni do min |
Cena min |
Uniknięta maksymalna strata ($) |
Uniknięta Maksymalna strata (%) |
|---|---|---|---|---|---|---|---|
| Nie znane są żadne nieplanowane transakcje na otwarttm rynku dla tej kombinacji insidera i papieru wartościowego |
Cena skorygowana to cena skorygowana o podział. Akcje skorygowane to akcje skorygowane o podział.
Historia handlu insiderów
Ta tabela przedstawia pełną listę transakcji insiderów dokonanych przez firmę Peter Derycz ujawnioną Komisji Papierów Wartościowych (SEC).
| Data pliku | Data trans | Formularz | Ticker | Bezpieczeństwo | Kod | Akcje | Pozostałe akcje | Zmiana procent |
Cena udziału |
Wartość trans |
Pozostała Wartość |
|
|---|---|---|---|---|---|---|---|---|---|---|---|---|
| 2024-03-25 |
|
4 | RSSS |
Research Solutions, Inc.
Common Stock |
S - Sale | -2 576 | 2 955 587 | -0,09 | 2,85 | -7 342 | 8 423 423 | |
| 2024-03-25 |
|
4 | RSSS |
Research Solutions, Inc.
Common Stock |
S - Sale | -26 517 | 2 958 163 | -0,89 | 2,86 | -75 839 | 8 460 346 | |
| 2024-03-25 |
|
4 | RSSS |
Research Solutions, Inc.
Common Stock |
S - Sale | -40 402 | 2 984 680 | -1,34 | 2,87 | -115 954 | 8 566 032 | |
| 2024-01-24 |
|
4 | RSSS |
Research Solutions, Inc.
Common Stock |
S - Sale | -61 | 3 025 082 | 0,00 | 2,70 | -165 | 8 167 721 | |
| 2024-01-24 |
|
4 | RSSS |
Research Solutions, Inc.
Common Stock |
S - Sale | -11 503 | 3 025 143 | -0,38 | 2,71 | -31 173 | 8 198 138 | |
| 2024-01-24 |
|
4 | RSSS |
Research Solutions, Inc.
Common Stock |
S - Sale | -30 262 | 3 036 646 | -0,99 | 2,63 | -79 589 | 7 986 379 | |
| 2024-01-22 |
|
4 | RSSS |
Research Solutions, Inc.
Common Stock |
S - Sale | -1 266 | 3 066 908 | -0,04 | 2,60 | -3 292 | 7 973 961 | |
| 2024-01-22 |
|
4 | RSSS |
Research Solutions, Inc.
Common Stock |
S - Sale | -20 113 | 3 068 174 | -0,65 | 2,60 | -52 294 | 7 977 252 | |
| 2024-01-22 |
|
4 | RSSS |
Research Solutions, Inc.
Common Stock |
S - Sale | -10 | 3 088 287 | 0,00 | 2,60 | -26 | 8 029 546 | |
| 2024-01-16 |
|
4 | RSSS |
Research Solutions, Inc.
Common Stock |
S - Sale | -22 | 3 088 297 | 0,00 | 2,60 | -57 | 8 029 572 | |
| 2024-01-16 |
|
4 | RSSS |
Research Solutions, Inc.
Common Stock |
S - Sale | -636 | 3 088 319 | -0,02 | 2,60 | -1 654 | 8 029 629 | |
| 2024-01-16 |
|
4 | RSSS |
Research Solutions, Inc.
Common Stock |
S - Sale | -3 497 | 3 088 955 | -0,11 | 2,60 | -9 092 | 8 031 283 | |
| 2024-01-16 |
|
4 | RSSS |
Research Solutions, Inc.
Common Stock |
S - Sale | -8 756 | 3 092 452 | -0,28 | 2,60 | -22 766 | 8 040 375 | |
| 2024-01-09 |
|
4 | RSSS |
Research Solutions, Inc.
Common Stock |
S - Sale | -69 676 | 3 101 208 | -2,20 | 2,70 | -188 125 | 8 373 262 | |
| 2024-01-09 |
|
4 | RSSS |
Research Solutions, Inc.
Common Stock |
S - Sale | -15 000 | 3 170 884 | -0,47 | 2,71 | -40 650 | 8 593 096 | |
| 2024-01-09 |
|
4 | RSSS |
Research Solutions, Inc.
Common Stock |
S - Sale | -9 524 | 3 185 884 | -0,30 | 2,63 | -25 048 | 8 378 875 | |
| 2024-01-04 |
|
4 | RSSS |
Research Solutions, Inc.
Common Stock |
S - Sale | -476 | 3 195 408 | -0,01 | 2,60 | -1 238 | 8 308 061 | |
| 2024-01-04 |
|
4 | RSSS |
Research Solutions, Inc.
Common Stock |
S - Sale | -7 367 | 3 195 884 | -0,23 | 2,62 | -19 302 | 8 373 216 | |
| 2024-01-04 |
|
4 | RSSS |
Research Solutions, Inc.
Common Stock |
S - Sale | -1 353 | 3 203 251 | -0,04 | 2,60 | -3 518 | 8 328 453 | |
| 2024-01-04 |
|
4 | RSSS |
Research Solutions, Inc.
Common Stock |
S - Sale | -2 153 | 3 204 604 | -0,07 | 2,61 | -5 619 | 8 364 016 | |
| 2023-12-28 |
|
4 | RSSS |
Research Solutions, Inc.
Common Stock |
S - Sale | -383 | 3 206 757 | -0,01 | 2,60 | -996 | 8 337 568 | |
| 2023-12-28 |
|
4 | RSSS |
Research Solutions, Inc.
Common Stock |
S - Sale | -17 111 | 3 207 140 | -0,53 | 2,64 | -45 173 | 8 466 850 | |
| 2023-12-28 |
|
4 | RSSS |
Research Solutions, Inc.
Common Stock |
S - Sale | -9 711 | 3 224 251 | -0,30 | 2,61 | -25 346 | 8 415 295 | |
| 2023-12-22 |
|
4 | RSSS |
Research Solutions, Inc.
Common Stock |
S - Sale | -7 590 | 3 233 962 | -0,23 | 2,63 | -19 962 | 8 505 320 | |
| 2023-12-22 |
|
4 | RSSS |
Research Solutions, Inc.
Common Stock |
S - Sale | -20 224 | 3 241 552 | -0,62 | 2,65 | -53 594 | 8 590 113 | |
| 2023-12-22 |
|
4 | RSSS |
Research Solutions, Inc.
Common Stock |
S - Sale | -27 653 | 3 261 776 | -0,84 | 2,65 | -73 280 | 8 643 706 | |
| 2023-12-22 |
|
4 | RSSS |
Research Solutions, Inc.
Common Stock |
S - Sale | -13 893 | 3 289 429 | -0,42 | 2,68 | -37 233 | 8 815 670 | |
| 2023-11-14 |
|
4 | RSSS |
Research Solutions, Inc.
Common Stock |
S - Sale | -18 000 | 3 303 322 | -0,54 | 2,34 | -42 120 | 7 729 773 | |
| 2023-08-25 |
|
5 | RSSS |
Research Solutions, Inc.
Common Stock |
G - Gift | -8 500 | 3 321 322 | -0,26 | ||||
| 2023-06-22 |
|
4 | RSSS |
Research Solutions, Inc.
Common Stock |
F - Taxes | -2 959 | 3 329 822 | -0,09 | 2,24 | -6 628 | 7 458 801 | |
| 2023-03-21 |
|
4 | RSSS |
Research Solutions, Inc.
Common Stock |
F - Taxes | -3 609 | 3 332 781 | -0,11 | 2,02 | -7 290 | 6 732 218 | |
| 2023-02-13 |
|
4 | RSSS |
Research Solutions, Inc.
Common Stock |
F - Taxes | -17 468 | 3 336 390 | -0,52 | 2,29 | -40 002 | 7 640 333 | |
| 2023-02-13 |
|
4 | RSSS |
Research Solutions, Inc.
Common Stock |
M - Exercise | 32 000 | 3 353 858 | 0,96 | 1,25 | 40 000 | 4 192 322 | |
| 2023-01-11 |
|
4 | RSSS |
Research Solutions, Inc.
Common Stock |
G - Gift | -34 000 | 3 321 858 | -1,01 | ||||
| 2023-01-05 |
|
4 | RSSS |
Research Solutions, Inc.
Common Stock |
G - Gift | -7 500 | 3 355 858 | -0,22 | ||||
| 2022-12-22 |
|
4 | RSSS |
Research Solutions, Inc.
Common Stock |
F - Taxes | -3 261 | 3 363 358 | -0,10 | 1,90 | -6 196 | 6 390 380 | |
| 2022-09-22 |
|
4 | RSSS |
Research Solutions, Inc.
Common Stock |
F - Taxes | -4 730 | 3 366 619 | -0,14 | 1,87 | -8 845 | 6 295 578 | |
| 2022-08-22 |
|
4 | RSSS |
Research Solutions, Inc.
Common Stock |
A - Award | 34 639 | 3 371 349 | 1,04 | ||||
| 2022-06-22 |
|
4 | RSSS |
Research Solutions, Inc.
Common Stock |
F - Taxes | -3 400 | 3 336 710 | -0,10 | 1,74 | -5 916 | 5 805 875 | |
| 2022-05-11 |
|
4 | RSSS |
Research Solutions, Inc.
Common Stock |
A - Award | 8 289 | 3 340 110 | 0,25 | ||||
| 2022-05-11 |
|
4 | RSSS |
Research Solutions, Inc.
Common Stock |
G - Gift | -24 000 | 3 331 821 | -0,72 | ||||
| 2022-05-11 |
|
4 | RSSS |
Research Solutions, Inc.
Common Stock |
G - Gift | -21 000 | 3 355 821 | -0,62 | ||||
| 2022-03-21 |
|
4 | RSSS |
Research Solutions, Inc.
Common Stock |
F - Taxes | -3 044 | 3 376 821 | -0,09 | 2,34 | -7 123 | 7 901 761 | |
| 2022-02-10 |
|
4 | RSSS |
Research Solutions, Inc.
Common Stock |
A - Award | 7 381 | 3 379 865 | 0,22 | ||||
| 2021-12-22 |
|
4 | RSSS |
Research Solutions, Inc.
Common Stock |
F - Taxes | -2 956 | 3 372 484 | -0,09 | 2,24 | -6 621 | 7 554 364 | |
| 2021-12-06 |
|
4 | RSSS |
Research Solutions, Inc.
Common Stock |
A - Award | 7 078 | 3 375 440 | 0,21 | ||||
| 2021-09-21 |
|
4 | RSSS |
Research Solutions, Inc.
Common Stock |
F - Taxes | -5 635 | 3 368 362 | -0,17 | 2,55 | -14 369 | 8 589 323 | |
| 2021-08-11 |
|
4 | RSSS |
Research Solutions, Inc.
Common Stock |
A - Award | 30 061 | 3 373 997 | 0,90 | ||||
| 2021-07-21 |
|
4 | RSSS |
Research Solutions, Inc.
Common Stock |
S - Sale | X | -41 798 | 3 343 936 | -1,23 | 2,92 | -122 050 | 9 764 293 |
| 2021-07-16 |
|
4 | RSSS |
Research Solutions, Inc.
Common Stock |
S - Sale | X | -14 612 | 3 385 734 | -0,43 | 2,97 | -43 398 | 10 055 630 |
| 2021-07-16 |
|
4 | RSSS |
Research Solutions, Inc.
Common Stock |
S - Sale | X | -23 933 | 3 400 346 | -0,70 | 2,96 | -70 842 | 10 065 024 |
| 2021-07-16 |
|
4 | RSSS |
Research Solutions, Inc.
Common Stock |
S - Sale | X | -28 520 | 3 424 279 | -0,83 | 2,98 | -84 990 | 10 204 351 |
| 2021-07-13 |
|
4 | RSSS |
Research Solutions, Inc.
Common Stock |
S - Sale | X | -25 312 | 3 452 799 | -0,73 | 3,01 | -76 189 | 10 392 925 |
| 2021-07-13 |
|
4 | RSSS |
Research Solutions, Inc.
Common Stock |
S - Sale | X | -9 005 | 3 478 111 | -0,26 | 3,03 | -27 285 | 10 538 676 |
| 2021-07-13 |
|
4 | RSSS |
Research Solutions, Inc.
Common Stock |
S - Sale | X | -5 531 | 3 487 116 | -0,16 | 3,06 | -16 925 | 10 670 575 |
| 2021-07-08 |
|
4 | RSSS |
Research Solutions, Inc.
Common Stock |
S - Sale | X | -13 273 | 3 492 647 | -0,38 | 3,02 | -40 084 | 10 547 794 |
| 2021-07-08 |
|
4 | RSSS |
Research Solutions, Inc.
Common Stock |
S - Sale | X | -56 035 | 3 505 920 | -1,57 | 3,01 | -168 665 | 10 552 819 |
| 2021-07-08 |
|
4 | RSSS |
Research Solutions, Inc.
Common Stock |
S - Sale | X | -156 981 | 3 561 955 | -4,22 | 3,00 | -470 943 | 10 685 865 |
| 2021-06-21 |
|
4 | RSSS |
Research Solutions, Inc.
Common Stock |
F - Taxes | -3 400 | 3 718 936 | -0,09 | 2,50 | -8 500 | 9 297 340 | |
| 2021-06-21 |
|
4 | RSSS |
Research Solutions, Inc.
Common Stock Warrants (right to buy) |
M - Exercise | -6 000 | 0 | -100,00 | 1,00 | -6 000 | ||
| 2021-06-21 |
|
4 | RSSS |
Research Solutions, Inc.
Common Stock |
M - Exercise | 6 000 | 3 722 336 | 0,16 | 1,25 | 7 500 | 4 652 920 | |
| 2021-05-13 |
|
4 | RSSS |
Research Solutions, Inc.
Common Stock |
A - Award | 10 000 | 3 716 336 | 0,27 | ||||
| 2021-05-13 |
|
4 | RSSS |
Research Solutions, Inc.
Common Stock |
G - Gift | -18 000 | 3 706 336 | -0,48 | ||||
| 2021-03-22 |
|
4 | RSSS |
Research Solutions, Inc.
Common Stock |
F - Taxes | -4 250 | 3 724 336 | -0,11 | 2,15 | -9 138 | 8 007 322 | |
| 2021-02-12 |
|
4 | RSSS |
Research Solutions, Inc.
Common Stock |
A - Award | 6 225 | 3 728 586 | 0,17 | ||||
| 2020-12-22 |
|
4 | RSSS |
Research Solutions, Inc.
Common Stock |
F - Taxes | -4 000 | 3 722 361 | -0,11 | 2,21 | -8 840 | 8 226 418 | |
| 2020-11-18 |
|
4 | RSSS |
Research Solutions, Inc.
Common Stock |
A - Award | 7 277 | 3 726 361 | 0,20 | ||||
| 2020-09-22 |
|
4 | RSSS |
Research Solutions, Inc.
Common Stock |
F - Taxes | -7 500 | 3 719 084 | -0,20 | 2,29 | -17 175 | 8 516 702 | |
| 2020-08-03 |
|
4 | RSSS |
Research Solutions, Inc.
Common Stock |
A - Award | 37 200 | 3 726 584 | 1,01 | ||||
| 2020-06-23 |
|
4 | RSSS |
Research Solutions, Inc.
Common Stock |
F - Taxes | -5 700 | 3 689 384 | -0,15 | 2,68 | -15 276 | 9 887 549 | |
| 2020-05-13 |
|
4 | RSSS |
Research Solutions, Inc.
Common Stock |
A - Award | 4 445 | 3 695 084 | 0,12 | ||||
| 2020-03-24 |
|
4 | RSSS |
Research Solutions, Inc.
Common Stock |
F - Taxes | -8 750 | 3 690 639 | -0,24 | 2,75 | -24 062 | 10 149 257 | |
| 2020-02-14 |
|
4 | RSSS |
Research Solutions, Inc.
Common Stock |
A - Award | 3 875 | 3 699 389 | 0,10 | ||||
| 2019-12-26 |
|
4 | RSSS |
Research Solutions, Inc.
Common Stock |
D - Sale to Issuer | -10 000 | 3 695 514 | -0,27 | 3,00 | -30 000 | 11 086 542 | |
| 2019-11-14 |
|
4 | RSSS |
Research Solutions, Inc.
Common Stock |
A - Award | 4 333 | 3 705 514 | 0,12 | ||||
| 2019-09-24 |
|
4 | RSSS |
Research Solutions, Inc.
Common Stock |
D - Sale to Issuer | -10 400 | 3 701 181 | -0,28 | 2,50 | -26 000 | 9 252 952 | |
| 2019-08-05 |
|
4 | RSSS |
Research Solutions, Inc.
Common Stock |
A - Award | 21 700 | 3 711 581 | 0,59 | ||||
| 2019-06-24 |
|
4 | RSSS |
Research Solutions, Inc.
Common Stock |
D - Sale to Issuer | -5 450 | 3 689 881 | -0,15 | 2,30 | -12 535 | 8 486 726 | |
| 2019-05-20 |
|
4 | RSSS |
Research Solutions, Inc.
Common Stock |
A - Award | 2 444 | 3 695 331 | 0,07 | ||||
| 2019-03-22 |
|
4 | RSSS |
Research Solutions, Inc.
Common Stock |
D - Sale to Issuer | -7 500 | 3 692 887 | -0,20 | 2,24 | -16 800 | 8 272 067 | |
| 2019-02-08 |
|
4 | RSSS |
Research Solutions, Inc.
Common Stock |
A - Award | 3 766 | 3 700 387 | 0,10 | ||||
| 2018-12-21 |
|
4 | RSSS |
Research Solutions, Inc.
Common Stock |
D - Sale to Issuer | -5 500 | 3 696 621 | -0,15 | 2,41 | -13 255 | 8 908 857 | |
| 2018-11-15 |
|
4 | RSSS |
Research Solutions, Inc.
Common Stock |
A - Award | 4 677 | 3 702 121 | 0,13 | ||||
| 2018-09-25 |
|
4 | RSSS |
Research Solutions, Inc.
Common Stock |
D - Sale to Issuer | -10 700 | 3 697 444 | -0,29 | 2,20 | -23 540 | 8 134 377 | |
| 2018-08-13 |
|
4 | RSSS |
Research Solutions, Inc.
Common Stock |
A - Award | 40 340 | 3 708 144 | 1,10 | ||||
| 2018-06-22 |
|
4 | RSSS |
Research Solutions, Inc.
Common Stock |
D - Sale to Issuer | -5 550 | 3 667 804 | -0,15 | 1,73 | -9 602 | 6 345 301 | |
| 2018-05-11 |
|
4 | RSSS |
Research Solutions, Inc.
Common Stock |
A - Award | 11 315 | 3 673 354 | 0,31 | ||||
| 2018-03-22 |
|
4 | RSSS |
Research Solutions, Inc.
Common Stock |
D - Sale to Issuer | -7 750 | 3 662 039 | -0,21 | 1,29 | -9 998 | 4 724 030 | |
| 2018-02-12 |
|
4 | RSSS |
Research Solutions, Inc.
Common Stock |
A - Award | 12 185 | 3 669 789 | 0,33 | ||||
| 2018-01-02 |
|
4 | RSSS |
Research Solutions, Inc.
Common Stock |
G - Gift | -46 000 | 3 657 604 | -1,24 | ||||
| 2017-12-22 |
|
4 | RSSS |
Research Solutions, Inc.
Common Stock |
D - Sale to Issuer | -7 000 | 3 703 604 | -0,19 | 1,21 | -8 470 | 4 481 361 | |
| 2017-12-01 |
|
4 | RSSS |
Research Solutions, Inc.
Common Stock |
A - Award | 10 975 | 3 710 604 | 0,30 | ||||
| 2017-09-21 |
|
4 | RSSS |
Research Solutions, Inc.
Common Stock |
D - Sale to Issuer | -8 800 | 3 699 629 | -0,24 | 1,14 | -10 032 | 4 217 577 | |
| 2017-08-23 |
|
4 | RSSS |
Research Solutions, Inc.
Common Stock |
A - Award | 62 487 | 3 708 429 | 1,71 | ||||
| 2017-06-22 |
|
4 | RSSS |
Research Solutions, Inc.
Common Stock |
D - Sale to Issuer | -24 500 | 3 645 942 | -0,67 | 1,00 | -24 500 | 3 645 942 | |
| 2017-05-15 |
|
4 | RSSS |
Research Solutions, Inc.
Common Stock |
A - Award | 13 947 | 3 670 442 | 0,38 | ||||
| 2017-02-17 |
|
4 | RSSS |
Research Solutions, Inc.
Common Stock |
A - Award | 11 305 | 3 656 495 | 0,31 | ||||
| 2016-12-22 |
|
4 | RSSS |
Research Solutions, Inc.
Common Stock |
D - Sale to Issuer | -14 700 | 3 645 190 | -0,40 | 1,03 | -15 141 | 3 754 546 | |
| 2016-11-23 |
|
4 | RSSS |
Research Solutions, Inc.
Common Stock |
A - Award | 6 666 | 3 659 890 | 0,18 | ||||
| 2016-08-25 |
|
4 | RSSS |
Research Solutions, Inc.
Common Stock |
A - Award | 21 818 | 3 653 224 | 0,60 | ||||
| 2016-06-27 |
|
4 | RSSS |
Research Solutions, Inc.
Common Stock Warrants (right to buy) |
P - Purchase | 6 000 | 6 000 | 1,00 | 6 000 | 6 000 | ||
| 2016-06-27 |
|
4 | RSSS |
Research Solutions, Inc.
Common Stock |
P - Purchase | 20 000 | 3 631 406 | 0,55 | 1,00 | 20 000 | 3 631 406 | |
| 2016-05-25 |
|
4 | RSSS |
Research Solutions, Inc.
Common Stock |
A - Award | 9 333 | 3 611 406 | 0,26 | ||||
| 2016-03-21 |
|
4 | RSSS |
Research Solutions, Inc.
Common Stock |
G - Gift | -80 000 | 3 602 073 | -2,17 | ||||
| 2016-02-26 |
|
4 | RSSS |
Research Solutions, Inc.
Common Stock |
A - Award | 28 755 | 3 682 073 | 0,79 | ||||
| 2016-02-08 |
|
4 | RSSS |
Research Solutions, Inc.
Common Stock |
A - Award | 17 143 | 3 653 318 | 0,47 | ||||
| 2015-08-06 |
|
4 | RSSS |
Research Solutions, Inc.
Common Stock |
A - Award | 32 000 | 3 636 175 | 0,89 | ||||
| 2015-08-06 |
|
5 | RSSS |
Research Solutions, Inc.
Common Stock |
G - Gift | -80 000 | 3 604 175 | -2,17 | ||||
| 2015-08-06 |
|
5 | RSSS |
Research Solutions, Inc.
Common Stock |
P - Purchase | 2 000 | 3 684 175 | 0,05 | 0,75 | 1 500 | 2 763 131 | |
| 2015-05-27 |
|
4 | RSSS |
Research Solutions, Inc.
Common Stock |
A - Award | 24 835 | 3 682 175 | 0,68 | ||||
| 2015-03-12 |
|
4 | RSSS |
Research Solutions, Inc.
Common Stock |
A - Award | 33 333 | 3 657 340 | 0,92 | ||||
| 2014-12-04 |
|
4 | RSSS |
Research Solutions, Inc.
Common Stock |
P - Purchase | 2 000 | 3 624 007 | 0,06 | 0,89 | 1 780 | 3 225 366 | |
| 2014-11-12 |
|
4 | RSSS |
Research Solutions, Inc.
Common Stock |
A - Award | 22 860 | 3 622 007 | 0,64 | ||||
| 2014-11-12 |
|
4 | RSSS |
Research Solutions, Inc.
Common Stock |
G - Gift | 25 000 | 29 905 | 509,68 | ||||
| 2014-11-12 |
|
4 | RSSS |
Research Solutions, Inc.
Common Stock |
G - Gift | 25 000 | 1 629 905 | 1,56 | ||||
| 2014-11-12 |
|
4 | RSSS |
Research Solutions, Inc.
Common Stock |
G - Gift | 25 000 | 429 905 | 6,17 | ||||
| 2014-11-12 |
|
4 | RSSS |
Research Solutions, Inc.
Common Stock |
G - Gift | 25 000 | 429 905 | 6,17 | ||||
| 2014-11-12 |
|
4 | RSSS |
Research Solutions, Inc.
Common Stock |
G - Gift | -100 000 | 3 599 147 | -2,70 | ||||
| 2014-10-14 |
|
4 | RSSS |
Research Solutions, Inc.
Common Stock |
P - Purchase | 2 000 | 3 699 147 | 0,05 | 0,75 | 1 500 | 2 774 360 | |
| 2014-10-14 |
|
4 | RSSS |
Research Solutions, Inc.
Common Stock |
P - Purchase | 1 200 | 3 697 147 | 0,03 | 0,70 | 840 | 2 587 633 | |
| 2014-10-14 |
|
4 | RSSS |
Research Solutions, Inc.
Common Stock |
P - Purchase | 800 | 3 695 947 | 0,02 | 0,70 | 560 | 2 587 163 | |
| 2014-10-10 |
|
4 | RSSS |
Research Solutions, Inc.
Common Stock |
P - Purchase | 3 000 | 3 695 147 | 0,08 | 0,73 | 2 190 | 2 697 457 | |
| 2014-10-10 |
|
4 | RSSS |
Research Solutions, Inc.
Common Stock |
P - Purchase | 1 000 | 3 692 147 | 0,03 | 0,75 | 750 | 2 769 110 | |
| 2014-10-10 |
|
4 | RSSS |
Research Solutions, Inc.
Common Stock |
P - Purchase | 3 000 | 3 691 147 | 0,08 | 0,71 | 2 130 | 2 620 714 | |
| 2014-10-07 |
|
4 | RSSS |
Research Solutions, Inc.
Common Stock |
P - Purchase | 1 000 | 3 688 147 | 0,03 | 0,70 | 699 | 2 579 121 | |
| 2014-10-07 |
|
4 | RSSS |
Research Solutions, Inc.
Common Stock |
P - Purchase | 1 000 | 3 687 147 | 0,03 | 0,75 | 749 | 2 761 304 | |
| 2014-10-07 |
|
4 | RSSS |
Research Solutions, Inc.
Common Stock |
P - Purchase | 1 000 | 3 686 147 | 0,03 | 0,75 | 750 | 2 764 610 | |
| 2014-10-07 |
|
4 | RSSS |
Research Solutions, Inc.
Common Stock |
P - Purchase | 1 000 | 3 685 147 | 0,03 | 0,75 | 750 | 2 763 860 | |
| 2014-10-07 |
|
4 | RSSS |
Research Solutions, Inc.
Common Stock |
P - Purchase | 1 000 | 3 684 147 | 0,03 | 0,71 | 710 | 2 615 744 | |
| 2014-08-20 |
|
4 | RSSS |
Research Solutions, Inc.
Common Stock |
A - Award | 57 000 | 3 683 147 | 1,57 | ||||
| 2014-05-20 |
|
4 | RSSS |
Research Solutions, Inc.
Common Stock |
A - Award | 7 843 | 3 626 147 | 0,22 | ||||
| 2014-01-28 |
|
4 | RSSS |
Research Solutions, Inc.
Common Stock |
A - Award | 2 051 | 3 618 304 | 0,06 | ||||
| 2013-12-16 |
|
4 | ISIG |
INSIGNIA SYSTEMS INC/MN
Common Stock |
A - Award | 5 576 | 5 576 | 2,69 | 14 999 | 14 999 | ||
| 2013-11-26 |
|
4 | RSSS |
Research Solutions, Inc.
Common Stock |
A - Award | 2 540 | 3 616 253 | 0,07 | ||||
| 2013-09-10 |
|
4 | RSSS |
Research Solutions, Inc.
Common Stock |
A - Award | 33 333 | 3 613 713 | 0,93 | ||||
| 2013-05-22 |
|
4 | RSSS |
Research Solutions, Inc.
Option to purchase common stock |
A - Award | 16 000 | 16 000 | |||||
| 2013-03-12 |
|
4 | RSSS |
Research Solutions, Inc.
Option to purchase common stock |
A - Award | 32 000 | 32 000 | |||||
| 2012-05-25 |
|
4 | ISIG |
INSIGNIA SYSTEMS INC/MN
Non-Qualified Stock Option |
A - Award | 5 000 | 5 000 | 1,74 | 8 700 | 8 700 |
P
Otwarty rynek lub prywatny zakup niepochodnych lub pochodnych papierów wartościowych
S
Otwarty rynek lub prywatna sprzedaż niepochodnych lub pochodnych papierów wartościowych
A
Grant, nagroda lub inne nabycie papierów wartościowych od spółki (np. opcja)
C
Konwersja instrumentu pochodnego
D
Sprzedaż lub przeniesienie papierów wartościowych z powrotem do spółki
F
Zapłata ceny wykonania lub zobowiązania podatkowego z wykorzystaniem części papierów wartościowych otrzymanych od spółki
G
Darowizna papierów wartościowych przez lub na rzecz insidera
K
Swapy kapitałowe i podobne transakcje zabezpieczające
M
Wykonanie lub konwersja pochodnego papieru wartościowego otrzymanego od spółki (takiego jak opcja)
V
Transakcja dobrowolnie zgłoszona na Formularzu 4
J
Inne (wraz z przypisem opisującym transakcję)