Cheniere Energy Partners, L.P. - Limited Partnership
Wstęp
Ta strona zawiera kompleksową analizę znanej historii wykorzystywania informacji poufnych w firmie Bia Gp L.p.. Insiderzy to członkowie kadry kierowniczej, dyrektorzy lub znaczący inwestorzy w spółce. Dokonywanie transakcji w ich firmach w oparciu o określone, niepubliczne informacje jest nielegalne. Nie oznacza to, że dokonywanie jakichkolwiek transakcji we własnych firmach jest nielegalne. Muszą jednak zgłaszać wszystkie transakcje do SEC za pośrednictwem formularza 4. Pomimo tych ograniczeń badania akademickie sugerują, że insiderzy – ogólnie rzecz biorąc – mają tendencję do osiągania lepszych wyników na rynku w swoich własnych firmach.
Średnia rentowność handlu
Średnia rentowność handlu to średni zwrot ze wszystkich zakupów na otwartym rynku dokonanych przez osobę mającą dostęp do informacji poufnych w ciągu ostatnich trzech lat. Aby to obliczyć, badamy każdy nieplanowany zakup na otwartym rynku dokonany przez insidera, z wyłączeniem wszystkich transakcji oznaczonych jako część planu handlowego 10b5-1. Następnie obliczamy średnią wydajność tych transakcji w ciągu 3, 6 i 12 miesięcy, uśredniając każdy z tych okresów, aby wygenerować ostateczny wskaźnik wydajności dla każdej transakcji. Na koniec uśredniamy wszystkie wskaźniki wydajności, aby obliczyć wskaźnik wydajności dla insidera. Na tej liście znajdują się wyłącznie insiderzy, którzy dokonali co najmniej trzech transakcji w ciągu ostatnich dwóch lat.
Jeśli rentowność handlu insiderów jest oznaczona notką„nie dotyczy”, oznacza to, że insider albo nie dokonał żadnych zakupów na otwartym rynku w ciągu ostatnich trzech lat, albo transakcje, których dokonał, są zbyt nowe, aby obliczyć wiarygodny wskaźnik wydajności.
Częstotliwość aktualizacji: codziennie
Spółki posiadające zgłoszone stanowiska osób mających dostęp do poufnych informacji
Z dokumentów SEC wynika, że Bia Gp L.p. zgłosił udziały lub transakcje w następujących spółkach:
| Papier wartościowy | Nazwa | Najnowsze raporty dotyczące udziałów |
|---|---|---|
| US:CQP / Cheniere Energy Partners, L.P. - Limited Partnership | 10% Owner | 123 848 |
| US:TGE / The Generation Essentials Group | 10% Owner | 0 |
Jak interpretować wykresy
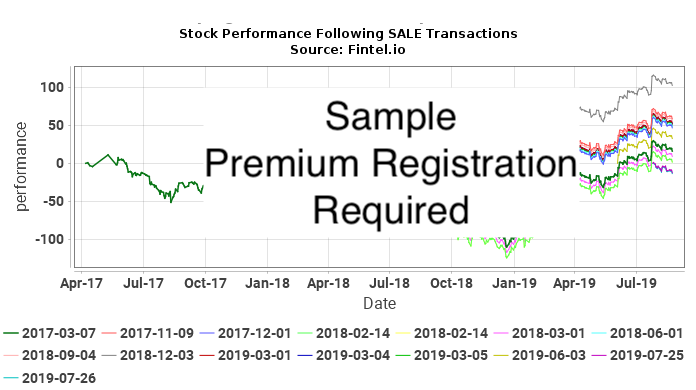
Poniższe wykresy przedstawiają notowania akcji papierów wartościowych po każdej niezaplanowanej transakcji na otwartym rynku dokonanej przez Bia Gp L.p.. Nieplanowane transakcje to transakcje, które nie zostały dokonane w ramach planu handlowego 10b5-1. Notowania akcji przedstawiono na wykresie jako skumulowaną procentową zmianę ceny akcji. Na przykład, jeśli 1 stycznia 2019 r. dokonano transakcji poufnej, wykres pokaże dzienną procentową zmianę papieru wartościowego do dnia dzisiejszego. Jeżeli cena akcji wzrosłaby w tym czasie z 10 do 15 dolarów, skumulowana procentowa zmiana ceny akcji wyniosłaby 50%. Zmiana ceny z 10$ na 20$ będzie wynosić 100%, a zmiana ceny z 10$ na 5$ będzie wynosić -50%.
Ostatecznie staramy się określić, jak blisko transakcje insiderów korelują z nadmiernymi zwrotami (dodatnimi lub ujemnymi) z ceny akcji, aby sprawdzić, czy insider dostosowuje swoje transakcje w taki sposób, aby czerpać korzyści z informacji poufnych. Rozważmy sytuację, w której zrobił to ktoś z wewnątrz. W tej sytuacji oczekiwalibyśmy albo (a) dodatnich zwrotów po zakupach, albo (b) ujemnych zwrotów po sprzedaży. W przypadku (a) wykres ZAKUPU pokazywałby serię krzywych nachylonych w górę, wskazujących dodatnie zwroty po każdej transakcji zakupu. W przypadku (b) wykres SPRZEDAŻ pokazywałby serię krzywych o nachyleniu w dół, wskazujących ujemne zwroty po każdej transakcji sprzedaży.
Samo to jednak nie wystarczy, aby wyciągnąć wnioski. Gdyby np. cena akcji spółki przez wiele lat rosła niecyklicznie, to spodziewalibyśmy się, że wszystkie wykresy po zakupie będą wykazywały tendencję wzrostową. Podobnie niecykliczne spadki na przestrzeni wielu lat spowodowałyby spadek linii na wykresie po transakcjach. Żaden z tych wykresów nie sugeruje wykorzystywania informacji poufnych.
Najsilniejszym wskaźnikiem byłaby sytuacja, gdy cena akcji miała charakter wyjątkowo cykliczny, a na wykresie KUPNO występowały zarówno pozytywne sygnały na wykresie KUPNA, jak i negatywne na wykresie SPRZEDAŻY. Sytuacja ta wysoce sugerowałaby osobę mającą dostęp do informacji poufnych, która wykorzystywała transakcje w celu uzyskania korzyści finansowej.
Zakupy insidera CQP / Cheniere Energy Partners, L.P. - Limited Partnership – krótkoterminowa analiza zysków
W tej części analizujemy rentowność każdego nieplanowanego zakupu od poufnych informacji na otwartym rynku dokonanego w CQP / Cheniere Energy Partners, L.P. - Limited Partnership. Analiza ta pomaga zrozumieć, czy insider konsekwentnie generuje nietypowe zyski i czy warto ją śledzić. Analiza ta obejmuje okres jednego roku po każdej transakcji, a wyniki mają charakter teoretyczny .
Poniższa tabela przedstawia najnowsze zakupy na otwartym rynku, które nie były częścią planu handlu automatycznego.
Cena skorygowana to cena skorygowana o podział. Akcje skorygowane to akcje skorygowane o podział.
Sprzedaż insidera CQP / Cheniere Energy Partners, L.P. - Limited Partnership — analiza strat krótkoterminowych
W tej sekcji analizujemy możliwość uniknięcia krótkoterminowych strat w wyniku każdej nieplanowanej sprzedaży poufnych informacji na otwartym rynku dokonanej w CQP / Cheniere Energy Partners, L.P. - Limited Partnership. Konsekwentny wzorzec unikania strat może sugerować, że przyszłe transakcje sprzedaży mogą przewidywać spadki cen. Analiza ta obejmuje okres jednego roku po każdej transakcji, a wyniki mają charakter teoretyczny .
Poniższa tabela przedstawia najnowsze sprzedaże na otwartym rynku, które nie były częścią planu handlu automatycznego.
| Data transakcji | Ticker | Insider | Zgłoszone Akcje |
Zgłoszona Cena |
Skorygowane Akcje |
Skorygowana Cena |
Podstawa kalkulacji kosztów | Dni do min |
Cena min |
Uniknięta maksymalna strata ($) |
Uniknięta Maksymalna strata (%) |
|---|---|---|---|---|---|---|---|
| Nie znane są żadne nieplanowane transakcje na otwarttm rynku dla tej kombinacji insidera i papieru wartościowego |
Cena skorygowana to cena skorygowana o podział. Akcje skorygowane to akcje skorygowane o podział.
Zakupy insidera TGE / The Generation Essentials Group – krótkoterminowa analiza zysków
W tej części analizujemy rentowność każdego nieplanowanego zakupu od poufnych informacji na otwartym rynku dokonanego w CQP / Cheniere Energy Partners, L.P. - Limited Partnership. Analiza ta pomaga zrozumieć, czy insider konsekwentnie generuje nietypowe zyski i czy warto ją śledzić. Analiza ta obejmuje okres jednego roku po każdej transakcji, a wyniki mają charakter teoretyczny .
Poniższa tabela przedstawia najnowsze zakupy na otwartym rynku, które nie były częścią planu handlu automatycznego.
| Data transakcji | Ticker | Insider | Zgłoszone Akcje |
Zgłoszona Cena |
Skorygowane Akcje |
Skorygowana Cena |
Podstawa kalkulacji kosztów | Dni do maks |
Cena maks |
Maks Zysk ($) |
Maksymalny zwrot (%) |
|---|---|---|---|---|---|---|---|
| Nie znane są żadne nieplanowane transakcje na otwarttm rynku dla tej kombinacji insidera i papieru wartościowego |
Cena skorygowana to cena skorygowana o podział. Akcje skorygowane to akcje skorygowane o podział.
Sprzedaż insidera TGE / The Generation Essentials Group — analiza strat krótkoterminowych
W tej sekcji analizujemy możliwość uniknięcia krótkoterminowych strat w wyniku każdej nieplanowanej sprzedaży poufnych informacji na otwartym rynku dokonanej w CQP / Cheniere Energy Partners, L.P. - Limited Partnership. Konsekwentny wzorzec unikania strat może sugerować, że przyszłe transakcje sprzedaży mogą przewidywać spadki cen. Analiza ta obejmuje okres jednego roku po każdej transakcji, a wyniki mają charakter teoretyczny .
Poniższa tabela przedstawia najnowsze sprzedaże na otwartym rynku, które nie były częścią planu handlu automatycznego.
| Data transakcji | Ticker | Insider | Zgłoszone Akcje |
Zgłoszona Cena |
Skorygowane Akcje |
Skorygowana Cena |
Podstawa kalkulacji kosztów | Dni do min |
Cena min |
Uniknięta maksymalna strata ($) |
Uniknięta Maksymalna strata (%) |
|---|---|---|---|---|---|---|---|
| Nie znane są żadne nieplanowane transakcje na otwarttm rynku dla tej kombinacji insidera i papieru wartościowego |
Cena skorygowana to cena skorygowana o podział. Akcje skorygowane to akcje skorygowane o podział.
Historia handlu insiderów
Ta tabela przedstawia pełną listę transakcji insiderów dokonanych przez firmę Bia Gp L.p. ujawnioną Komisji Papierów Wartościowych (SEC).
| Data pliku | Data trans | Formularz | Ticker | Bezpieczeństwo | Kod | Akcje | Pozostałe akcje | Zmiana procent |
Cena udziału |
Wartość trans |
Pozostała Wartość |
|
|---|---|---|---|---|---|---|---|---|---|---|---|---|
| 2023-04-04 |
|
4 | CQP |
Cheniere Energy Partners, L.P.
Common Units |
J - Other | 2 453 | 123 848 | 2,02 | ||||
| 2023-04-04 |
|
4 | CQP |
Cheniere Energy Partners, L.P.
Common Units |
J - Other | 6 319 | 338 242 | 1,90 | ||||
| 2023-04-04 |
|
4 | CQP |
Cheniere Energy Partners, L.P.
Common Units |
J - Other | -6 004 | 0 | -100,00 | ||||
| 2023-04-04 |
|
4 | CQP |
Cheniere Energy Partners, L.P.
Common Units |
P - Purchase | 6 004 | 6 004 | 47,46 | 284 934 | 284 934 | ||
| 2023-04-04 |
|
4 | CQP |
Cheniere Energy Partners, L.P.
Common Units |
J - Other | -2 768 | 0 | -100,00 | ||||
| 2023-04-04 |
|
4 | CQP |
Cheniere Energy Partners, L.P.
Common Units |
P - Purchase | 2 768 | 2 768 | 47,46 | 131 362 | 131 362 | ||
| 2023-04-04 |
|
4 | CQP |
Cheniere Energy Partners, L.P.
Common Units |
J - Other | 5 295 | 121 395 | 4,56 | ||||
| 2023-04-04 |
|
4 | CQP |
Cheniere Energy Partners, L.P.
Common Units |
J - Other | 13 639 | 331 923 | 4,29 | ||||
| 2023-04-04 |
|
4 | CQP |
Cheniere Energy Partners, L.P.
Common Units |
J - Other | -12 959 | 0 | -100,00 | ||||
| 2023-04-04 |
|
4 | CQP |
Cheniere Energy Partners, L.P.
Common Units |
P - Purchase | 12 959 | 12 959 | 47,26 | 612 433 | 612 433 | ||
| 2023-04-04 |
|
4 | CQP |
Cheniere Energy Partners, L.P.
Common Units |
J - Other | -5 975 | 0 | -100,00 | ||||
| 2023-04-04 |
|
4 | CQP |
Cheniere Energy Partners, L.P.
Common Units |
P - Purchase | 5 975 | 5 975 | 47,26 | 282 374 | 282 374 | ||
| 2023-03-31 |
|
4 | CQP |
Cheniere Energy Partners, L.P.
Common Units |
J - Other | 19 403 | 116 100 | 20,07 | ||||
| 2023-03-31 |
|
4 | CQP |
Cheniere Energy Partners, L.P.
Common Units |
J - Other | 49 985 | 318 284 | 18,63 | ||||
| 2023-03-31 |
|
4 | CQP |
Cheniere Energy Partners, L.P.
Common Units |
J - Other | -47 490 | 0 | -100,00 | ||||
| 2023-03-31 |
|
4 | CQP |
Cheniere Energy Partners, L.P.
Common Units |
P - Purchase | 47 490 | 47 490 | 47,14 | 2 238 527 | 2 238 527 | ||
| 2023-03-31 |
|
4 | CQP |
Cheniere Energy Partners, L.P.
Common Units |
J - Other | -21 898 | 0 | -100,00 | ||||
| 2023-03-31 |
|
4 | CQP |
Cheniere Energy Partners, L.P.
Common Units |
P - Purchase | 21 898 | 21 898 | 47,14 | 1 032 202 | 1 032 202 | ||
| 2023-03-31 |
|
4 | CQP |
Cheniere Energy Partners, L.P.
Common Units |
J - Other | 7 573 | 96 697 | 8,50 | ||||
| 2023-03-31 |
|
4 | CQP |
Cheniere Energy Partners, L.P.
Common Units |
J - Other | 19 509 | 268 299 | 7,84 | ||||
| 2023-03-31 |
|
4 | CQP |
Cheniere Energy Partners, L.P.
Common Units |
J - Other | -18 535 | 0 | -100,00 | ||||
| 2023-03-31 |
|
4 | CQP |
Cheniere Energy Partners, L.P.
Common Units |
P - Purchase | 18 535 | 18 535 | 47,11 | 873 184 | 873 184 | ||
| 2023-03-31 |
|
4 | CQP |
Cheniere Energy Partners, L.P.
Common Units |
J - Other | -8 547 | 0 | -100,00 | ||||
| 2023-03-31 |
|
4 | CQP |
Cheniere Energy Partners, L.P.
Common Units |
P - Purchase | 8 547 | 8 547 | 47,11 | 402 649 | 402 649 | ||
| 2023-03-29 |
|
4 | CQP |
Cheniere Energy Partners, L.P.
Common Units |
J - Other | 6 249 | 89 124 | 7,54 | ||||
| 2023-03-29 |
|
4 | CQP |
Cheniere Energy Partners, L.P.
Common Units |
J - Other | 16 097 | 248 790 | 6,92 | ||||
| 2023-03-29 |
|
4 | CQP |
Cheniere Energy Partners, L.P.
Common Units |
J - Other | -15 294 | 0 | -100,00 | ||||
| 2023-03-29 |
|
4 | CQP |
Cheniere Energy Partners, L.P.
Common Units |
P - Purchase | 3 398 | 15 294 | 28,56 | 47,02 | 159 788 | 719 185 | |
| 2023-03-29 |
|
4 | CQP |
Cheniere Energy Partners, L.P.
Common Units |
P - Purchase | 11 896 | 11 896 | 46,84 | 557 197 | 557 197 | ||
| 2023-03-29 |
|
4 | CQP |
Cheniere Energy Partners, L.P.
Common Units |
J - Other | -7 052 | 0 | -100,00 | ||||
| 2023-03-29 |
|
4 | CQP |
Cheniere Energy Partners, L.P.
Common Units |
P - Purchase | 1 567 | 7 052 | 28,57 | 47,02 | 73 687 | 331 613 | |
| 2023-03-29 |
|
4 | CQP |
Cheniere Energy Partners, L.P.
Common Units |
P - Purchase | 5 485 | 5 485 | 46,84 | 256 912 | 256 912 | ||
| 2023-03-29 |
|
4 | CQP |
Cheniere Energy Partners, L.P.
Common Units |
J - Other | 14 936 | 82 875 | 21,98 | ||||
| 2023-03-29 |
|
4 | CQP |
Cheniere Energy Partners, L.P.
Common Units |
J - Other | 38 477 | 232 693 | 19,81 | ||||
| 2023-03-29 |
|
4 | CQP |
Cheniere Energy Partners, L.P.
Common Units |
J - Other | -36 557 | 0 | -100,00 | ||||
| 2023-03-29 |
|
4 | CQP |
Cheniere Energy Partners, L.P.
Common Units |
P - Purchase | 30 289 | 36 557 | 483,23 | 45,87 | 1 389 296 | 1 676 796 | |
| 2023-03-29 |
|
4 | CQP |
Cheniere Energy Partners, L.P.
Common Units |
P - Purchase | 6 268 | 6 268 | 45,06 | 282 417 | 282 417 | ||
| 2023-03-29 |
|
4 | CQP |
Cheniere Energy Partners, L.P.
Common Units |
J - Other | -16 856 | 0 | -100,00 | ||||
| 2023-03-29 |
|
4 | CQP |
Cheniere Energy Partners, L.P.
Common Units |
P - Purchase | 13 966 | 16 856 | 483,25 | 45,87 | 640 592 | 773 151 | |
| 2023-03-29 |
|
4 | CQP |
Cheniere Energy Partners, L.P.
Common Units |
P - Purchase | 2 890 | 2 890 | 45,06 | 130 215 | 130 215 | ||
| 2021-10-04 |
|
4 | CQP |
Cheniere Energy Partners, L.P.
Common Units |
J - Other | 2 455 | 67 939 | 3,75 | ||||
| 2021-10-04 |
|
4 | CQP |
Cheniere Energy Partners, L.P.
Common Units |
J - Other | 7 018 | 194 216 | 3,75 | ||||
| 2021-10-04 |
|
4 | CQP |
Cheniere Energy Partners, L.P.
Common Units |
J - Other | -9 473 | 0 | -100,00 | ||||
| 2021-10-04 |
|
4 | CQP |
Cheniere Energy Partners, L.P.
Common Units |
P - Purchase | 9 473 | 9 473 | 40,96 | 387 986 | 387 986 | ||
| 2021-10-04 |
|
4 | CQP |
Cheniere Energy Partners, L.P.
Common Units |
J - Other | 9 082 | 65 484 | 16,10 | ||||
| 2021-10-04 |
|
4 | CQP |
Cheniere Energy Partners, L.P.
Common Units |
J - Other | 25 962 | 187 198 | 16,10 | ||||
| 2021-10-04 |
|
4 | CQP |
Cheniere Energy Partners, L.P.
Common Units |
J - Other | -35 044 | 0 | -100,00 | ||||
| 2021-10-04 |
|
4 | CQP |
Cheniere Energy Partners, L.P.
Common Units |
P - Purchase | 35 044 | 35 044 | 40,93 | 1 434 351 | 1 434 351 | ||
| 2021-10-04 |
|
4 | CQP |
Cheniere Energy Partners, L.P.
Common Units |
J - Other | 1 | 56 402 | 0,00 | ||||
| 2021-10-04 |
|
4 | CQP |
Cheniere Energy Partners, L.P.
Common Units |
J - Other | 1 | 56 402 | 0,00 | ||||
| 2021-10-04 |
|
4 | CQP |
Cheniere Energy Partners, L.P.
Common Units |
J - Other | -2 | 0 | -100,00 | ||||
| 2021-10-04 |
|
4 | CQP |
Cheniere Energy Partners, L.P.
Common Units |
L - Other | 2 | 2 | 40,90 | 82 | 82 | ||
| 2021-09-28 |
|
4 | CQP |
Cheniere Energy Partners, L.P.
Common Units |
J - Other | 26 | 56 401 | 0,05 | ||||
| 2021-09-28 |
|
4 | CQP |
Cheniere Energy Partners, L.P.
Common Units |
J - Other | 74 | 161 235 | 0,05 | ||||
| 2021-09-28 |
|
4 | CQP |
Cheniere Energy Partners, L.P.
Common Units |
J - Other | -100 | 0 | -100,00 | ||||
| 2021-09-28 |
|
4 | CQP |
Cheniere Energy Partners, L.P.
Common Units |
P - Purchase | 100 | 100 | 40,90 | 4 090 | 4 090 | ||
| 2021-09-28 |
|
4 | CQP |
Cheniere Energy Partners, L.P.
Common Units |
J - Other | 29 | 56 375 | 0,05 | ||||
| 2021-09-28 |
|
4 | CQP |
Cheniere Energy Partners, L.P.
Common Units |
J - Other | 84 | 161 161 | 0,05 | ||||
| 2021-09-28 |
|
4 | CQP |
Cheniere Energy Partners, L.P.
Common Units |
J - Other | -113 | 0 | -100,00 | ||||
| 2021-09-28 |
|
4 | CQP |
Cheniere Energy Partners, L.P.
Common Units |
P - Purchase | 113 | 113 | 40,00 | 4 520 | 4 520 | ||
| 2021-09-24 |
|
4 | CQP |
Cheniere Energy Partners, L.P.
Common Units |
J - Other | 17 | 56 346 | 0,03 | ||||
| 2021-09-24 |
|
4 | CQP |
Cheniere Energy Partners, L.P.
Common Units |
J - Other | 50 | 161 077 | 0,03 | ||||
| 2021-09-24 |
|
4 | CQP |
Cheniere Energy Partners, L.P.
Common Units |
J - Other | -67 | 0 | -100,00 | ||||
| 2021-09-24 |
|
4 | CQP |
Cheniere Energy Partners, L.P.
Common Units |
P - Purchase | 67 | 67 | 40,00 | 2 680 | 2 680 | ||
| 2021-09-24 |
|
4 | CQP |
Cheniere Energy Partners, L.P.
Common Units |
J - Other | 7 785 | 56 329 | 16,04 | ||||
| 2021-09-24 |
|
4 | CQP |
Cheniere Energy Partners, L.P.
Common Units |
J - Other | 22 255 | 161 027 | 16,04 | ||||
| 2021-09-24 |
|
4 | CQP |
Cheniere Energy Partners, L.P.
Common Units |
J - Other | -30 400 | 0 | -100,00 | ||||
| 2021-09-24 |
|
4 | CQP |
Cheniere Energy Partners, L.P.
Common Units |
P - Purchase | 30 400 | 30 400 | 39,60 | 1 203 937 | 1 203 937 | ||
| 2021-06-09 |
|
4 | CQP |
Cheniere Energy Partners, L.P.
Common Units |
J - Other | -215 | 2 011 447 | -0,01 | ||||
| 2021-06-09 |
|
4 | CQP |
Cheniere Energy Partners, L.P.
Common Units |
J - Other | -19 868 | 185 808 450 | -0,01 | ||||
| 2021-06-09 |
|
4 | CQP |
Cheniere Energy Partners, L.P.
Common Units |
J - Other | -241 | 2 250 419 | -0,01 | ||||
| 2021-06-09 |
|
4 | CQP |
Cheniere Energy Partners, L.P.
Common Units |
J - Other | -215 | 2 011 447 | -0,01 | ||||
| 2021-06-09 |
|
4 | CQP |
Cheniere Energy Partners, L.P.
Common Units |
J - Other | -19 868 | 185 808 450 | -0,01 | ||||
| 2021-06-09 |
|
4 | CQP |
Cheniere Energy Partners, L.P.
Common Units |
J - Other | -241 | 2 250 419 | -0,01 | ||||
| 2021-01-06 |
|
4 | CQP |
Cheniere Energy Partners, L.P.
Common Units |
J - Other | 10 995 | 48 544 | 29,28 | ||||
| 2021-01-06 |
|
4 | CQP |
Cheniere Energy Partners, L.P.
Common Units |
J - Other | 31 430 | 138 772 | 29,28 | ||||
| 2021-01-06 |
|
4 | CQP |
Cheniere Energy Partners, L.P.
Common Units |
J - Other | -42 425 | 2 250 419 | -1,85 | ||||
| 2021-01-06 |
|
4 | CQP |
Cheniere Energy Partners, L.P.
Common Units |
P - Purchase | 42 425 | 2 292 844 | 1,89 | 34,93 | 1 481 905 | 80 089 041 | |
| 2021-01-05 |
|
4 | CQP |
Cheniere Energy Partners, L.P.
Common Units |
J - Other | 18 538 | 37 549 | 97,51 | ||||
| 2021-01-05 |
|
4 | CQP |
Cheniere Energy Partners, L.P.
Common Units |
J - Other | 52 994 | 107 342 | 97,51 | ||||
| 2021-01-05 |
|
4 | CQP |
Cheniere Energy Partners, L.P.
Common Units |
J - Other | -71 532 | 2 250 419 | -3,08 | ||||
| 2021-01-05 |
|
4 | CQP |
Cheniere Energy Partners, L.P.
Common Units |
P - Purchase | 20 360 | 2 321 951 | 0,88 | 35,43 | 721 355 | 82 266 724 | |
| 2021-01-05 |
|
4 | CQP |
Cheniere Energy Partners, L.P.
Common Units |
P - Purchase | 51 172 | 2 301 591 | 2,27 | 34,77 | 1 779 250 | 80 026 319 | |
| 2020-12-31 |
|
4 | CQP |
Cheniere Energy Partners, L.P.
Common Units |
J - Other | 19 011 | 19 011 | |||||
| 2020-12-31 |
|
4 | CQP |
Cheniere Energy Partners, L.P.
Common Units |
J - Other | 54 348 | 54 348 | |||||
| 2020-12-31 |
|
4 | CQP |
Cheniere Energy Partners, L.P.
Common Units |
J - Other | -73 359 | 2 250 419 | -3,16 | ||||
| 2020-12-31 |
|
4 | CQP |
Cheniere Energy Partners, L.P.
Common Units |
P - Purchase | 46 101 | 2 323 778 | 2,02 | 34,14 | 1 573 888 | 79 333 781 | |
| 2020-12-31 |
|
4 | CQP |
Cheniere Energy Partners, L.P.
Common Units |
P - Purchase | 27 258 | 2 277 677 | 1,21 | 33,71 | 918 867 | 76 780 492 | |
| 2020-09-28 | 3 | CQP |
Cheniere Energy Partners, L.P.
Common Units |
190 070 316 | ||||||||
| 2020-09-28 | 3 | CQP |
Cheniere Energy Partners, L.P.
Common Units |
13 170 436 | ||||||||
| 2020-04-17 |
|
4 | TGE |
Tallgrass Energy, LP
Class A shares |
P - Purchase | 152 770 061 | 0 | -100,00 | 22,45 | 3 429 687 869 | ||
| 2019-10-03 |
|
4 | TGE |
Tallgrass Energy, LP
TE units |
J - Other | 5 575 045 | 7 876 328 | 242,26 | ||||
| 2019-10-03 |
|
4 | TGE |
Tallgrass Energy, LP
TE units |
J - Other | -5 575 045 | 92 778 793 | -5,67 | ||||
| 2019-10-03 |
|
4 | TGE |
Tallgrass Energy, LP
Class B shares |
J - Other | 5 575 045 | 7 876 328 | 242,26 | ||||
| 2019-10-03 |
|
4 | TGE |
Tallgrass Energy, LP
Class B shares |
J - Other | -5 575 045 | 92 778 793 | -5,67 | ||||
| 2019-10-03 |
|
4 | TGE |
Tallgrass Energy, LP
Class A shares |
J - Other | -537 | 1 127 935 | -0,05 | ||||
| 2019-10-03 |
|
4 | TGE |
Tallgrass Energy, LP
Class A shares |
J - Other | -399 | 773 510 | -0,05 | ||||
| 2019-08-01 |
|
4 | TGE |
Tallgrass Energy, LP
TE units |
C - Conversion | -150 439 | 2 301 283 | -6,14 | ||||
| 2019-08-01 |
|
4 | TGE |
Tallgrass Energy, LP
TE units |
C - Conversion | -4 158 257 | 98 353 838 | -4,06 | ||||
| 2019-08-01 |
|
4 | TGE |
Tallgrass Energy, LP
Obligation to Transfer |
C - Conversion | -1 | 0 | -100,00 | ||||
| 2019-08-01 |
|
4 | TGE |
Tallgrass Energy, LP
Class B shares |
C - Conversion | -150 439 | 2 301 283 | -6,14 | ||||
| 2019-08-01 |
|
4 | TGE |
Tallgrass Energy, LP
Class B shares |
C - Conversion | -4 158 257 | 98 353 838 | -4,06 | ||||
| 2019-08-01 |
|
4 | TGE |
Tallgrass Energy, LP
Class A shares |
C - Conversion | -66 931 | 1 127 935 | -5,60 | ||||
| 2019-06-12 | 3/A | TGE |
Tallgrass Energy, LP
Class A shares |
21 751 018 | ||||||||
| 2019-06-12 | 3/A | TGE |
Tallgrass Energy, LP
Class B shares |
98 203 399 | ||||||||
| 2019-06-12 | 3/A | TGE |
Tallgrass Energy, LP
Class B shares |
2 451 722 | ||||||||
| 2019-05-10 |
|
4 | TGE |
Tallgrass Energy, LP
Class A Shares |
P - Purchase | X | 71 184 | 1 127 935 | 6,74 | 24,22 | 1 724 076 | 27 318 586 |
| 2019-05-10 |
|
4 | TGE |
Tallgrass Energy, LP
Class A Shares |
P - Purchase | X | 48 816 | 773 510 | 6,74 | 24,22 | 1 182 324 | 18 734 412 |
| 2019-05-07 |
|
4 | TGE |
Tallgrass Energy, LP
Class A Shares |
P - Purchase | X | 43 007 | 1 056 751 | 4,24 | 24,27 | 1 043 780 | 25 647 347 |
| 2019-05-07 |
|
4 | TGE |
Tallgrass Energy, LP
Class A Shares |
P - Purchase | X | 29 493 | 724 694 | 4,24 | 24,27 | 715 795 | 17 588 323 |
| 2019-05-07 |
|
4 | TGE |
Tallgrass Energy, LP
Class A Shares |
P - Purchase | X | 39 151 | 1 013 744 | 4,02 | 24,15 | 945 497 | 24 481 918 |
| 2019-05-07 |
|
4 | TGE |
Tallgrass Energy, LP
Class A Shares |
P - Purchase | X | 26 849 | 695 201 | 4,02 | 24,15 | 648 403 | 16 789 104 |
| 2019-05-07 |
|
4 | TGE |
Tallgrass Energy, LP
Class A Shares |
P - Purchase | X | 50 659 | 974 593 | 5,48 | 23,96 | 1 213 790 | 23 351 248 |
| 2019-05-07 |
|
4 | TGE |
Tallgrass Energy, LP
Class A Shares |
P - Purchase | X | 34 741 | 668 352 | 5,48 | 23,96 | 832 394 | 16 013 714 |
| 2019-05-02 |
|
4 | TGE |
Tallgrass Energy, LP
Class A Shares |
P - Purchase | X | 86 014 | 923 934 | 10,27 | 23,77 | 2 044 553 | 21 961 911 |
| 2019-05-02 |
|
4 | TGE |
Tallgrass Energy, LP
Class A Shares |
P - Purchase | X | 58 986 | 633 611 | 10,27 | 23,77 | 1 402 097 | 15 060 933 |
| 2019-05-02 |
|
4 | TGE |
Tallgrass Energy, LP
Class A Shares |
P - Purchase | X | 71 396 | 837 920 | 9,31 | 23,92 | 1 707 792 | 20 043 046 |
| 2019-05-02 |
|
4 | TGE |
Tallgrass Energy, LP
Class A Shares |
P - Purchase | X | 48 962 | 574 625 | 9,31 | 23,92 | 1 171 171 | 13 745 030 |
| 2019-05-02 |
|
4 | TGE |
Tallgrass Energy, LP
Class A Shares |
P - Purchase | X | 65 252 | 766 524 | 9,30 | 24,15 | 1 575 836 | 18 511 555 |
| 2019-05-02 |
|
4 | TGE |
Tallgrass Energy, LP
Class A Shares |
P - Purchase | X | 44 748 | 525 663 | 9,30 | 24,15 | 1 080 664 | 12 694 761 |
| 2019-04-29 |
|
4 | TGE |
Tallgrass Energy, LP
Class A Shares |
P - Purchase | X | 65 845 | 701 272 | 10,36 | 24,20 | 1 593 449 | 16 970 782 |
| 2019-04-29 |
|
4 | TGE |
Tallgrass Energy, LP
Class A Shares |
P - Purchase | X | 45 155 | 480 915 | 10,36 | 24,20 | 1 092 751 | 11 638 143 |
| 2019-04-29 |
|
4 | TGE |
Tallgrass Energy, LP
Class A Shares |
P - Purchase | X | 89 039 | 635 427 | 16,30 | 24,47 | 2 178 784 | 15 548 899 |
| 2019-04-29 |
|
4 | TGE |
Tallgrass Energy, LP
Class A Shares |
P - Purchase | X | 61 061 | 435 760 | 16,30 | 24,47 | 1 494 163 | 10 663 047 |
| 2019-04-29 |
|
4 | TGE |
Tallgrass Energy, LP
Class A Shares |
P - Purchase | X | 42 177 | 546 388 | 8,36 | 24,45 | 1 031 228 | 13 359 187 |
| 2019-04-29 |
|
4 | TGE |
Tallgrass Energy, LP
Class A Shares |
P - Purchase | X | 28 923 | 374 699 | 8,36 | 24,45 | 707 167 | 9 161 391 |
| 2019-04-24 |
|
4 | TGE |
Tallgrass Energy, LP
Class A Shares |
P - Purchase | X | 18 326 | 504 211 | 3,77 | 24,49 | 448 804 | 12 348 127 |
| 2019-04-24 |
|
4 | TGE |
Tallgrass Energy, LP
Class A Shares |
P - Purchase | X | 12 568 | 345 776 | 3,77 | 24,49 | 307 790 | 8 468 054 |
| 2019-04-24 |
|
4 | TGE |
Tallgrass Energy, LP
Class A Shares |
P - Purchase | X | 7 750 | 485 885 | 1,62 | 24,49 | 189 798 | 11 899 324 |
| 2019-04-24 |
|
4 | TGE |
Tallgrass Energy, LP
Class A Shares |
P - Purchase | X | 5 314 | 333 208 | 1,62 | 24,49 | 130 140 | 8 160 264 |
| 2019-04-24 |
|
4 | TGE |
Tallgrass Energy, LP
Class A Shares |
P - Purchase | X | 237 | 478 135 | 0,05 | 24,49 | 5 804 | 11 709 526 |
| 2019-04-24 |
|
4 | TGE |
Tallgrass Energy, LP
Class A Shares |
P - Purchase | X | 163 | 327 894 | 0,05 | 24,49 | 3 992 | 8 030 124 |
| 2019-04-19 |
|
4 | TGE |
Tallgrass Energy, LP
Class A Shares |
P - Purchase | X | 75 692 | 477 898 | 18,82 | 24,40 | 1 846 885 | 11 660 711 |
| 2019-04-19 |
|
4 | TGE |
Tallgrass Energy, LP
Class A Shares |
P - Purchase | X | 51 908 | 327 731 | 18,82 | 24,40 | 1 266 555 | 7 996 636 |
| 2019-04-19 |
|
4 | TGE |
Tallgrass Energy, LP
Class A Shares |
P - Purchase | X | 1 614 | 402 206 | 0,40 | 24,49 | 39 527 | 9 850 025 |
| 2019-04-19 |
|
4 | TGE |
Tallgrass Energy, LP
Class A Shares |
P - Purchase | X | 1 106 | 275 823 | 0,40 | 24,49 | 27 086 | 6 754 905 |
| 2019-04-11 |
|
4 | TGE |
Tallgrass Energy, LP
Class A Shares |
P - Purchase | X | 15 911 | 400 592 | 4,14 | 24,50 | 389 820 | 9 814 504 |
| 2019-04-11 |
|
4 | TGE |
Tallgrass Energy, LP
Class A Shares |
P - Purchase | X | 10 912 | 274 717 | 4,14 | 24,50 | 267 344 | 6 730 566 |
| 2019-04-11 |
|
4 | TGE |
Tallgrass Energy, LP
Class A Shares |
P - Purchase | X | 3 802 | 384 681 | 1,00 | 24,49 | 93 111 | 9 420 838 |
| 2019-04-11 |
|
4 | TGE |
Tallgrass Energy, LP
Class A Shares |
P - Purchase | X | 2 608 | 263 805 | 1,00 | 24,49 | 63 870 | 6 460 584 |
| 2019-04-11 |
|
4 | TGE |
Tallgrass Energy, LP
Class A Shares |
P - Purchase | X | 27 466 | 380 879 | 7,77 | 24,48 | 672 368 | 9 323 918 |
| 2019-04-11 |
|
4 | TGE |
Tallgrass Energy, LP
Class A Shares |
P - Purchase | X | 18 835 | 261 197 | 7,77 | 24,48 | 461 081 | 6 394 103 |
| 2019-03-29 |
|
4 | TGE |
Tallgrass Energy, LP
Class A Shares |
P - Purchase | 183 294 | 353 413 | 107,74 | 23,76 | 4 355 065 | 8 397 093 | |
| 2019-03-29 |
|
4 | TGE |
Tallgrass Energy, LP
Class A Shares |
P - Purchase | 125 698 | 242 362 | 107,74 | 23,76 | 2 986 584 | 5 758 521 | |
| 2019-03-27 |
|
4 | TGE |
Tallgrass Energy, LP
Class A Shares |
P - Purchase | X | 415 | 170 119 | 0,24 | 24,50 | 10 168 | 4 167 916 |
| 2019-03-27 |
|
4 | TGE |
Tallgrass Energy, LP
Class A Shares |
P - Purchase | X | 285 | 116 664 | 0,24 | 24,50 | 6 982 | 2 858 268 |
| 2019-03-21 |
|
4 | TGE |
Tallgrass Energy, LP
Class A Shares |
P - Purchase | X | 939 | 167 704 | 0,56 | 24,49 | 22 996 | 4 107 071 |
| 2019-03-21 |
|
4 | TGE |
Tallgrass Energy, LP
Class A Shares |
P - Purchase | X | 644 | 116 379 | 0,56 | 24,49 | 15 772 | 2 850 122 |
| 2019-03-18 | 3 | TGE |
Tallgrass Energy, LP
Class A shares |
144 157 157 | ||||||||
| 2019-03-18 | 3 | TGE |
Tallgrass Energy, LP
Class B shares |
220 473 321 | ||||||||
| 2019-03-18 | 3 | TGE |
Tallgrass Energy, LP
Class B shares |
124 994 078 | ||||||||
| 2019-03-18 | 3 | TGE |
Tallgrass Energy, LP
Class A shares |
144 157 157 | ||||||||
| 2019-03-18 | 3 | TGE |
Tallgrass Energy, LP
Class B shares |
220 473 321 | ||||||||
| 2019-03-18 | 3 | TGE |
Tallgrass Energy, LP
Class B shares |
124 994 078 | ||||||||
| 2019-03-18 | 3 | TGE |
Tallgrass Energy, LP
Class A shares |
144 157 157 | ||||||||
| 2019-03-18 | 3 | TGE |
Tallgrass Energy, LP
Class B shares |
220 473 321 | ||||||||
| 2019-03-18 | 3 | TGE |
Tallgrass Energy, LP
Class B shares |
124 994 078 | ||||||||
| 2019-03-18 | 3 | TGE |
Tallgrass Energy, LP
Class A shares |
144 157 157 | ||||||||
| 2019-03-18 | 3 | TGE |
Tallgrass Energy, LP
Class B shares |
220 473 321 | ||||||||
| 2019-03-18 | 3 | TGE |
Tallgrass Energy, LP
Class B shares |
124 994 078 | ||||||||
| 2019-03-18 | 3 | TGE |
Tallgrass Energy, LP
Class A shares |
144 157 157 | ||||||||
| 2019-03-18 | 3 | TGE |
Tallgrass Energy, LP
Class B shares |
220 473 321 | ||||||||
| 2019-03-18 | 3 | TGE |
Tallgrass Energy, LP
Class B shares |
124 994 078 | ||||||||
| 2019-03-18 | 3 | TGE |
Tallgrass Energy, LP
Class A shares |
144 157 157 | ||||||||
| 2019-03-18 | 3 | TGE |
Tallgrass Energy, LP
Class B shares |
220 473 321 | ||||||||
| 2019-03-18 | 3 | TGE |
Tallgrass Energy, LP
Class B shares |
124 994 078 | ||||||||
| 2019-03-18 | 3 | TGE |
Tallgrass Energy, LP
Class A shares |
144 157 157 | ||||||||
| 2019-03-18 | 3 | TGE |
Tallgrass Energy, LP
Class B shares |
220 473 321 | ||||||||
| 2019-03-18 | 3 | TGE |
Tallgrass Energy, LP
Class B shares |
124 994 078 | ||||||||
| 2019-03-18 | 3 | TGE |
Tallgrass Energy, LP
Class A shares |
144 157 157 | ||||||||
| 2019-03-18 | 3 | TGE |
Tallgrass Energy, LP
Class B shares |
220 473 321 | ||||||||
| 2019-03-18 | 3 | TGE |
Tallgrass Energy, LP
Class B shares |
124 994 078 | ||||||||
| 2019-03-18 | 3 | TGE |
Tallgrass Energy, LP
Class A shares |
144 157 157 | ||||||||
| 2019-03-18 | 3 | TGE |
Tallgrass Energy, LP
Class B shares |
220 473 321 | ||||||||
| 2019-03-18 | 3 | TGE |
Tallgrass Energy, LP
Class B shares |
124 994 078 | ||||||||
| 2019-03-18 |
|
4 | TGE |
Tallgrass Energy, LP
Class A Shares |
P - Purchase | X | 44 490 | 168 765 | 35,80 | 24,16 | 1 074 878 | 4 077 362 |
| 2019-03-18 |
|
4 | TGE |
Tallgrass Energy, LP
Class A Shares |
P - Purchase | X | 30 510 | 115 735 | 35,80 | 24,16 | 737 122 | 2 796 158 |
| 2019-03-18 |
|
4 | TGE |
Tallgrass Energy, LP
Class A Shares |
P - Purchase | X | 59 320 | 124 275 | 91,32 | 24,14 | 1 431 985 | 2 999 998 |
| 2019-03-18 |
|
4 | TGE |
Tallgrass Energy, LP
Class A Shares |
P - Purchase | X | 40 680 | 85 225 | 91,32 | 24,14 | 982 015 | 2 057 332 |
| 2019-03-18 |
|
4 | TGE |
Tallgrass Energy, LP
Class A Shares |
P - Purchase | X | 64 955 | 64 955 | 23,95 | 1 555 672 | 1 555 672 | |
| 2019-03-18 |
|
4 | TGE |
Tallgrass Energy, LP
Class A Shares |
P - Purchase | X | 44 545 | 44 545 | 23,95 | 1 066 853 | 1 066 853 |
P
Otwarty rynek lub prywatny zakup niepochodnych lub pochodnych papierów wartościowych
S
Otwarty rynek lub prywatna sprzedaż niepochodnych lub pochodnych papierów wartościowych
A
Grant, nagroda lub inne nabycie papierów wartościowych od spółki (np. opcja)
C
Konwersja instrumentu pochodnego
D
Sprzedaż lub przeniesienie papierów wartościowych z powrotem do spółki
F
Zapłata ceny wykonania lub zobowiązania podatkowego z wykorzystaniem części papierów wartościowych otrzymanych od spółki
G
Darowizna papierów wartościowych przez lub na rzecz insidera
K
Swapy kapitałowe i podobne transakcje zabezpieczające
M
Wykonanie lub konwersja pochodnego papieru wartościowego otrzymanego od spółki (takiego jak opcja)
V
Transakcja dobrowolnie zgłoszona na Formularzu 4
J
Inne (wraz z przypisem opisującym transakcję)