Podstawowe statystyki
| Akcje instytucjonalne (długie) | 522 378 773 - 97,67% (ex 13D/G) - change of -122,77MM shares -19,03% MRQ |
| Wartość instytucjonalna (długa) | $ 42 196 995 USD ($1000) |
Własność instytucjonalna i akcjonariusze
American International Group, Inc. (US:AIG) posiada 1157 właściciele instytucjonalni i akcjonariusze, którzy złożyli formularze 13D/G lub 13F w Komisji Papierów Wartościowych (SEC). Instytucje te posiadają łącznie 522,378,773 akcji. Do największych akcjonariuszy należą Vanguard Group Inc, BlackRock, Inc., Capital Research Global Investors, Wellington Management Group Llp, State Street Corp, Harris Associates L P, Price T Rowe Associates Inc /md/, Invesco Ltd., Franklin Resources Inc, and GQG Partners LLC .
American International Group, Inc. (NYSE:AIG) instytucjonalna struktura własności pokazuje aktualne pozycje w firmie według instytucji i funduszy, a także najnowsze zmiany w wielkości stanowisk. Głównymi akcjonariuszami mogą być inwestorzy indywidualni, fundusze inwestycyjne, fundusze hedgingowe lub instytucje. Załącznik 13D wskazuje, że inwestor posiada (lub posiadał) więcej niż 5% udziałów w spółce i zamierza (lub zamierzał) aktywnie dążyć do zmiany strategii biznesowej. Załącznik 13G wskazuje na inwestycję pasywną na poziomie ponad 5%.
The share price as of April 8, 2026 is 77,43 / share. Previously, on April 9, 2025, the share price was 82,82 / share. This represents a decline of 6,51% over that period.

Ocena sentymentu funduszu
Wskaźnik sentymentu funduszu (fka Ownership Accumulation Score) pozwala określić akcje, które są najczęściej kupowane przez fundusze. Jest to wynik zaawansowanego, wieloczynnikowego modelu ilościowego, który identyfikuje spółki o najwyższym poziomie akumulacji instytucjonalnej. Model oceny wykorzystuje kombinację całkowitego wzrostu liczby ujawnionych właścicieli, zmian w alokacji portfela wśród tych właścicieli i innych wskaźników. Liczba waha się od 0 do 100, przy czym wyższe liczby wskazują na wyższy poziom akumulacji w stosunku do innych spółek, a 50 oznacza średnią.
Częstotliwość aktualizacji: codziennie
Sprawdź Ownership Explorer, który zawiera listę firm o najwyższym rankingu.
AI+ Ask Fintel’s AI assistant about American International Group, Inc..
Select a question to share a public post with an AI-crafted answer.
Thinking of good questions…
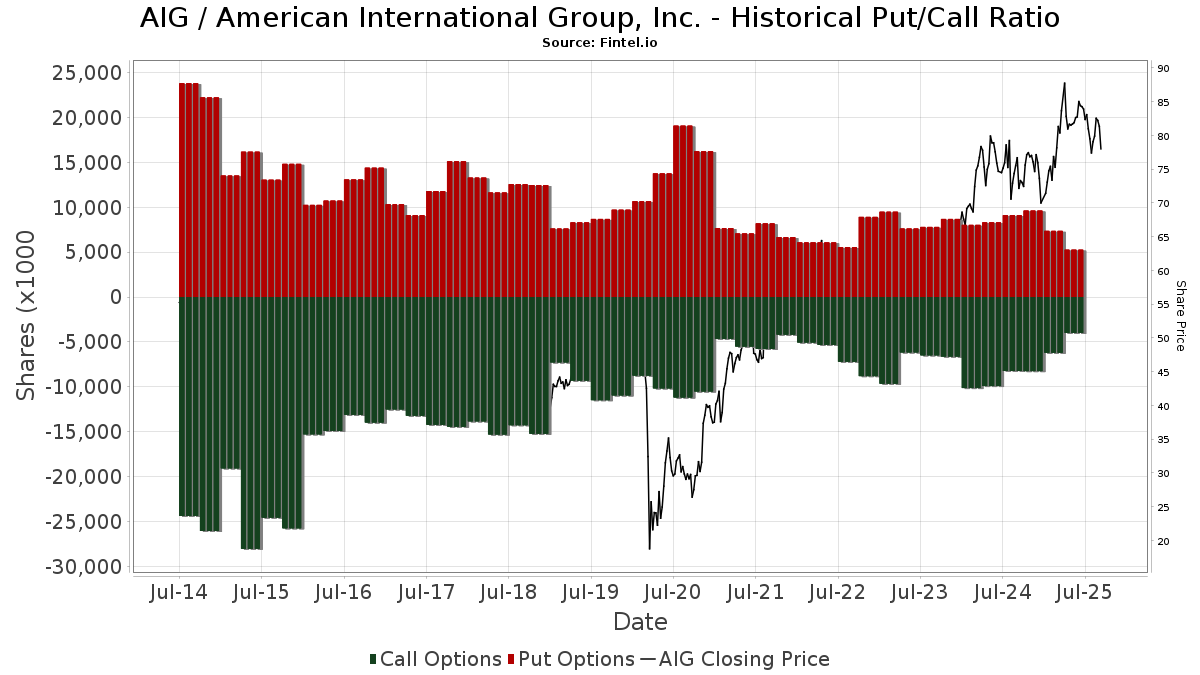
Instytucjonalny współczynnik put/call
Oprócz zgłaszania standardowych emisji akcji i długów instytucje zarządzające aktywami o wartości przekraczającej 100 mln muszą również ujawniać posiadane przez siebie opcje put i call (sprzedaży i kupna). Ponieważ opcje sprzedaży zazwyczaj wskazują na negatywny sentyment, a opcje kupna na pozytywne, możemy poznać ogólny sentyment instytucjonalny, wykreślając stosunek opcji sprzedaży do opcji kupna. Wykres po prawej stronie przedstawia historyczny współczynnik sprzedaży/sprzedaży dla tego instrumentu.
Stosowanie współczynnika Put/Call jako wskaźnika nastrojów inwestorów pozwala przezwyciężyć jedną z kluczowych wad stosowania całkowitej własności instytucjonalnej, która polega na tym, że znaczna część zarządzanych aktywów jest inwestowana pasywnie w celu śledzenia indeksów. Fundusze zarządzane pasywnie zazwyczaj nie kupują opcji, zatem wskaźnik współczynnika pu/call lepiej odzwierciedla sentyment funduszy zarządzanych aktywnie.
Zgłoszenia 13D/G
Zgłoszenia 13D/G prezentujemy oddzielnie od zgłoszeń 13F ze względu na odmienne traktowanie przez SEC. Zgłoszenia 13D/G mogą składać grupy inwestorów (z jednym prowadzącym), natomiast zgłoszeń 13F nie. Prowadzi to do sytuacji, w których inwestor może złożyć formularz 13D/G, podając jedną wartość dla wszystkich udziałów (reprezentujących wszystkie akcje posiadane przez grupę inwestorów), ale następnie złożyć formularz 13F, podając inną wartość dla wszystkich udziałów (eprezentujących wyłącznie ich własność). Oznacza to, że własność udziałów w zgłoszeniach 13D/G i zgłoszeniach 13F często nie jest bezpośrednio porównywalna, dlatego prezentujemy je osobno.
Uwaga: od 16 maja 2021 r. nie pokazujemy już właścicieli, którzy nie złożyli wniosku 13D/G w ciągu ostatniego roku. Wcześniej pokazywaliśmy pełną historię zgłoszeń 13D/G. Ogólnie rzecz biorąc, podmioty, które są zobowiązane do składania zgłoszeń 13D/G, muszą składać je co najmniej raz w roku przed złożeniem zgłoszenia końcowego. Jednakże fundusze czasami zamykają pozycje bez złożenia zgłoszenia zamykającego (tj. likwidują pozycję), więc wyświetlenie pełnej historii czasami powodowało zamieszanie co do aktualnego właściciela. Aby uniknąć nieporozumień, pokazujemy teraz tylko „obecnych” właścicieli, czyli tych, którzy złożyli wniosek w ciągu ostatniego roku.
Upgrade to unlock premium data.
| Data pliku | Formularz | Inwestor | Poprzednie Akcje |
Najnowsze Akcje |
Akcje; &Delta (Procent) |
Własność (Procent) |
Własność; Δ (Procent) |
|
|---|---|---|---|---|---|---|---|---|
| 2026-02-12 | Capital Research Global Investors | 28,534,448 | 26,228,641 | -8.08 | 4.90 | -5.77 | ||
| 2025-10-30 | VANGUARD GROUP INC | 71,962,174 | 68,482,752 | -4.84 | 12.36 | 20.59 | ||
| 2025-04-17 | BlackRock, Inc. | 62,640,753 | 41,200,202 | -34.23 | 6.90 | -22.47 |
Zgłoszenia 13F i NPORT
Szczegółowe dane dotyczące zgłoszeń 13F są bezpłatne. Szczegółowe dane dotyczące zgłoszeń NP wymagają członkostwa premium. Zielone rzędy wskazują nowe pozycje. Czerwone rzędy wskazują pozycje zamknięte. Kliknij w ikonę linku, aby zobaczyć pełną historię transakcji.
Aktualizacja
aby odblokować dane premium i eksportować do Excela ![]() .
.
Important Note
In an effort to reduce load times for our mobile users, we are testing some ways to deliver lighter pages.
In this first test, we will deliver only the most recent 750 transactions (out of 1437 for this stock). If you are interested in loading *all* the transactions for this company, click the "load all" button below. This is just a test and if you don't like it, please let us know by submitting some gentle feedback via the link at the bottom of this page.
Load All| Data pliku | Źródło | Inwestor | Typ | Średnia cena (Est) |
Akcje | Akcje; Δ (%) |
Zgłoszono Wartość ($1000) |
Wartość; Δ (%) |
Przydział portu (%) |
|
|---|---|---|---|---|---|---|---|---|---|---|
| 2026-02-09 | 13F | Frazier Financial Advisors, LLC | 230 | 0,00 | 20 | 5,56 | ||||
| 2026-01-14 | 13F | Baron Wealth Management LLC | 2 979 | 0,81 | 255 | 9,48 | ||||
| 2026-01-20 | 13F | Trust Co Of Toledo Na /oh/ | 431 | 0,00 | 37 | 9,09 | ||||
| 2026-02-13 | 13F | Ausdal Financial Partners, Inc. | 5 527 | 1,45 | 473 | 10,54 | ||||
| 2026-03-13 | 13F/A | Pensionmark Financial Group, Llc | 10 755 | 5,00 | 920 | 14,43 | ||||
| 2026-01-23 | 13F | Valley National Advisers Inc | 16 | 0 | ||||||
| 2026-02-20 | 13F | Kovitz Investment Group Partners, LLC | 147 660 | -14,44 | 12 632 | -6,80 | ||||
| 2025-11-14 | 13F | Horiko Capital Management Llc | 0 | -100,00 | 0 | |||||
| 2026-01-27 | 13F | GHP Investment Advisors, Inc. | 4 141 | 0,41 | 354 | 9,60 | ||||
| 2026-02-13 | 13F | Sterling Capital Management LLC | 1 771 | -34,99 | 152 | -29,11 | ||||
| 2026-02-17 | 13F | Cardiff Park Advisors, Llc | 2 565 | 0,00 | 219 | 8,96 | ||||
| 2026-01-16 | 13F | Ronald Blue Trust, Inc. | 1 697 | -1,45 | 145 | 7,41 | ||||
| 2026-04-07 | 13F | Farther Finance Advisors, LLC | 11 540 | 8,30 | 872 | -4,39 | ||||
| 2026-02-17 | 13F | Equitable Holdings, Inc. | 3 917 | 15,14 | 335 | 25,47 | ||||
| 2026-02-05 | 13F | Cambridge Investment Research Advisors, Inc. | 15 784 | -3,32 | 1 | 0,00 | ||||
| 2026-02-13 | 13F | Verition Fund Management LLC | Call | 13 000 | -77,66 | 1 112 | -75,67 | |||
| 2026-02-13 | 13F | Verition Fund Management LLC | 55 679 | -58,57 | 4 763 | -54,87 | ||||
| 2026-04-02 | 13F | Lvm Capital Management Ltd/mi | 0 | -100,00 | 0 | |||||
| 2026-02-11 | 13F | Hughes Financial Services, LLC | 12 | -55,56 | 1 | -50,00 | ||||
| 2026-02-23 | 13F | Mv Capital Management, Inc. | 2 057 | -20,76 | 176 | -21,17 | ||||
| 2026-01-27 | 13F | Novem Group | 3 272 | 23,05 | 280 | 34,13 | ||||
| 2026-02-17 | 13F | Hotchkis & Wiley Capital Management Llc | 10 270 323 | 0,14 | 878 626 | 9,07 | ||||
| 2026-02-17 | 13F | Credit Agricole S A | 150 113 | -22,32 | 12 842 | -15,39 | ||||
| 2026-02-13 | 13F | Verition Fund Management LLC | Put | 36 400 | -60,69 | 3 114 | -57,18 | |||
| 2026-01-07 | 13F | Harbor Investment Advisory, Llc | 1 635 | 173,41 | 140 | 202,17 | ||||
| 2026-01-12 | 13F | CVA Family Office, LLC | 2 648 | -0,94 | 227 | 8,13 | ||||
| 2026-02-13 | 13F | First Trust Advisors Lp | 1 227 076 | 62,73 | 104 976 | 77,25 | ||||
| 2026-02-03 | 13F | Credit Industriel Et Commercial | 0 | -100,00 | 0 | -100,00 | ||||
| 2026-02-13 | 13F | Public Sector Pension Investment Board | 137 414 | 15,03 | 11 756 | 25,29 | ||||
| 2026-01-29 | 13F | Dunhill Financial, LLC | 132 | -19,02 | 11 | -8,33 | ||||
| 2026-02-09 | 13F | Hartland & Co., LLC | 6 741 | 10,44 | 577 | 20,25 | ||||
| 2026-01-20 | 13F | Independence Bank of Kentucky | 24 | 2 | ||||||
| 2026-02-13 | 13F | Cornerstone Financial Management LLC | 77 | 7 | ||||||
| 2025-11-14 | 13F | Wolverine Trading, Llc | Call | 73 900 | 5 757 | |||||
| 2025-11-14 | 13F | Wolverine Trading, Llc | Put | 60 400 | 4 705 | |||||
| 2025-11-12 | 13F | Claro Advisors LLC | 0 | -100,00 | 0 | -100,00 | ||||
| 2026-01-16 | 13F | Tema Etfs Llc | 13 606 | -0,29 | 1 164 | 8,59 | ||||
| 2026-02-06 | 13F | Vestmark Advisory Solutions, Inc. | 20 581 | 39,59 | 1 761 | 52,12 | ||||
| 2025-10-24 | 13F | ORG Wealth Partners, LLC | 0 | -100,00 | 0 | -100,00 | ||||
| 2026-02-17 | 13F | Capital Fund Management S.a. | Put | 22 200 | -51,42 | 1 899 | -47,09 | |||
| 2026-02-11 | 13F | Zions Bancorporation, National Association /ut/ | 6 654 | 18,48 | 569 | 29,02 | ||||
| 2026-02-17 | 13F | Capital Fund Management S.a. | Call | 17 900 | -78,06 | 1 531 | -76,11 | |||
| 2026-02-02 | 13F | Caisse Des Depots Et Consignations | 20 619 | 207,33 | 1 764 | 235,17 | ||||
| 2026-02-05 | 13F | Pinnacle Associates Ltd | 7 678 | 0,29 | 657 | 9,15 | ||||
| 2026-02-10 | 13F | Bruce G. Allen Investments, LLC | 555 | 0,00 | 47 | 9,30 | ||||
| 2026-02-10 | 13F | Axq Capital, Lp | 6 901 | 590 | ||||||
| 2026-02-11 | 13F | Buckingham Strategic Partners | 9 261 | -28,85 | 792 | -21,27 | ||||
| 2026-02-12 | 13F | Hollencrest Capital Management | 5 013 | 0,00 | 429 | 8,91 | ||||
| 2026-01-26 | 13F | AE Wealth Management LLC | 4 133 | 14,81 | 354 | 25,18 | ||||
| 2026-02-11 | 13F | Meeder Advisory Services, Inc. | 17 927 | 1 534 | ||||||
| 2026-01-21 | 13F | Albion Financial Group /ut | 36 | -30,77 | 3 | -25,00 | ||||
| 2026-02-11 | 13F | Fox Run Management, L.l.c. | 6 547 | 560 | ||||||
| 2026-02-10 | 13F | Argent Trust Co | 27 137 | 0,25 | 2 322 | 9,17 | ||||
| 2026-02-17 | 13F | Ancora Advisors, LLC | 1 445 | 20,42 | 124 | 30,85 | ||||
| 2026-02-17 | 13F | Sherbrooke Park Advisers Llc | 0 | -100,00 | 0 | |||||
| 2026-01-22 | 13F | Financial Consulate, Inc | 5 | -54,55 | 0 | |||||
| 2026-02-04 | 13F | Catalyst Financial Partners Llc | 6 471 | 1,33 | 554 | 10,38 | ||||
| 2026-02-04 | 13F | Mascoma Wealth Management LLC | 15 | 1 | ||||||
| 2026-01-28 | 13F | United Asset Strategies, Inc. | 129 932 | 2,52 | 11 116 | 11,67 | ||||
| 2026-04-08 | 13F | Wealth Science Advisors LLC | 2 462 | 0,00 | 211 | 0,00 | ||||
| 2026-02-10 | 13F | Godfrey Financial Associates, Inc. | 32 | 3 | ||||||
| 2026-02-13 | 13F | Sumitomo Life Insurance Co | 9 382 | 1,11 | 803 | 10,16 | ||||
| 2025-11-14 | 13F | Viking Global Investors Lp | 0 | -100,00 | 0 | |||||
| 2025-10-31 | 13F | Barrett & Company, Inc. | 0 | -100,00 | 0 | |||||
| 2026-01-22 | 13F | Premier Path Wealth Partners, LLC | 5 461 | 2,98 | 467 | 12,26 | ||||
| 2026-02-13 | 13F | Baird Financial Group, Inc. | 46 223 | 17,83 | 3 954 | 28,38 | ||||
| 2026-01-22 | 13F | Argus Investors' Counsel, Inc. | 5 954 | 6,13 | 509 | 15,68 | ||||
| 2026-02-12 | 13F | Triumph Capital Management | 2 827 | 3,48 | 242 | 12,62 | ||||
| 2026-02-06 | 13F | Motco | 420 | 0,00 | 36 | 9,38 | ||||
| 2026-02-19 | 13F | CI Private Wealth, LLC | 330 137 | 43,15 | 22 912 | 28,55 | ||||
| 2026-01-23 | 13F | Legacy Bridge, LLC | 99 | 8 | ||||||
| 2026-01-26 | 13F | Childress Capital Advisors, Llc | 5 955 | 28,06 | 509 | 39,45 | ||||
| 2026-01-15 | 13F | Fifth Third Wealth Advisors LLC | 19 361 | -9,28 | 1 656 | -1,19 | ||||
| 2026-02-13 | 13F | Soros Fund Management Llc | 186 001 | 15 912 | ||||||
| 2026-02-12 | 13F | UniSuper Management Pty Ltd | 51 633 | -9,47 | 4 417 | -1,38 | ||||
| 2026-02-13 | 13F | Healthcare Of Ontario Pension Plan Trust Fund | 136 330 | 11,81 | 11 663 | 21,79 | ||||
| 2026-02-13 | 13F | Virtus ETF Advisers LLC | 175 | 15 | ||||||
| 2026-02-10 | 13F | Peapack Gladstone Financial Corp | 17 371 | -6,41 | 1 | 0,00 | ||||
| 2026-02-10 | 13F | Kentucky Retirement Systems | 36 174 | 0,00 | 3 095 | 8,91 | ||||
| 2026-02-12 | 13F | Lansforsakringar Fondforvaltning AB (publ) | 178 416 | -2,32 | 15 263 | 6,40 | ||||
| 2026-02-12 | 13F | Empirical Finance, LLC | 24 376 | -4,46 | 2 085 | 4,09 | ||||
| 2026-02-17 | 13F | Cresset Asset Management, LLC | 123 296 | 5,57 | 10 548 | 14,98 | ||||
| 2026-02-11 | 13F | LPL Financial LLC | 517 509 | -12,23 | 44 273 | -4,40 | ||||
| 2026-02-17 | 13F | Vinva Investment Management Ltd | 292 445 | 527,09 | 25 188 | 593,50 | ||||
| 2026-02-19 | 13F | Mcguire Capital Advisors Inc | 336 | 29 | ||||||
| 2026-02-06 | 13F | Resona Asset Management Co.,Ltd. | 167 256 | -6,59 | 14 336 | 2,07 | ||||
| 2026-02-12 | 13F | Hrt Financial Lp | 33 980 | 3 | ||||||
| 2026-04-08 | 13F | Mma Asset Management Llc | 4 507 | 11,98 | 339 | -1,45 | ||||
| 2026-02-11 | 13F | SOUTH STATE Corp | 240 | 11,63 | 21 | 25,00 | ||||
| 2025-11-12 | 13F | Westfield Capital Management Co Lp | 0 | -100,00 | 0 | |||||
| 2026-02-17 | 13F | ExodusPoint Capital Management, LP | 0 | -100,00 | 0 | -100,00 | ||||
| 2026-02-13 | 13F | L2 Asset Management, LLC | 2 783 | 3,19 | 238 | 12,80 | ||||
| 2025-11-05 | 13F | AdvisorShares Investments LLC | 0 | -100,00 | 0 | -100,00 | ||||
| 2026-04-03 | 13F | Investors Research Corp | 1 000 | 0,00 | 75 | -11,76 | ||||
| 2026-02-12 | 13F | Xponance, Inc. | 114 922 | 6,28 | 9 832 | 15,77 | ||||
| 2026-02-13 | 13F | Greenline Wealth Management LLC | 21 | 2 | ||||||
| 2026-02-17 | 13F | Jones Financial Companies Lllp | 20 628 | 10,44 | 1 765 | 21,07 | ||||
| 2026-02-17 | 13F | Freestone Grove Partners LP | 22 451 | 1 921 | ||||||
| 2026-02-04 | 13F | Asahi Life Asset Management Co., Ltd. | 5 480 | 469 | ||||||
| 2026-02-09 | 13F | Knights of Columbus Asset Advisors LLC | 114 741 | -4,87 | 9 816 | 3,62 | ||||
| 2026-01-14 | 13F | Mitchell & Pahl Private Wealth, Llc | 7 145 | -0,01 | 611 | 8,91 | ||||
| 2026-02-10 | 13F | Commonwealth Of Pennsylvania Public School Empls Retrmt Sys | 125 508 | -5,66 | 10 737 | 2,77 | ||||
| 2026-02-17 | 13F | State Of Wisconsin Investment Board | 296 607 | -29,72 | 25 375 | -23,45 | ||||
| 2026-02-05 | 13F | Atria Investments Llc | 51 909 | -5,06 | 4 441 | 3,40 | ||||
| 2026-02-12 | 13F | Principal Securities, Inc. | 10 373 | -16,68 | 887 | -9,21 | ||||
| 2026-02-13 | 13F | American Century Companies Inc | 1 204 488 | 10,17 | 103 044 | 20,01 | ||||
| 2026-01-20 | 13F | Perpetual Ltd | 715 870 | 60,41 | 61 243 | 74,73 | ||||
| 2026-02-17 | 13F | Integrated Advisors Network LLC | 13 666 | 7,41 | 1 169 | 17,02 | ||||
| 2026-02-05 | 13F | iA Global Asset Management Inc. | 51 016 | 4,11 | 4 | 33,33 | ||||
| 2026-02-09 | 13F | Arista Wealth Management, LLC | 7 532 | 0,00 | 644 | 8,97 | ||||
| 2026-01-21 | 13F | Cidel Asset Management Inc | 8 957 | 2,82 | 766 | 11,99 | ||||
| 2026-02-13 | 13F | Pathstone Holdings, LLC | 110 795 | 19,84 | 9 479 | 30,53 | ||||
| 2025-11-20 | 13F | First Affirmative Financial Network | 0 | -100,00 | 0 | |||||
| 2026-02-10 | 13F | Rothschild Investment Llc | 129 950 | -2,06 | 11 117 | 6,68 | ||||
| 2026-02-17 | 13F | Schonfeld Strategic Advisors LLC | 73 810 | 520,36 | 6 314 | 576,02 | ||||
| 2025-10-30 | 13F | Traub Capital Management LLC | 0 | -100,00 | 0 | |||||
| 2026-02-13 | 13F | Minot DeBlois Advisors LLC | 50 | 0,00 | 4 | 33,33 | ||||
| 2026-02-13 | 13F | Schroder Investment Management Group | 296 850 | -2,63 | 25 568 | 7,66 | ||||
| 2026-01-14 | 13F | Pallas Capital Advisors LLC | 16 451 | -15,99 | 1 407 | -8,46 | ||||
| 2026-02-13 | 13F | Corps Capital Advisors, LLC | 7 238 | 619 | ||||||
| 2026-02-06 | 13F | Lsv Asset Management | 3 990 872 | 2,26 | 341 | 11,44 | ||||
| 2026-02-06 | 13F | Redmont Wealth Advisors Llc | 75 | 0,00 | 6 | 20,00 | ||||
| 2026-01-21 | 13F | Sound Income Strategies, LLC | 159 | 205,77 | 12 | 175,00 | ||||
| 2026-02-14 | 13F | Berkshire Asset Management Llc/pa | 0 | -100,00 | 0 | |||||
| 2026-02-12 | 13F | Andra AP-fonden | 0 | -100,00 | 0 | |||||
| 2026-02-09 | 13F | Syverson Strege & Co | 3 325 | -1,74 | 284 | 7,17 | ||||
| 2026-03-04 | 13F | SHP Wealth Management | 402 | 34 | ||||||
| 2026-02-13 | 13F | Ostrum Asset Management | 12 011 | -24,88 | 1 028 | -18,17 | ||||
| 2026-01-21 | 13F | Flagship Harbor Advisors, Llc | 2 416 | 207 | ||||||
| 2026-04-07 | 13F | CoreCap Advisors, LLC | 479 | -2,04 | 36 | -12,20 | ||||
| 2026-02-17 | 13F | Bank Of America Corp /de/ | Put | 0 | -100,00 | 0 | ||||
| 2026-01-27 | 13F | Bayforest Capital Ltd | 1 928 | -25,87 | 165 | -19,61 | ||||
| 2026-01-14 | 13F | Verum Partners LLC | 3 145 | 0,32 | 269 | 9,35 | ||||
| 2026-02-17 | 13F | Clear Street Markets Llc | 802 | -15,93 | 69 | -8,11 | ||||
| 2026-01-26 | 13F | JNBA Financial Advisors | 44 | 4 | ||||||
| 2026-04-07 | 13F | Abner Herrman & Brock Llc | 166 738 | 0,98 | 13 | -14,29 | ||||
| 2026-02-06 | 13F | Paradigm Capital Management, LLC/NV | 5 268 | 0,00 | 0 | |||||
| 2026-02-17 | 13F | California State Teachers Retirement System | 987 656 | -7,50 | 84 494 | 0,75 | ||||
| 2026-01-14 | 13F | Jfs Wealth Advisors, Llc | 962 | 10,32 | 82 | 20,59 | ||||
| 2026-02-04 | 13F | LRI Investments, LLC | 3 764 | -10,08 | 322 | -1,83 | ||||
| 2026-01-29 | 13F | Vanguard Group Inc | 67 783 183 | -1,02 | 5 798 851 | 7,81 | ||||
| 2026-02-10 | 13F | Envestnet Asset Management Inc | 989 164 | -14,61 | 84 623 | -6,99 | ||||
| 2026-02-11 | 13F | Fjarde Ap-fonden /fourth Swedish National Pension Fund | 95 437 | 8 165 | ||||||
| 2026-02-17 | 13F | Creative Planning | 81 004 | -16,23 | 6 930 | -8,76 | ||||
| 2025-11-14 | 13F | Sofos Investments, Inc. | 0 | 0 | ||||||
| 2026-02-17 | 13F | Private Advisor Group, LLC | 24 303 | -3,72 | 2 079 | 4,89 | ||||
| 2026-02-05 | 13F | Northwestern Mutual Investment Management Company, Llc | 17 240 | -2,36 | 1 475 | 6,35 | ||||
| 2026-02-06 | 13F | EverSource Wealth Advisors, LLC | 4 566 | -9,28 | 391 | -1,27 | ||||
| 2026-01-29 | 13F | Nbc Securities, Inc. | 319 | -40,15 | 27 | -34,15 | ||||
| 2026-02-13 | 13F | Dai-Ichi Life Insurance Company, Ltd | 21 285 | 0,00 | 1 821 | 8,92 | ||||
| 2026-02-17 | 13F | Janus Henderson Group Plc | 73 841 | 1,44 | 6 320 | 10,53 | ||||
| 2025-10-16 | 13F | Sheets Smith Wealth Management | 0 | -100,00 | 0 | -100,00 | ||||
| 2026-01-16 | 13F | Piscataqua Savings Bank | 322 | 0,00 | 28 | 8,00 | ||||
| 2026-01-30 | 13F | State of New Jersey Common Pension Fund D | 182 982 | -3,14 | 15 654 | 5,51 | ||||
| 2026-02-17 | 13F | SummitTX Capital, L.P. | 10 911 | 15,12 | 933 | 25,40 | ||||
| 2026-01-09 | 13F | Pacifica Partners Inc. | 0 | -100,00 | 0 | |||||
| 2026-02-17 | 13F | Sagewood Asset Management LP | 3 214 | 275 | ||||||
| 2026-01-06 | 13F | Ransom Advisory, Ltd | 200 | 0,00 | 17 | 13,33 | ||||
| 2026-01-27 | 13F | First Horizon Corp | 1 260 | -19,59 | 108 | -13,01 | ||||
| 2025-11-14 | 13F | Point72 (DIFC) Ltd | Call | 100 | -66,67 | 8 | -72,00 | |||
| 2026-02-13 | 13F | Williams Jones Wealth Management, LLC. | 7 536 | 1,34 | 645 | 10,27 | ||||
| 2026-02-11 | 13F | West Family Investments, Inc. | 0 | -100,00 | 0 | -100,00 | ||||
| 2025-11-13 | 13F | GeoWealth Management, LLC | 0 | -100,00 | 0 | |||||
| 2026-01-16 | 13F | CRA Financial Services, LLC | 5 033 | -0,26 | 431 | 8,59 | ||||
| 2026-02-17 | 13F | Point72 Asset Management, L.P. | Put | 107 400 | -46,19 | 9 188 | -41,39 | |||
| 2026-02-13 | 13F | Integrated Wealth Concepts LLC | 3 454 | -51,07 | 296 | -46,75 | ||||
| 2026-02-10 | 13F | Ellevest, Inc. | 3 560 | -3,13 | 305 | 5,56 | ||||
| 2026-02-10 | 13F | Core Wealth Advisors, Llc | 27 | 2 | ||||||
| 2026-02-17 | 13F | Point72 Asset Management, L.P. | Call | 74 000 | -53,63 | 6 331 | -49,50 | |||
| 2026-02-11 | 13F | Jpmorgan Chase & Co | 1 405 083 | -9,14 | 120 205 | -1,04 | ||||
| 2026-02-11 | 13F | Jpmorgan Chase & Co | Call | 711 500 | 35,60 | 60 869 | 47,71 | |||
| 2026-02-11 | 13F | Jpmorgan Chase & Co | Put | 827 000 | 2,26 | 70 750 | 11,39 | |||
| 2026-02-17 | 13F | Raymond James Financial Inc | 2 890 298 | -11,76 | 247 265 | -3,88 | ||||
| 2026-02-12 | 13F | Wedbush Securities Inc | 5 230 | -30,87 | 0 | |||||
| 2026-04-06 | 13F | CX Institutional | 6 252 | -11,68 | 0 | |||||
| 2026-02-13 | 13F | Resources Investment Advisors, LLC. | 4 718 | 13,63 | 404 | 23,62 | ||||
| 2026-02-10 | 13F | Td Asset Management Inc | 357 707 | -14,96 | 30 602 | -7,37 | ||||
| 2026-02-13 | 13F | MAI Capital Management | 14 066 | 5,50 | 1 203 | 14,90 | ||||
| 2026-02-13 | 13F | Citigroup Inc | 891 395 | 2,87 | 76 259 | 12,05 | ||||
| 2026-02-13 | 13F | Citigroup Inc | Call | 250 000 | 66,67 | 21 388 | 81,54 | |||
| 2026-01-09 | 13F | Silverlake Wealth Management Llc | 6 206 | 0,49 | 531 | 9,28 | ||||
| 2026-02-02 | 13F | Oppenheimer & Co Inc | 0 | -100,00 | 0 | |||||
| 2026-02-13 | 13F | Citigroup Inc | Put | 232 500 | 0,00 | 19 890 | 8,93 | |||
| 2026-01-08 | 13F | Maridea Wealth Management LLC | 0 | -100,00 | 0 | |||||
| 2026-02-13 | 13F | Zuckerman Investment Group, LLC | 2 500 | 214 | ||||||
| 2026-02-17 | 13F | Quantitative Investment Management, LLC | 25 642 | 2 | ||||||
| 2026-03-02 | 13F | Bank Of Hawaii | 16 041 | 2,68 | 1 372 | 11,82 | ||||
| 2026-01-21 | 13F | Y.D. More Investments Ltd | 389 | -15,98 | 33 | -8,33 | ||||
| 2026-03-06 | 13F | Hsbc Holdings Plc | 1 481 688 | -19,75 | 126 952 | -12,22 | ||||
| 2026-01-30 | 13F | Citizens Financial Group Inc/ri | 8 382 | -10,63 | 717 | -2,58 | ||||
| 2026-04-07 | 13F | Retirement Wealth Solutions LLC | 23 | -30,30 | 2 | -50,00 | ||||
| 2026-02-13 | 13F | Cetera Trust Company, N.A | 17 329 | 11,20 | 1 482 | 21,18 | ||||
| 2026-02-13 | 13F | Seneschal Advisors, LLC | 8 | 0,00 | 1 | |||||
| 2026-01-16 | 13F | Standard Life Aberdeen plc | 432 046 | 0,82 | 36 962 | 10,72 | ||||
| 2026-02-12 | 13F | BlackRock, Inc. | 48 707 016 | 4,24 | 4 166 885 | 13,54 | ||||
| 2026-01-27 | 13F | Cannon Global Investment Management, LLC | 6 500 | 556 | ||||||
| 2026-01-20 | 13F | Steel Peak Wealth Management LLC | 23 004 | 44,28 | 1 968 | 57,11 | ||||
| 2026-02-13 | 13F | Meixler Investment Management, Ltd. | 7 897 | -7,96 | 676 | 0,30 | ||||
| 2025-11-05 | 13F | Thompson Davis & Co., Inc. | 0 | -100,00 | 0 | -100,00 | ||||
| 2026-01-20 | 13F | American National Bank | 6 | 0,00 | 1 | |||||
| 2026-02-05 | 13F | Center for Financial Planning, Inc. | 300 | 0,00 | 26 | 8,70 | ||||
| 2026-02-12 | 13F | JPL Wealth Management, LLC | 0 | -100,00 | 0 | -100,00 | ||||
| 2025-11-14 | 13F | Scientech Research LLC | 0 | -100,00 | 0 | -100,00 | ||||
| 2025-12-09 | 13F/A | Tudor Investment Corp Et Al | 0 | -100,00 | 0 | -100,00 | ||||
| 2026-02-03 | 13F | SBI Securities Co., Ltd. | 2 628 | 4,29 | 225 | 13,71 | ||||
| 2025-11-13 | 13F | Inceptionr Llc | 0 | -100,00 | 0 | -100,00 | ||||
| 2026-02-14 | 13F | Frec Markets, Inc. | 3 943 | 337 | ||||||
| 2026-02-13 | 13F | Brown Advisory Inc | 1 430 478 | -11,85 | 122 377 | -3,99 | ||||
| 2026-01-13 | 13F | Mather Group, Llc. | 11 278 | 1,48 | 965 | 10,55 | ||||
| 2026-01-14 | 13F | Wolff Wiese Magana Llc | 65 | 0,00 | 6 | 0,00 | ||||
| 2026-02-02 | 13F | Artemis Investment Management LLP | 79 469 | 6 799 | ||||||
| 2026-02-17 | 13F | Aquatic Capital Management LLC | 0 | -100,00 | 0 | |||||
| 2026-02-17 | 13F | Engineers Gate Manager LP | 0 | -100,00 | 0 | -100,00 | ||||
| 2026-02-12 | 13F | Mount Yale Investment Advisors, LLC | 12 656 | 88,17 | 1 083 | 104,92 | ||||
| 2026-02-12 | 13F | Colonial Trust Co / SC | 114 | -30,49 | 10 | -25,00 | ||||
| 2025-11-14 | 13F | Clough Capital Partners L P | 0 | -100,00 | 0 | |||||
| 2026-04-07 | 13F | U.S. Capital Wealth Advisors, LLC | 7 997 | 7,08 | 602 | -5,80 | ||||
| 2026-04-08 | 13F | Arlington Trust Co LLC | 137 | 24,55 | 10 | 11,11 | ||||
| 2025-11-14 | 13F | Fayez Sarofim & Co | 0 | -100,00 | 0 | |||||
| 2026-02-02 | 13F | McHugh Group, LLC | 2 500 | 214 | ||||||
| 2026-02-17 | 13F | Laird Norton Trust Company, Llc | 13 572 | 1 161 | ||||||
| 2026-01-23 | 13F | Rsm Us Wealth Management Llc | 24 708 | 1,48 | 2 128 | 11,30 | ||||
| 2026-01-26 | 13F | Private Trust Co Na | 3 851 | -0,59 | 329 | 8,22 | ||||
| 2026-01-28 | 13F | Chicago Partners Investment Group LLC | 3 328 | -41,86 | 241 | -46,43 | ||||
| 2026-02-17 | 13F | Advanced Portfolio Management, LLC | 0 | -100,00 | 0 | |||||
| 2026-02-10 | 13F | Mutual Of America Capital Management Llc | 57 941 | -3,52 | 4 957 | 5,09 | ||||
| 2026-02-17 | 13F | Kemnay Advisory Services Inc. | 214 | 18 | ||||||
| 2026-02-17 | 13F | Price T Rowe Associates Inc /md/ | 16 371 853 | 39,80 | 1 401 | 52,34 | ||||
| 2026-02-13 | 13F | Ossiam | 5 004 | -53,22 | 428 | -49,05 | ||||
| 2026-02-11 | 13F | Erste Asset Management GmbH | 5 375 | 465 | ||||||
| 2026-01-23 | 13F | Sage Mountain Advisors LLC | 7 729 | 6,56 | 661 | 16,17 | ||||
| 2026-02-12 | 13F | Saiph Capital, LLC | 0 | -100,00 | 0 | |||||
| 2026-02-10 | 13F/A | Northwestern Mutual Wealth Management Co | 73 396 | 44,45 | 6 279 | 57,37 | ||||
| 2026-01-21 | 13F | Portside Wealth Group, LLC | 15 998 | 2,95 | 1 369 | 12,13 | ||||
| 2026-02-02 | 13F | Ashton Thomas Securities, Llc | 9 890 | 0,17 | 846 | 9,16 | ||||
| 2026-01-16 | 13F | First Pacific Financial | 0 | -100,00 | 0 | |||||
| 2025-11-14 | 13F | PineBridge Investments, L.P. | 3 286 | 258 | ||||||
| 2026-02-17 | 13F | Toms Capital Investment Management Lp | Call | 2 500 000 | 213 875 | |||||
| 2026-02-12 | 13F | APG Asset Management N.V. | 283 588 | -30,04 | 20 657 | -23,76 | ||||
| 2026-02-04 | 13F | Valeo Financial Advisors, LLC | 13 375 | 6,99 | 1 144 | 16,62 | ||||
| 2026-02-13 | 13F | Diametric Capital, LP | 0 | -100,00 | 0 | |||||
| 2026-01-29 | 13F | Inscription Capital, LLC | 4 802 | -1,44 | 411 | 7,33 | ||||
| 2026-02-17 | 13F | Gillson Capital LP | 226 900 | 0 | ||||||
| 2026-02-17 | 13F | Utah Retirement Systems | 94 010 | -1,15 | 8 043 | 7,67 | ||||
| 2026-02-02 | 13F | Varma Mutual Pension Insurance Co | 141 330 | 0,00 | 12 091 | 8,92 | ||||
| 2026-01-27 | 13F | Forum Financial Management, LP | 12 287 | -0,34 | 1 051 | 8,57 | ||||
| 2026-02-24 | 13F | SG Trading Solutions, LLC | 2 485 | 0 | ||||||
| 2026-01-27 | 13F | MASTERINVEST Kapitalanlage GmbH | 2 655 | 0,00 | 229 | 9,62 | ||||
| 2026-02-11 | 13F | Tiaa Trust, National Association | 6 033 | -5,56 | 516 | 2,99 | ||||
| 2026-01-26 | 13F | Consilium Wealth Advisory, LLC | 3 638 | 0,00 | 311 | 9,12 | ||||
| 2026-01-23 | 13F | Optima Capital Llc | 22 | 2 | ||||||
| 2026-02-13 | 13F | Chevy Chase Trust Holdings, Inc. | 273 898 | -3,15 | 23 432 | 5,49 | ||||
| 2026-01-23 | 13F | Transcend Wealth Collective, Llc | 2 729 | -36,65 | 233 | -31,07 | ||||
| 2026-02-13 | 13F | Victory Capital Management Inc | 1 348 574 | 4,13 | 115 371 | 13,43 | ||||
| 2026-02-13 | 13F | Blueshift Asset Management, LLC | 0 | -100,00 | 0 | |||||
| 2026-01-21 | 13F | Signature Resources Capital Management, LLC | 95 | 0,00 | 8 | 14,29 | ||||
| 2026-02-13 | 13F | Kayne Anderson Rudnick Investment Management Llc | 157 | 1,95 | 13 | 8,33 | ||||
| 2026-01-23 | 13F | Patton Fund Management, Inc. | 2 906 | 7,19 | 249 | 16,98 | ||||
| 2026-02-06 | 13F | Americana Partners, LLC | 6 859 | -49,97 | 587 | -45,54 | ||||
| 2026-01-15 | 13F | Birch Financial Group, Llc | 6 944 | 594 | ||||||
| 2026-02-02 | 13F | New England Capital Financial Advisors LLC | 302 | 0,00 | 26 | 8,70 | ||||
| 2026-02-09 | 13F | Kestra Investment Management, LLC | 3 287 | -6,67 | 281 | 1,81 | ||||
| 2026-02-10 | 13F | Murphy & Mullick Capital Management Corp | 9 | 28,57 | 1 | |||||
| 2026-04-08 | 13F | Miracle Mile Advisors, LLC | 7 430 | -8,20 | 559 | -19,22 | ||||
| 2026-02-09 | 13F | Murphy Pohlad Asset Management LLC | 52 152 | 0,00 | 4 462 | 8,91 | ||||
| 2026-02-02 | 13F | Oppenheimer Asset Management Inc. | 0 | -100,00 | 0 | |||||
| 2026-02-09 | 13F | Alta Advisers Ltd | 0 | -100,00 | 0 | -100,00 | ||||
| 2026-04-08 | 13F | Community Financial Services Group, LLC | 429 | 32 | ||||||
| 2026-02-12 | 13F | Great Valley Advisor Group, Inc. | 3 934 | -13,12 | 337 | -5,35 | ||||
| 2026-02-17 | 13F | BTG Pactual Asset Management US LLC | 3 126 | 267 | ||||||
| 2026-03-16 | 13F | Bank of New Hampshire | 125 | 0,00 | 11 | 11,11 | ||||
| 2026-02-17 | 13F | SageView Advisory Group, LLC | 8 454 | -10,24 | 723 | -2,17 | ||||
| 2026-01-26 | 13F | Townsend & Associates, Inc | 401 885 | 1,90 | 29 752 | -2,49 | ||||
| 2026-02-13 | 13F | Charles Schwab Investment Management Inc | 4 130 936 | -0,31 | 353 402 | 8,59 | ||||
| 2026-02-17 | 13F | Blair William & Co/il | 17 115 | -0,91 | 1 464 | 7,96 | ||||
| 2026-04-09 | 13F | Generali Investments, Management Co LLC | 6 628 | -34,02 | 499 | -42,03 | ||||
| 2026-01-12 | 13F | Abound Wealth Management | 120 | -22,08 | 10 | -16,67 | ||||
| 2026-02-03 | 13F | Farmers & Merchants Investments Inc | 457 | -4,19 | 39 | 5,41 | ||||
| 2025-11-04 | 13F | ASB Consultores, LLC | 0 | -100,00 | 0 | -100,00 | ||||
| 2026-02-03 | 13F | Luken Investment Analytics, LLC | 107 | 9 | ||||||
| 2026-01-28 | 13F | DekaBank Deutsche Girozentrale | 144 616 | 0,00 | 12 | 9,09 | ||||
| 2026-02-13 | 13F | Rhumbline Advisers | 992 476 | -4,71 | 84 906 | 3,79 | ||||
| 2026-01-23 | 13F | Inlight Wealth Management, LLC | 35 | 0,00 | 3 | 0,00 | ||||
| 2026-01-23 | 13F | Halbert Hargrove Global Advisors, Llc | 0 | -100,00 | 0 | |||||
| 2026-01-30 | 13F | Interchange Capital Partners, LLC | 3 694 | 2,21 | 316 | 10,92 | ||||
| 2026-02-02 | 13F | Principal Financial Group Inc | 593 497 | -1,57 | 50 774 | 7,22 | ||||
| 2026-02-06 | 13F | Pnc Financial Services Group, Inc. | 206 986 | 5,19 | 17 708 | 14,58 | ||||
| 2026-02-09 | 13F | Atlantic Trust, LLC | 68 | -43,80 | 6 | -44,44 | ||||
| 2026-02-12 | 13F | Skandinaviska Enskilda Banken AB (publ) | 119 859 | 1,90 | 10 254 | 10,99 | ||||
| 2025-11-14 | 13F | Texas Permanent School Fund | 0 | -100,00 | 0 | |||||
| 2026-02-13 | 13F | Walleye Capital LLC | Call | 38 800 | 145,57 | 3 319 | 167,66 | |||
| 2026-04-08 | 13F | Sapient Capital Llc | 3 657 | 275 | ||||||
| 2026-02-10 | 13F | Natixis Advisors, L.p. | 726 817 | -0,68 | 62 | 8,77 | ||||
| 2026-02-13 | 13F | Walleye Capital LLC | Put | 55 900 | 55,28 | 4 782 | 69,15 | |||
| 2026-02-13 | 13F | Walleye Capital LLC | 43 060 | 3 684 | ||||||
| 2026-01-15 | 13F | Mn Services Vermogensbeheer B.V. | 223 764 | 1,34 | 19 | 11,76 | ||||
| 2025-11-14 | 13F | Point72 Asia (Singapore) Pte. Ltd. | 0 | -100,00 | 0 | |||||
| 2026-01-16 | 13F | Louisiana State Employees Retirement System | 27 600 | -5,15 | 2 361 | 3,33 | ||||
| 2026-01-21 | 13F | Newbridge Financial Services Group, Inc. | 283 | -19,37 | 24 | -11,11 | ||||
| 2026-02-02 | 13F | Cornerstone Planning Group LLC | 67 | -35,58 | 5 | -50,00 | ||||
| 2026-02-17 | 13F | FIL Ltd | 35 814 | -65,43 | 3 064 | -62,36 | ||||
| 2026-02-09 | 13F | Hantz Financial Services, Inc. | 197 771 | -5,72 | 17 | 0,00 | ||||
| 2025-11-07 | 13F | Beacon Capital Management, LLC | 0 | -100,00 | 0 | |||||
| 2026-02-13 | 13F | Motiv8 Investments LLC | 117 | 0 | ||||||
| 2026-02-11 | 13F | Sunrise Financial Services, LLC | 31 | 3 | ||||||
| 2025-10-15 | 13F | Hanson & Doremus Investment Management | 0 | -100,00 | 0 | |||||
| 2026-01-12 | 13F | Salem Investment Counselors Inc | 0 | -100,00 | 0 | |||||
| 2026-02-17 | 13F | Two Sigma Advisers, Lp | 0 | -100,00 | 0 | |||||
| 2025-11-14 | 13F | AXA Investment Managers S.A. | 11 131 | 874 | ||||||
| 2026-02-17 | 13F | LMR Partners LLP | 0 | -100,00 | 0 | |||||
| 2025-11-10 | 13F | Bowen Hanes & Co Inc | 0 | -100,00 | 0 | |||||
| 2026-02-05 | 13F | AustralianSuper Pty Ltd | 1 115 734 | 14,79 | 95 451 | 25,03 | ||||
| 2026-01-22 | 13F | Personal Cfo Solutions, Llc | 9 082 | 11,55 | 777 | 21,44 | ||||
| 2025-10-30 | 13F | Ridgewood Investments LLC | 0 | -100,00 | 0 | -100,00 | ||||
| 2026-02-28 | 13F | Corecam Pte. Ltd. | 0 | -100,00 | 0 | |||||
| 2026-02-03 | 13F | American Assets Investment Management, LLC | 50 000 | 0,00 | 4 278 | 8,91 | ||||
| 2026-02-13 | 13F | Neo Ivy Capital Management | 20 396 | 1 745 | ||||||
| 2026-02-11 | 13F | Simplex Trading, Llc | Put | 116 900 | 33,14 | 10 001 | 166 566,67 | |||
| 2026-02-11 | 13F | Simplex Trading, Llc | Call | 155 900 | 20,29 | 13 337 | 133 270,00 | |||
| 2025-11-10 | 13F | Verus Capital Partners, Llc | 0 | -100,00 | 0 | -100,00 | ||||
| 2026-02-06 | 13F | Diamond Hill Capital Management Inc | 10 817 462 | -10,68 | 925 434 | -2,71 | ||||
| 2026-02-12 | 13F | New York State Common Retirement Fund | 695 971 | -29,63 | 59 540 | -23,35 | ||||
| 2026-02-03 | 13F | Ethic Inc. | 107 973 | -5,30 | 9 237 | 3,16 | ||||
| 2026-01-23 | 13F | BSW Wealth Partners | 4 357 | 1,63 | 373 | 10,71 | ||||
| 2026-01-28 | 13F | Salomon & Ludwin, LLC | 35 | -75,18 | 3 | -81,82 | ||||
| 2026-02-04 | 13F | Clark Wealth Partners | 27 | 0,00 | 2 | 0,00 | ||||
| 2026-02-13 | 13F | Pine Valley Investments Ltd Liability Co | 0 | -100,00 | 0 | |||||
| 2026-01-13 | 13F | Sendero Wealth Management, LLC | 37 417 | -2,46 | 3 201 | 6,27 | ||||
| 2025-11-12 | 13F | Park Square Financial Group, LLC | 0 | -100,00 | 0 | -100,00 | ||||
| 2026-01-13 | 13F | Signal Advisors Wealth, LLC | 4 695 | -38,91 | 402 | -33,50 | ||||
| 2026-01-16 | 13F | Crewe Advisors LLC | 1 010 | 3,80 | 86 | 13,16 | ||||
| 2026-02-12 | 13F | Keel Point, LLC | 6 899 | -3,91 | 590 | 4,80 | ||||
| 2026-02-17 | 13F | Two Sigma Securities, Llc | 0 | -100,00 | 0 | |||||
| 2026-02-17 | 13F | Fmr Llc | 2 898 861 | 10,52 | 247 998 | 20,39 | ||||
| 2025-11-14 | 13F | Blue Capital, Inc. | 0 | -100,00 | 0 | -100,00 | ||||
| 2026-01-16 | 13F | PFS Partners, LLC | Put | 650 | -25,20 | |||||
| 2026-02-13 | 13F | Umb Bank N A/mo | 2 246 | 1,17 | 192 | 10,34 | ||||
| 2026-01-14 | 13F | Goelzer Investment Management, Inc. | 21 290 | -0,55 | 1 821 | 8,33 | ||||
| 2026-02-05 | 13F | Elyxium Wealth, LLC | 6 973 | -11,14 | 596 | -3,25 | ||||
| 2026-02-17 | 13F | Russell Investments Group, Ltd. | 1 071 093 | -20,00 | 91 739 | -12,56 | ||||
| 2026-01-26 | 13F | Phillips Financial Management, Llc | 3 094 | 0,81 | 265 | 9,54 | ||||
| 2026-02-12 | 13F | Cibc World Markets Corp | 82 540 | 13,33 | 7 061 | 13,28 | ||||
| 2026-02-17 | 13F | Jain Global LLC | 685 948 | 58 683 | ||||||
| 2026-03-26 | 13F | Leonteq Securities AG | Call | 0 | -100,00 | 0 | -100,00 | |||
| 2026-02-17 | 13F | Nissay Asset Management Corp /japan/ /adv | 70 890 | -2,47 | 6 065 | 6,24 | ||||
| 2025-10-21 | 13F | Amplius Wealth Advisors, LLC | 0 | -100,00 | 0 | |||||
| 2026-02-17 | 13F | Cape Investment Advisory, Inc. | 179 | 171,21 | 15 | 200,00 | ||||
| 2026-02-13 | 13F | BNP Paribas Asset Management Holding S.A. | 228 979 | -57,68 | 20 | -54,76 | ||||
| 2026-02-17 | 13F | Polymer Capital Management (US) LLC | 3 315 | -52,48 | 284 | -48,26 | ||||
| 2026-01-16 | 13F | PFS Partners, LLC | 72 989 | 0,00 | 6 244 | 8,93 | ||||
| 2026-04-02 | 13F | NorthAvenue LLC | 4 | 0 | ||||||
| 2026-01-28 | 13F | Arizona State Retirement System | 155 983 | -7,32 | 13 344 | 0,95 | ||||
| 2026-02-13 | 13F | Cullen Capital Management, LLC | 494 273 | 42 285 | ||||||
| 2026-02-17 | 13F | Aster Capital Management (DIFC) Ltd | 0 | -100,00 | 0 | |||||
| 2026-02-13 | 13F | Alyeska Investment Group, L.P. | 427 239 | 36 550 | ||||||
| 2026-01-28 | 13F | Quent Long Short Global Small Cap Fund, LP | 3 888 | 333 | ||||||
| 2026-02-02 | 13F | One Wealth Advisors, LLC | 5 761 | 123,04 | 493 | 143,56 | ||||
| 2026-02-13 | 13F | Adams Diversified Equity Fund, Inc. | 255 000 | 2,74 | 21 815 | 11,91 | ||||
| 2026-03-12 | 13F/A | Peak6 Llc | Call | 56 500 | 337,98 | 4 834 | 377,10 | |||
| 2026-01-29 | 13F | Courier Capital Llc | 6 950 | -0,71 | 595 | 8,20 | ||||
| 2026-02-02 | 13F | Mutual Advisors, LLC | 2 349 | 201 | ||||||
| 2026-03-12 | 13F/A | Peak6 Llc | Put | 7 800 | 212,00 | 667 | 240,31 | |||
| 2026-01-26 | 13F | KBC Group NV | 324 942 | 5,98 | 28 | 12,50 | ||||
| 2026-02-17 | 13F | Css Llc/il | 5 940 | 508 | ||||||
| 2026-02-05 | 13F | 1st Source Bank | 3 300 | 0,00 | 282 | 8,88 | ||||
| 2026-02-17 | 13F | National Asset Management, Inc. | 4 519 | -22,22 | 387 | -15,35 | ||||
| 2026-02-11 | 13F | Winnow Wealth Llc | 25 | 0,00 | 2 | 100,00 | ||||
| 2026-02-12 | 13F | Commonwealth Equity Services, Llc | 309 448 | -0,22 | 26 473 | 110 204,17 | ||||
| 2026-02-18 | 13F | Strong Retirement Solutions LLC | 3 982 | 341 | ||||||
| 2026-01-22 | 13F | Venturi Wealth Management, LLC | 5 428 | 7,85 | 464 | 17,47 | ||||
| 2026-02-06 | 13F/A | Rathbone Brothers plc | 3 329 | -4,59 | 285 | 3,65 | ||||
| 2026-01-28 | 13F | Boston Trust Walden Corp | 2 500 | -28,57 | 214 | -22,26 | ||||
| 2026-02-03 | 13F | Ballentine Partners, LLC | 2 552 | -13,34 | 218 | -5,63 | ||||
| 2026-02-13 | 13F | Jacobs Levy Equity Management, Inc | 127 093 | -51,40 | 10 873 | -47,06 | ||||
| 2026-01-23 | 13F | Bridgewater Advisors Inc. | 6 048 | -15,23 | 435 | -20,22 | ||||
| 2026-02-13 | 13F | 17 Capital Partners, Llc | 14 975 | -0,13 | 1 281 | 8,84 | ||||
| 2026-02-10 | 13F | Catalyst Capital Advisors LLC | 0 | -100,00 | 0 | |||||
| 2026-02-10 | 13F | CIBC World Markets Inc. | 102 648 | 10,64 | 8 782 | 20,52 | ||||
| 2026-02-17 | 13F | Royal Bank Of Canada | 1 831 859 | -2,55 | 156 716 | 6,15 | ||||
| 2026-02-13 | 13F | Mariner, LLC | 83 040 | 0,08 | 7 107 | 9,05 | ||||
| 2026-01-29 | 13F | IMC-Chicago, LLC | 126 644 | 10 834 | ||||||
| 2026-01-29 | 13F | IMC-Chicago, LLC | Put | 107 000 | -12,30 | 9 154 | -4,47 | |||
| 2026-01-29 | 13F | IMC-Chicago, LLC | Call | 451 600 | 137,93 | 38 634 | 159,18 | |||
| 2026-02-17 | 13F | Optiver Holding B.V. | 3 038 | 260 | ||||||
| 2026-02-09 | 13F | Jefferies Financial Group Inc. | 16 983 | 1 453 | ||||||
| 2025-12-18 | 13F | Danica Pension, Livsforsikringsaktieselskab | 0 | -100,00 | 0 | |||||
| 2026-01-27 | 13F | Asset Management One Co., Ltd. | 235 524 | -7,25 | 20 365 | 2,11 | ||||
| 2025-10-20 | 13F | Weaver Capital Management LLC | 0 | -100,00 | 0 | |||||
| 2026-02-26 | 13F | Anchor Investment Management, LLC | 39 | 0,00 | 3 | 0,00 | ||||
| 2026-01-27 | 13F | Zurcher Kantonalbank (Zurich Cantonalbank) | 360 597 | -3,78 | 30 849 | 4,81 | ||||
| 2026-02-17 | 13F | Weiss Asset Management LP | 5 588 | 478 | ||||||
| 2026-02-10 | 13F | Bnp Paribas | 1 975 | 0,00 | 169 | 8,39 | ||||
| 2025-11-13 | 13F | Limestone Investment Advisors LP | Put | 0 | -100,00 | 0 | -100,00 | |||
| 2026-02-13 | 13F | Bank Of Nova Scotia | 85 448 | 23,17 | 7 310 | 34,18 | ||||
| 2026-02-12 | 13F | Great Lakes Advisors, Llc | 9 382 | 20,27 | 803 | 31,05 | ||||
| 2026-02-06 | 13F | Profund Advisors Llc | 5 614 | -23,26 | 480 | -16,38 | ||||
| 2026-02-04 | 13F | Plato Investment Management Ltd | 4 589 | 0,00 | 395 | 10,36 | ||||
| 2026-02-20 | 13F | Talisman Wealth Advisors LLC | 2 338 | -38,55 | 200 | -32,89 | ||||
| 2026-01-23 | 13F | Brown, Lisle/cummings, Inc. | 82 | 0,00 | 7 | 16,67 | ||||
| 2026-02-17 | 13F | Voleon Capital Management Lp | 0 | -100,00 | 0 | -100,00 | ||||
| 2025-11-13 | 13F | Texas Capital Bancshares Inc/tx | 13 | 1 | ||||||
| 2026-02-10 | 13F | Private Wealth Asset Management, LLC | 273 | 0,00 | 23 | 9,52 | ||||
| 2026-02-13 | 13F | Ubs Asset Management Americas Inc | 4 203 663 | -4,83 | 359 623 | 3,67 | ||||
| 2026-02-17 | 13F | Ameriflex Group, Inc. | 403 | -51,79 | 34 | -47,69 | ||||
| 2026-01-30 | 13F | New York State Teachers Retirement System | 427 700 | -5,36 | 37 | 2,86 | ||||
| 2025-11-13 | 13F | Invenio Wealth Partners Llc | 0 | -100,00 | 0 | |||||
| 2026-02-13 | 13F | Gts Securities Llc | 7 360 | 630 | ||||||
| 2026-01-29 | 13F | Kestra Private Wealth Services, Llc | 10 902 | 3,79 | 933 | 13,11 | ||||
| 2026-02-13 | 13F | Pin Oak Investment Advisors Inc | 336 | 0,00 | 0 | -100,00 | ||||
| 2026-02-12 | 13F | Connecticut Wealth Management, LLC | 0 | -100,00 | 0 | |||||
| 2026-01-22 | 13F | Massachusetts Financial Services Co /ma/ | 2 264 785 | -33,20 | 193 752 | -27,23 | ||||
| 2026-01-30 | 13F/A | M&t Bank Corp | 64 890 | 3,50 | 5 551 | 12,76 | ||||
| 2026-01-14 | 13F | Cypress Wealth Services, LLC | 14 833 | 1 269 | ||||||
| 2026-01-26 | 13F | Parcion Private Wealth LLC | 2 923 | -8,51 | 250 | 0,00 | ||||
| 2026-01-29 | 13F | Teachers Retirement System Of The State Of Kentucky | 350 682 | 9,35 | 30 | 20,00 | ||||
| 2026-02-05 | 13F | HighMark Wealth Management LLC | 166 | 16,90 | 14 | 27,27 | ||||
| 2026-02-09 | 13F | Fidelis Capital Partners, LLC | 3 440 | -0,26 | 294 | 8,89 | ||||
| 2026-02-13 | 13F | Change Path, LLC | 6 020 | 0,10 | 515 | 9,11 | ||||
| 2026-02-17 | 13F | Keebeck Alpha, LP | 0 | -100,00 | 0 | |||||
| 2026-02-12 | 13F | IFM Investors Pty Ltd | 115 852 | -5,47 | 10 | -99,91 | ||||
| 2026-02-11 | 13F | Franklin Resources Inc | 15 618 321 | 36,91 | 1 336 147 | 49,12 | ||||
| 2026-02-10 | 13F | CIBC Asset Management Inc | 134 763 | 55,41 | 11 529 | 69,28 | ||||
| 2026-03-04 | 13F/A | Pure Financial Advisors, Inc. | 3 001 | 257 | ||||||
| 2026-01-13 | 13F | Kathmere Capital Management, LLC | 9 372 | 5,24 | 802 | 14,59 | ||||
| 2026-02-13 | 13F | 1832 Asset Management L.P. | 22 814 | -12,45 | 1 952 | -4,64 | ||||
| 2026-01-20 | 13F | SOA Wealth Advisors, LLC. | 576 | 0,00 | 49 | 8,89 | ||||
| 2026-02-04 | 13F | Securian Asset Management, Inc | 14 672 | -45,16 | 1 255 | -40,27 | ||||
| 2026-01-29 | 13F | Pictet Asset Management Holding SA | 268 053 | -5,30 | 22 932 | 3,15 | ||||
| 2026-01-28 | 13F | Philo Smith Capital Corp | 319 500 | 0,00 | 27 333 | 8,93 | ||||
| 2026-02-05 | 13F | North Dakota State Investment Board | 19 780 | 1 692 | ||||||
| 2026-01-20 | 13F | Cigna Investments Inc /new | 5 353 | -4,90 | 0 | |||||
| 2026-02-17 | 13F | Guardian Wealth Advisors, Llc / Nc | 3 714 | 7,97 | 318 | 17,41 | ||||
| 2026-02-13 | 13F | PCM Encore, LLC | 5 619 | 481 | ||||||
| 2026-01-27 | 13F | Evergreen Capital Management Llc | 39 965 | -2,78 | 3 419 | 5,92 | ||||
| 2026-02-05 | 13F | Navalign, LLC | 333 | 29 | ||||||
| 2026-02-17 | 13F | XTX Topco Ltd | 0 | -100,00 | 0 | |||||
| 2026-03-06 | 13F | Hsbc Holdings Plc | Call | 0 | -100,00 | 0 | ||||
| 2026-02-11 | 13F | Havemeyer Place LP | 25 982 | 2 223 | ||||||
| 2026-03-06 | 13F | Hsbc Holdings Plc | Put | 0 | -100,00 | 0 | ||||
| 2026-04-07 | 13F | Eastern Bank | 15 | -34,78 | 1 | 0,00 | ||||
| 2026-02-17 | 13F | Caption Management, LLC | Put | 40 000 | 3 422 | |||||
| 2026-02-13 | 13F | Entropy Technologies, LP | 63 530 | 5 435 | ||||||
| 2025-12-01 | 13F | Groupama Asset Managment | 0 | -100,00 | 0 | -100,00 | ||||
| 2026-02-03 | 13F | Allegiance Financial Group Advisory Services LLC | 2 372 | -28,01 | 203 | -21,71 | ||||
| 2026-02-17 | 13F | Dark Forest Capital Management Lp | 0 | -100,00 | 0 | -100,00 | ||||
| 2026-01-23 | 13F | Gibbs Wealth Management | 8 891 | -4,92 | 671 | -8,72 | ||||
| 2026-02-10 | 13F | Bnp Paribas Arbitrage, Sa | Call | 6 226 | 3,66 | 53 263 | 12,91 | |||
| 2026-02-10 | 13F | Bnp Paribas Arbitrage, Sa | 974 848 | -4,15 | 83 398 | 4,41 | ||||
| 2026-02-10 | 13F | Bnp Paribas Arbitrage, Sa | Put | 12 802 | 79,00 | 109 521 | 94,98 | |||
| 2026-02-13 | 13F | Royal London Asset Management Ltd | 227 137 | -4,44 | 19 432 | 4,09 | ||||
| 2026-04-02 | 13F | Collective Family Office Llc | 0 | -100,00 | 0 | |||||
| 2026-02-09 | 13F | Cary Street Partners Financial Llc | 5 088 | 0,02 | 435 | 9,02 | ||||
| 2026-01-22 | 13F | Bartlett & Co. Wealth Management Llc | 7 190 | 0,00 | 615 | 9,04 | ||||
| 2026-02-13 | 13F | Arete Wealth Advisors, LLC | 3 736 | -9,30 | 0 | |||||
| 2026-02-13 | 13F | Wbi Investments, Inc. | 0 | -100,00 | 0 | |||||
| 2026-02-13 | 13F | Capula Management Ltd | Call | 1 300 | -94,98 | 111 | -94,54 | |||
| 2026-02-24 | 13F/A | Pacer Advisors, Inc. | 66 480 | 49,04 | 5 687 | 62,35 | ||||
| 2026-02-12 | 13F | Marex Group plc | 3 075 | -49,17 | 263 | -44,63 | ||||
| 2026-02-13 | 13F | Capula Management Ltd | 132 | -99,23 | 11 | -99,18 | ||||
| 2026-02-13 | 13F | Capula Management Ltd | Put | 1 000 | -96,09 | 86 | -95,77 | |||
| 2026-01-16 | 13F | Trust Co Of Vermont | 500 | -15,54 | 43 | -8,70 | ||||
| 2026-02-10 | 13F | a16z Perennial Management, L.P. | 3 124 | -2,47 | 267 | 6,37 | ||||
| 2026-02-02 | 13F | Sachetta, LLC | 389 | -7,16 | 33 | 3,13 | ||||
| 2026-02-23 | 13F | Phillip James Consulting Co. | 3 | 0 | ||||||
| 2026-02-11 | 13F | Deseret Mutual Benefit Administrators | 2 154 | 4,31 | 184 | 13,58 | ||||
| 2026-02-17 | 13F | Amundi | 1 592 744 | -20,00 | 136 259 | -17,57 | ||||
| 2026-01-22 | 13F | Red Tortoise LLC | 173 | 0,00 | 15 | 7,69 | ||||
| 2026-02-02 | 13F | Farmers & Merchants Trust Co of Chambersburg PA | 97 | 0,00 | 0 | |||||
| 2026-02-06 | 13F | Banque Cantonale Vaudoise | 3 809 | -24,92 | 326 | |||||
| 2026-02-11 | 13F | Barrow Hanley Mewhinney & Strauss Llc | 7 482 558 | 10,84 | 640 133 | 20,73 | ||||
| 2026-02-11 | 13F | GW&K Investment Management, LLC | 1 917 | 0 | ||||||
| 2026-01-16 | 13F | Marquette Asset Management, LLC | 0 | -100,00 | 0 | |||||
| 2026-01-21 | 13F | Aaron Wealth Advisors LLC | 16 619 | 5,78 | 1 422 | 15,25 | ||||
| 2026-02-13 | 13F | Sei Investments Co | 1 406 237 | 4,66 | 120 304 | 14,00 | ||||
| 2025-11-07 | 13F | Gsa Capital Partners Llp | 0 | -100,00 | 0 | |||||
| 2026-02-13 | 13F | Missouri Trust & Investment Co | 4 900 | 0,00 | 419 | 9,11 | ||||
| 2026-01-26 | 13F | Whittier Trust Co Of Nevada Inc | 1 227 | -24,63 | 96 | -27,48 | ||||
| 2026-02-17 | 13F | Canada Pension Plan Investment Board | 1 143 940 | 10,76 | 97 864 | 20,64 | ||||
| 2026-01-21 | 13F | Quilter Plc | 42 805 | -6,19 | 3 662 | 2,18 | ||||
| 2026-02-09 | 13F | Kingsview Wealth Management, LLC | 7 487 | -82,41 | 641 | -80,85 | ||||
| 2026-01-26 | 13F | Merit Financial Group, LLC | 27 642 | -7,68 | 2 365 | 0,55 | ||||
| 2025-10-22 | 13F | Compass Planning Associates Inc | 0 | -100,00 | 0 | -100,00 | ||||
| 2026-04-08 | 13F | Wealth Enhancement Trust Services, Inc. | 2 117 | 5,96 | 159 | -6,47 | ||||
| 2026-02-13 | 13F | Walleye Trading LLC | Put | 63 300 | 81,90 | 5 415 | 98,13 | |||
| 2026-02-11 | 13F | TT Capital Management LLC | 2 401 | 205 | ||||||
| 2026-01-27 | 13F | Bolthouse Investments, LLC | 11 820 | 0,00 | 1 011 | 8,94 | ||||
| 2026-02-13 | 13F | Walleye Trading LLC | Call | 64 400 | -57,38 | 5 509 | -53,58 | |||
| 2026-02-10 | 13F | 3Chopt Investment Partners, LLC | 3 819 | 0,58 | 327 | 9,40 | ||||
| 2026-02-11 | 13F | Dorsey & Whitney Trust CO LLC | 2 845 | 243 | ||||||
| 2026-02-17 | 13F | Steadfast Capital Management Lp | 682 605 | -42,82 | 58 397 | -37,71 | ||||
| 2026-02-11 | 13F | Deutsche Bank Ag\ | 1 669 840 | -8,56 | 142 855 | -0,40 | ||||
| 2026-01-12 | 13F | Avanza Fonder AB | 50 770 | 24,43 | 4 343 | 35,55 | ||||
| 2026-01-22 | 13F | Pinnacle Bancorp, Inc. | 146 | 0,00 | 12 | 9,09 | ||||
| 2026-02-06 | 13F | Fortis Group Advisors, LLC | 5 | 0,00 | 0 | |||||
| 2026-04-06 | 13F | Highline Wealth Partners Llc | 25 | -19,35 | 2 | -50,00 | ||||
| 2026-01-29 | 13F | Comerica Bank | 158 040 | -0,54 | 13 520 | 8,33 | ||||
| 2026-02-09 | 13F | Huntington National Bank | 3 244 | 22,42 | 278 | 33,17 | ||||
| 2026-02-05 | 13F | New York Life Investment Management Llc | 74 154 | -1,63 | 6 344 | 7,15 | ||||
| 2026-02-12 | 13F/A | Pinebridge Investments Llc | 8 155 | 698 | ||||||
| 2026-02-17 | 13F | Bank Of America Corp /de/ | Call | 0 | -100,00 | 0 | ||||
| 2026-01-20 | 13F | Harbor Capital Advisors, Inc. | 309 | -82,83 | 0 | |||||
| 2026-02-17 | 13F | NorthRock Partners, LLC | 3 442 | -71,54 | 294 | -69,02 | ||||
| 2026-02-12 | 13F | Brinker Capital Investments, LLC | 23 383 | 1,48 | 2 000 | 10,56 | ||||
| 2026-02-03 | 13F | Generali Asset Management SPA SGR | 41 083 | 493,77 | 3 515 | 547,15 | ||||
| 2026-02-12 | 13F | Benson Wealth Management INC | 26 | 2 | ||||||
| 2026-01-29 | 13F | Munich Reinsurance Co Stock Corp in Munich | 618 422 | -36,97 | 53 265 | -30,87 | ||||
| 2026-01-20 | 13F | Savvy Advisors, Inc. | 6 943 | 67,14 | 594 | 82,21 | ||||
| 2026-02-04 | 13F | Sentry Investment Management Llc | 1 426 | 0,00 | 0 | |||||
| 2026-01-23 | 13F | Galvin, Gaustad & Stein, LLC | 4 000 | 0,00 | 342 | 8,92 | ||||
| 2026-02-09 | 13F/A | Swedbank AB | 1 298 095 | -1,45 | 111 052 | 7,35 | ||||
| 2026-01-05 | 13F | GoalVest Advisory LLC | 230 | 20 | ||||||
| 2026-02-02 | 13F | Core Alternative Capital | 0 | -100,00 | 0 | |||||
| 2026-02-12 | 13F | Chilton Capital Management Llc | 16 | 1 | ||||||
| 2026-02-13 | 13F | Quarry LP | 1 062 | -83,35 | 91 | -82,04 | ||||
| 2026-02-09 | 13F | Harbour Investments, Inc. | 688 | -7,77 | 59 | 0,00 | ||||
| 2026-01-21 | 13F | Ledyard National Bank | 29 868 | 3,01 | 2 555 | 12,21 | ||||
| 2026-01-30 | 13F | Kohmann Bosshard Financial Services, LLC | 608 | 52 | ||||||
| 2026-02-17 | 13F | Lighthouse Investment Partners, LLC | 0 | -100,00 | 0 | |||||
| 2026-02-18 | 13F | EP Wealth Advisors, Inc. | 9 772 | 23,96 | 836 | 24,04 | ||||
| 2026-02-04 | 13F | Hartford Investment Management Co | 31 167 | -4,56 | 2 666 | 3,98 | ||||
| 2026-01-14 | 13F | Nova Wealth Management, Inc. | 18 | 0,00 | 2 | 0,00 | ||||
| 2026-01-29 | 13F | Calamos Wealth Management LLC | 3 494 | 13,48 | 299 | 23,65 | ||||
| 2026-02-13 | 13F | University Of Texas/texas Am Investment Managment Co | 70 850 | 679,60 | 6 061 | 750,07 | ||||
| 2026-04-09 | 13F | Wedmont Private Capital | 13 416 | 1,26 | 1 039 | 1,67 | ||||
| 2026-01-30 | 13F | United Community Bank | 124 | -14,48 | 11 | -9,09 | ||||
| 2026-02-12 | 13F | Johnson Financial Group, Inc. | 1 720 | -4,55 | 147 | 4,26 | ||||
| 2026-02-13 | 13F | Silvant Capital Management LLC | 665 | 0,00 | 57 | 7,69 | ||||
| 2026-02-17 | 13F | Prana Capital Management, LP | 745 309 | 17,74 | 63 761 | 28,25 | ||||
| 2025-11-14 | 13F | WealthTrak Capital Management LLC | 0 | -100,00 | 0 | |||||
| 2026-02-13 | 13F | Aptus Capital Advisors, LLC | 11 451 | 7,82 | 980 | 17,39 | ||||
| 2026-02-10 | 13F | Cherry Tree Wealth Management, LLC | 10 | 0,00 | 1 | |||||
| 2026-02-12 | 13F | Elo Mutual Pension Insurance Co | 87 347 | 2,80 | 7 473 | 11,97 | ||||
| 2026-01-12 | 13F | DAVENPORT & Co LLC | 11 409 | -3,75 | 976 | 4,83 | ||||
| 2026-02-10 | 13F | State of Wyoming | 5 417 | 9,21 | 463 | 19,02 | ||||
| 2026-02-04 | 13F | Centric Wealth Management | 36 928 | 0,27 | 2 730 | -6,12 | ||||
| 2026-02-11 | 13F | Prestige Wealth Management Group LLC | 1 203 | 0,00 | 103 | 8,51 | ||||
| 2026-01-21 | 13F | Prime Capital Investment Advisors, LLC | 9 448 | 5,19 | 808 | 14,61 | ||||
| 2026-01-21 | 13F | Stock Yards Bank & Trust Co | 6 400 | 0,00 | 548 | 8,96 | ||||
| 2026-01-21 | 13F | Prime Capital Investment Advisors, LLC | Put | 200 | 0,00 | 0 | ||||
| 2026-02-02 | 13F | Horizon Investments, LLC | 11 661 | 2,71 | 998 | 11,90 | ||||
| 2026-01-23 | 13F | Factory Mutual Insurance Co | 121 900 | -3,86 | 10 429 | 4,72 | ||||
| 2026-02-10 | 13F | Jupiter Asset Management Ltd | 1 504 602 | -6,87 | 128 719 | 1,44 | ||||
| 2025-11-12 | 13F | Accredited Wealth Management, LLC | 210 | 98,11 | 8 | -11,11 | ||||
| 2026-01-28 | 13F | Oversea-Chinese Banking CORP Ltd | 0 | -100,00 | 0 | -100,00 | ||||
| 2026-01-20 | 13F | Princeton Global Asset Management LLC | 151 | 0,00 | 13 | 9,09 | ||||
| 2026-02-13 | 13F | Allianz Se | 108 378 | 0,00 | 9 272 | 8,92 | ||||
| 2025-11-13 | 13F | Glenmede Investment Management, LP | 126 926 | 2,01 | 9 969 | -6,40 | ||||
| 2026-01-30 | 13F | Valued Wealth Advisors LLC | 475 | 7,22 | 41 | 17,65 | ||||
| 2026-02-12 | 13F | Skopos Labs, Inc. | 29 624 | 77,13 | 2 562 | 81,12 | ||||
| 2026-02-12 | 13F | Rossby Financial, LCC | 108 | 184,21 | 9 | 200,00 | ||||
| 2026-02-04 | 13F | Western Pacific Wealth Management, LP | 5 673 | 0,00 | 485 | 8,99 | ||||
| 2026-02-17 | 13F | Wiley Bros.-aintree Capital, Llc | 31 915 | -1,89 | 2 732 | 7,22 | ||||
| 2026-02-02 | 13F | Stuart Chaussee & Associates, Inc. | 0 | -100,00 | 0 | |||||
| 2026-02-10 | 13F | Hazlett, Burt & Watson, Inc. | 20 | -75,61 | 0 | |||||
| 2026-01-20 | 13F | Aspiriant, Llc | 3 055 | -2,15 | 261 | 6,53 | ||||
| 2026-04-08 | 13F | DiNuzzo Private Wealth, Inc. | 75 | -1,32 | 6 | -16,67 | ||||
| 2026-02-17 | 13F | Financial Avengers, Inc. | 49 | 0,00 | 4 | 0,00 | ||||
| 2026-04-06 | 13F | Rosenberg Matthew Hamilton | 27 | 0,00 | 2 | 0,00 | ||||
| 2026-02-06 | 13F | Bare Financial Services, Inc | 35 | 52,17 | 3 | 100,00 | ||||
| 2026-02-13 | 13F | Atlas Capital Advisors Llc | 583 | 0,34 | 50 | 0,00 | ||||
| 2026-01-27 | 13F | Shayne & Co., Llc | 22 780 | 0,00 | 1 949 | 8,89 | ||||
| 2026-02-11 | 13F | Rise Advisors, LLC | 0 | -100,00 | 0 | |||||
| 2026-02-13 | 13F | Golden State Wealth Management, LLC | 1 448 | -1,76 | 124 | 6,96 | ||||
| 2026-02-05 | 13F | High Note Wealth, LLC | 123 | 2,50 | 11 | 11,11 | ||||
| 2026-01-28 | 13F | Davis Capital Management | 4 | -42,86 | 0 | |||||
| 2026-02-05 | 13F | Thrivent Financial For Lutherans | 1 052 920 | 0,63 | 90 | 9,76 | ||||
| 2026-02-17 | 13F | Two Sigma Investments, Lp | 30 305 | -96,17 | 2 593 | -95,82 | ||||
| 2025-11-10 | 13F | Monetta Financial Services Inc | 0 | -100,00 | 0 | |||||
| 2026-02-17 | 13F | Pinnacle Financial Partners, Inc. | 52 409 | 4 484 | ||||||
| 2025-11-12 | 13F | HFG Advisors, Inc. | 0 | -100,00 | 0 | |||||
| 2026-02-17 | 13F | Sig Brokerage, Lp | 35 942 | 3 075 | ||||||
| 2026-02-17 | 13F | Sig Brokerage, Lp | Call | 90 000 | 1 736,73 | 7 700 | 1 904,95 | |||
| 2026-02-17 | 13F | Abel Hall, LLC | 3 141 | 269 | ||||||
| 2026-02-18 | 13F | Vident Advisory, LLC | 344 525 | -2,24 | 29 474 | 6,49 | ||||
| 2026-02-04 | 13F | Atlantic Union Bankshares Corp | 360 | 0,00 | 31 | 7,14 | ||||
| 2026-01-23 | 13F | Bingham Private Wealth, Llc | 6 325 | 12,24 | 541 | 12,24 | ||||
| 2026-02-05 | 13F | Convergence Investment Partners, LLC | 17 407 | 1 489 | ||||||
| 2026-02-11 | 13F | Empowered Funds, LLC | 24 421 | 15,48 | 2 089 | 25,84 | ||||
| 2026-01-22 | 13F | HHM Wealth Advisors, LLC | 248 | 0,00 | 21 | 10,53 | ||||
| 2026-02-10 | 13F | Goldman Sachs Group Inc | Call | 1 650 800 | 2 428,02 | 141 226 | 2 654,00 | |||
| 2026-02-10 | 13F | Goldman Sachs Group Inc | Put | 277 700 | 902,53 | 23 757 | 992,28 | |||
| 2026-04-09 | 13F | Everhart Financial Group, Inc. | 13 452 | -3,02 | 1 012 | -14,67 | ||||
| 2026-02-10 | 13F | Sittner & Nelson, Llc | 165 | 1 400,00 | 13 | |||||
| 2026-02-10 | 13F | Goldman Sachs Group Inc | 5 352 142 | 8,93 | 457 876 | 18,65 | ||||
| 2026-04-06 | 13F | GAMMA Investing LLC | 17 556 | 9,04 | 1 321 | -4,07 | ||||
| 2026-02-17 | 13F | Millennium Management Llc | Call | 18 700 | -18,70 | 1 600 | -11,46 | |||
| 2026-02-10 | 13F | Acadian Asset Management Llc | 13 547 | 1 | ||||||
| 2026-02-12 | 13F | Annandale Capital, LLC | 3 151 | 0,00 | 0 | -100,00 | ||||
| 2026-02-17 | 13F | Millennium Management Llc | 190 427 | -35,35 | 16 291 | -29,58 | ||||
| 2026-02-12 | 13F | Sit Investment Associates Inc | 0 | -100,00 | 0 | |||||
| 2026-02-17 | 13F | Millennium Management Llc | Put | 41 400 | 31,85 | 3 542 | 43,59 | |||
| 2026-02-10 | 13F | Basepoint Wealth LLC | 123 | 11 | ||||||
| 2026-02-13 | 13F | Parkside Financial Bank & Trust | 2 996 | 38,90 | 256 | 51,48 | ||||
| 2026-02-11 | 13F | Jessup Wealth Management, Inc | 473 | 40 | ||||||
| 2025-10-31 | 13F | National Wealth Management Group, LLC | 0 | -100,00 | 0 | |||||
| 2026-01-14 | 13F | TrueMark Investments, LLC | 82 196 | 29,21 | 7 032 | 40,73 | ||||
| 2026-01-26 | 13F | Asset Dedication, LLC | 191 | 0,00 | 16 | 6,67 | ||||
| 2026-02-13 | 13F | Centerpoint Advisors, LLC | 33 | 0,00 | 0 | |||||
| 2026-01-15 | 13F | Foster & Motley Inc | 38 554 | 11,86 | 3 | 50,00 | ||||
| 2026-02-17 | 13F | LMR Partners LLP | Put | 9 800 | 0,00 | 838 | 8,97 | |||
| 2026-02-23 | 13F | Kera Capital Partners, Inc. | 2 848 | 213 | ||||||
| 2026-02-17 | 13F | LMR Partners LLP | Call | 228 300 | 706,71 | 19 531 | 778,98 | |||
| 2026-02-12 | 13F | Aviva Plc | 464 845 | 2,66 | 39 767 | 11,83 | ||||
| 2026-02-18 | 13F | Achmea Investment Management B.V. | 0 | -100,00 | 0 | |||||
| 2026-02-06 | 13F | IFP Advisors, Inc | 3 337 | -6,13 | 285 | 2,15 | ||||
| 2026-02-17 | 13F | DZ BANK AG Deutsche Zentral Genossenschafts Bank, Frankfurt am Main | 9 083 | 16,14 | 777 | 26,55 | ||||
| 2026-04-02 | 13F | Ares Financial Consulting, LLC | 207 | 0,00 | 16 | -11,76 | ||||
| 2026-02-05 | 13F | May Hill Capital, LLC | 6 134 | 94,61 | 525 | 112,15 | ||||
| 2026-02-09 | 13F | Texas Capital Bank Wealth Management Services Inc | 3 145 | 269 | ||||||
| 2026-01-23 | 13F | Avion Wealth | 136 | 12,40 | 0 | |||||
| 2026-02-09 | 13F | Annis Gardner Whiting Capital Advisors, LLC | 14 195 | 0,61 | 1 214 | 9,57 | ||||
| 2026-04-09 | 13F | Chemistry Wealth Management LLC | 3 427 | -20,30 | 258 | -29,97 | ||||
| 2026-02-12 | 13F | Jane Street Group, Llc | 575 599 | 42,54 | 49 242 | 55,26 | ||||
| 2026-02-13 | 13F/A | Ontario Teachers Pension Plan Board | 0 | -100,00 | 0 | -100,00 | ||||
| 2026-02-12 | 13F | Jane Street Group, Llc | Put | 130 000 | 168,04 | 11 122 | 191,97 | |||
| 2026-02-12 | 13F | Jane Street Group, Llc | Call | 532 600 | 298,95 | 45 564 | 334,55 | |||
| 2026-01-08 | 13F | Armstrong Advisory Group, Inc | 50 | 0,00 | 4 | 33,33 | ||||
| 2026-02-13 | 13F | National Bank Of Canada /fi/ | 186 257 | -45,73 | 15 933 | -40,90 | ||||
| 2026-03-02 | 13F | Tobam | 804 | -58,10 | 0 | |||||
| 2026-01-16 | 13F/A | Beacon Investment Advisory Services, Inc. | 4 002 | -6,78 | 342 | 1,48 | ||||
| 2026-02-13 | 13F | GQG Partners LLC | 15 492 942 | -16,09 | 1 325 423 | -8,60 | ||||
| 2026-02-10 | 13F | National Pension Service | 887 460 | -1,82 | 75 922 | 6,94 | ||||
| 2026-02-13 | 13F | USS Investment Management Ltd | 95 892 | 0,05 | 8 207 | 9,02 | ||||
| 2026-01-29 | 13F | Concurrent Investment Advisors, LLC | 15 575 | 34,33 | 1 332 | 46,37 | ||||
| 2025-11-07 | 13F | Sierra Ocean, Llc | 0 | -100,00 | 0 | -100,00 | ||||
| 2026-01-30 | 13F | Torren Management, LLC | 1 057 | 90 | ||||||
| 2026-02-12 | 13F | Penserra Capital Management LLC | 48 | 0,00 | 0 | |||||
| 2026-02-17 | 13F | Spears Abacus Advisors LLC | 2 976 | 0,24 | 255 | 9,01 | ||||
| 2026-02-11 | 13F | Capital Research Global Investors | 26 208 447 | -8,15 | 2 242 136 | 0,05 | ||||
| 2026-02-10 | 13F | Westpac Banking Corp | 0 | -100,00 | 0 | |||||
| 2026-01-30 | 13F | Activest Wealth Management | 229 | 89,26 | 20 | 111,11 | ||||
| 2026-02-17 | 13F | Auxier Asset Management | 119 708 | 1,73 | 10 241 | 10,81 | ||||
| 2025-11-13 | 13F | Limestone Investment Advisors LP | Call | 0 | -100,00 | 0 | -100,00 | |||
| 2026-02-11 | 13F | Nemes Rush Group LLC | 29 490 | -0,50 | 2 523 | 8,38 | ||||
| 2026-02-13 | 13F | Smartleaf Asset Management LLC | 8 941 | 12,61 | 770 | 24,60 | ||||
| 2026-02-13 | 13F | Wealth Alliance | 3 210 | 2,62 | 275 | 11,84 | ||||
| 2026-02-05 | 13F | Gabelli Funds Llc | 59 200 | 0,00 | 5 065 | 8,93 | ||||
| 2026-02-13 | 13F | Financial Network Wealth Advisors LLC | 660 | 0,46 | 56 | 9,80 | ||||
| 2026-02-17 | 13F | Captrust Financial Advisors | 57 426 | -1,14 | 4 913 | 7,67 | ||||
| 2026-01-23 | 13F | Westside Investment Management, Inc. | 0 | -100,00 | 0 | |||||
| 2026-02-10 | 13F | JTC Employer Solutions Trusteee Ltd | 171 000 | 0,00 | 15 | 7,69 | ||||
| 2026-02-11 | 13F | Compass Rose Asset Management, LP | 61 000 | 5 219 | ||||||
| 2025-11-03 | 13F | SYM FINANCIAL Corp | 0 | -100,00 | 0 | -100,00 | ||||
| 2026-02-10 | 13F | Thompson Siegel & Walmsley Llc | 58 195 | 288,10 | 5 | 300,00 | ||||
| 2026-02-06 | 13F | Tortoise Investment Management, LLC | 0 | -100,00 | 0 | -100,00 | ||||
| 2026-02-06 | 13F | ProShare Advisors LLC | 127 876 | 14,54 | 10 940 | 24,76 | ||||
| 2026-02-09 | 13F | Allstate Corp | 43 149 | 100,62 | 3 691 | 118,53 | ||||
| 2026-02-17 | 13F | Centennial Bank/AR/ | 10 073 | 0,00 | 862 | 8,85 | ||||
| 2026-02-09 | 13F | Quest Partners LLC | 15 130 | -56,38 | 1 294 | -52,50 | ||||
| 2026-01-29 | 13F | Quent Capital, LLC | 3 888 | 3,60 | 333 | 12,93 | ||||
| 2026-02-11 | 13F | First Command Advisory Services, Inc. | 126 | 61,54 | 11 | 66,67 | ||||
| 2026-02-17 | 13F | Humankind Investments LLC | 0 | -100,00 | 0 | -100,00 | ||||
| 2026-02-11 | 13F | Ameritas Investment Partners, Inc. | 4 829 | 413 | ||||||
| 2026-02-12 | 13F | Kinneret Advisory, LLC | 6 146 | -2,66 | 526 | 6,06 | ||||
| 2026-02-12 | 13F | Great Lakes Retirement, Inc. | 5 860 | 4,36 | 501 | 13,61 | ||||
| 2026-02-11 | 13F | Hilton Head Capital Partners, LLC | 535 | 46 | ||||||
| 2026-02-11 | 13F | J.w. Cole Advisors, Inc. | 2 491 | -19,59 | 213 | -12,76 | ||||
| 2026-01-27 | 13F | Krilogy Financial LLC | 0 | -100,00 | 0 | |||||
| 2026-02-13 | 13F | Wilkerson Advisory Group LLC | 114 | 10 | ||||||
| 2026-02-10 | 13F | Kentucky Retirement Systems Insurance Trust Fund | 15 163 | 0,00 | 1 297 | 8,99 | ||||
| 2026-02-12 | 13F | Quadrant Capital Group Llc | 14 281 | 0,12 | 1 222 | 9,02 | ||||
| 2026-01-20 | 13F | Tritonpoint Wealth, Llc | 11 441 | -2,01 | 979 | 6,65 | ||||
| 2026-01-30 | 13F | NJ State Employees Deferred Compensation Plan | 0 | -100,00 | 0 | |||||
| 2025-10-31 | 13F | Symphony Financial, Ltd. Co. | 0 | -100,00 | 0 | -100,00 | ||||
| 2026-02-12 | 13F | Callan Family Office, LLC | 22 904 | 31,18 | 1 959 | 42,89 | ||||
| 2026-01-15 | 13F | Nisa Investment Advisors, Llc | 197 994 | -10,09 | 16 938 | -2,07 | ||||
| 2026-01-07 | 13F | Aventura Private Wealth, LLC | 451 | 1,12 | 39 | 8,57 | ||||
| 2026-02-09 | 13F | Keating Financial Advisory Services, Inc. | 581 | 50 | ||||||
| 2026-01-13 | 13F | Stonehage Fleming Financial Services Holdings Ltd | 9 241 | -15,75 | 791 | -8,25 | ||||
| 2026-01-26 | 13F | BCS Private Wealth Management, Inc. | 0 | -100,00 | 0 | |||||
| 2025-11-12 | 13F | Cobblestone Capital Advisors Llc /ny/ | 4 762 | 3,34 | 374 | -5,08 | ||||
| 2026-02-13 | 13F | Journey Strategic Wealth Llc | 2 984 | -1,06 | 255 | 8,05 | ||||
| 2026-01-30 | 13F | Bogart Wealth, LLC | 86 | 43,33 | 7 | 75,00 | ||||
| 2026-02-10 | 13F | Fort Sheridan Advisors Llc | 2 500 | 214 | ||||||
| 2026-02-13 | 13F | Bollard Group LLC | 0 | -100,00 | 0 | |||||
| 2026-02-12 | 13F | Empire Financial Management Company, LLC | 9 711 | 0,00 | 831 | 8,92 | ||||
| 2026-02-10 | 13F | Essex Financial Services, Inc. | 5 760 | -15,06 | 493 | -7,52 | ||||
| 2026-01-22 | 13F | Apollon Wealth Management, LLC | 15 716 | -0,27 | 1 344 | 8,65 | ||||
| 2026-02-06 | 13F | Radnor Capital Management, LLC | 15 154 | 0,00 | 1 296 | 8,91 | ||||
| 2026-02-17 | 13F | Aristotle Capital Management, LLC | 10 987 850 | -5,00 | 940 017 | 3,48 | ||||
| 2026-01-26 | 13F | PDS Planning, Inc | 4 344 | 2,48 | 372 | 11,75 | ||||
| 2026-01-09 | 13F | SG Americas Securities, LLC | 1 900 128 | -16,23 | 163 | -8,99 | ||||
| 2026-02-13 | 13F | Stifel Financial Corp | 493 269 | -3,49 | 42 199 | 5,12 | ||||
| 2026-02-13 | 13F | Solstein Capital, LLC | 0 | -100,00 | 0 | |||||
| 2026-01-12 | 13F | E. Ohman J:or Asset Management AB | 19 614 | 10,07 | 1 678 | 19,87 | ||||
| 2026-02-17 | 13F | Wealth Watch Advisors, INC | 19 | -72,06 | 2 | -80,00 | ||||
| 2026-02-10 | 13F/A | Algebris (uk) Ltd | 451 264 | 135,59 | 38 643 | 157,07 | ||||
| 2026-02-05 | 13F | IMG Wealth Management, Inc. | 83 | 7 | ||||||
| 2026-02-13 | 13F | Edgestream Partners, L.P. | 3 332 | 285 | ||||||
| 2026-02-17 | 13F | Nomura Holdings Inc | 13 958 | -2,38 | 1 194 | 6,42 | ||||
| 2026-02-03 | 13F | Mitsubishi UFJ Kokusai Asset Management Co., Ltd. | 1 156 343 | 4,59 | 97 445 | 12,22 | ||||
| 2026-01-23 | 13F | Timber Creek Capital Management LLC | 17 199 | -9,56 | 1 471 | -1,47 | ||||
| 2026-02-09 | 13F | Bleakley Financial Group, LLC | 17 344 | -3,32 | 1 484 | 5,33 | ||||
| 2026-02-17 | 13F | Signature Equity Partners, LLC | 593 | 51 | ||||||
| 2026-02-17 | 13F | Aqr Capital Management Llc | 2 774 979 | -2,41 | 237 399 | 7,12 | ||||
| 2026-02-12 | 13F | Tocqueville Asset Management L.p. | 4 355 | 373 | ||||||
| 2026-02-17 | 13F | Wellington Management Group Llp | 25 915 253 | -0,50 | 2 217 050 | 8,38 | ||||
| 2026-01-21 | 13F | Yousif Capital Management, Llc | 83 440 | 2,03 | 6 044 | -5,90 | ||||
| 2026-01-08 | 13F | Sound View Wealth Advisors Group, LLC | 0 | -100,00 | 0 | |||||
| 2026-02-03 | 13F | Costello Asset Management, INC | 190 | 0,00 | 16 | 14,29 | ||||
| 2026-01-15 | 13F | Fortitude Family Office, LLC | 569 | -5,64 | 49 | 2,13 | ||||
| 2026-01-27 | 13F | Institute for Wealth Management, LLC. | 15 497 | -1,92 | 1 326 | 6,77 | ||||
| 2025-11-04 | 13F | Guerra Advisors Inc | 20 | 2 | ||||||
| 2026-01-14 | 13F | Chesley Taft & Associates LLC | 10 386 | 889 | ||||||
| 2026-02-06 | 13F | Cedar Wealth Management, LLC | 28 | 0,00 | 2 | 0,00 | ||||
| 2026-02-09 | 13F | Mizuho Securities Usa Llc | 39 288 | -2,63 | 2 992 | -8,81 | ||||
| 2026-01-14 | 13F | Cox Capital Mgt LLC | 13 092 | 0,00 | 946 | -7,98 | ||||
| 2026-02-05 | 13F | HFM Investment Advisors, LLC | 61 | 258,82 | 5 | 400,00 | ||||
| 2026-02-17 | 13F | Summit Trail Advisors, Llc | 17 511 | -25,37 | 1 498 | -18,68 | ||||
| 2026-01-26 | 13F | La Banque Postale Asset Management SA | 13 165 | 0,00 | 1 126 | 9,00 | ||||
| 2026-02-17 | 13F | Tudor Investment Corp Et Al | Put | 3 000 | -73,91 | 257 | -71,65 | |||
| 2026-02-17 | 13F | Tudor Investment Corp Et Al | Call | 7 500 | -85,90 | 642 | -84,66 | |||
| 2026-02-18 | 13F | Beacon Pointe Advisors, LLC | 13 183 | -12,05 | 1 128 | -4,25 | ||||
| 2026-01-29 | 13F | Rakuten Securities, Inc. | 0 | -100,00 | 0 | |||||
| 2026-02-14 | 13F | Rockefeller Capital Management L.P. | 55 216 | 33,48 | 4 724 | 45,37 | ||||
| 2026-02-17 | 13F | Brevan Howard Capital Management LP | 0 | -100,00 | 0 | |||||
| 2026-01-28 | 13F | Loring Wolcott & Coolidge Fiduciary Advisors Llp/ma | 72 | 5 | ||||||
| 2026-02-17 | 13F | Brevan Howard Capital Management LP | Call | 0 | -100,00 | 0 | ||||
| 2026-01-28 | 13F | Turtle Creek Wealth Advisors, LLC | 2 914 | -5,85 | 249 | 2,47 | ||||
| 2026-01-30 | 13F | Mitsubishi UFJ Trust & Banking Corp | 360 754 | -38,19 | 30 867 | -32,67 | ||||
| 2026-02-17 | 13F | Banco Bilbao Vizcaya Argentaria, S.a. | 0 | -100,00 | 0 | |||||
| 2026-02-09 | 13F | Choate Investment Advisors | 3 629 | -38,26 | 310 | -32,75 | ||||
| 2026-02-11 | 13F | Brandes Investment Partners, Lp | 4 552 | -99,70 | 389 | -99,67 | ||||
| 2026-02-11 | 13F | Livforsakringsbolaget Skandia, Omsesidigt | 4 407 | 0,00 | 377 | 8,96 | ||||
| 2026-01-23 | 13F | Webster Bank, N. A. | 1 035 | 0,00 | 89 | 8,64 | ||||
| 2026-02-11 | 13F | Parallel Advisors, LLC | 4 493 | -16,69 | 384 | -9,22 | ||||
| 2026-02-12 | 13F | Federated Hermes, Inc. | 92 470 | -4,64 | 7 911 | 3,86 | ||||
| 2026-02-03 | 13F | We Are One Seven, LLC | 11 610 | 3,81 | 993 | 13,10 | ||||
| 2026-02-10 | 13F | Gulf International Bank (UK) Ltd | 31 018 | 0,00 | 3 | 0,00 | ||||
| 2026-02-11 | 13F | Janney Montgomery Scott LLC | 66 003 | 1,78 | 6 | 0,00 | ||||
| 2026-02-13 | 13F | Commerce Bank | 16 933 | -1,54 | 1 449 | 7,26 | ||||
| 2026-02-09 | 13F | HBK Sorce Advisory LLC | 3 150 | -1,78 | 242 | -7,31 | ||||
| 2026-02-10 | 13F | Forsta Ap-fonden | 112 900 | -5,44 | 9 659 | 3,00 | ||||
| 2026-01-28 | 13F | Klp Kapitalforvaltning As | 280 785 | 17,44 | 24 021 | 27,93 | ||||
| 2026-02-17 | 13F | Redwood Park Advisors LLC | 8 | 0,00 | 1 | |||||
| 2026-02-17 | 13F | Bridgeway Capital Management Inc | 0 | -100,00 | 0 | -100,00 | ||||
| 2026-01-09 | 13F | SG Americas Securities, LLC | Call | 193 400 | 616,30 | 0 | ||||
| 2026-01-16 | 13F | Longboard Asset Management, LP | 0 | -100,00 | 0 | |||||
| 2026-02-05 | 13F | DnB Asset Management AS | 227 725 | 108,96 | 19 482 | 127,61 | ||||
| 2026-01-29 | 13F | DecisionPoint Financial, LLC | 107 | 0,00 | 9 | 12,50 | ||||
| 2026-02-12 | 13F | DRW Securities, LLC | 9 842 | -76,61 | 842 | -74,58 | ||||
| 2026-02-17 | 13F | Bank Of America Corp /de/ | 5 967 006 | 0,23 | 510 477 | 9,18 | ||||
| 2026-02-11 | 13F | IMA Wealth, Inc. | 20 | 2 | ||||||
| 2026-02-17 | 13F | First Manhattan Co | 0 | -100,00 | 0 | |||||
| 2026-01-20 | 13F | LifePlan Financial, LLC | 4 484 | -0,27 | 384 | 8,50 | ||||
| 2026-01-26 | 13F | SeaBridge Investment Advisors LLC | 17 372 | -0,16 | 1 486 | 8,78 | ||||
| 2026-02-09 | 13F | Employees Retirement System of Texas | 52 305 | -54,79 | 4 | -55,56 | ||||
| 2026-02-17 | 13F | ATLas Financial Planning LLC | 6 155 | 527 | ||||||
| 2026-02-17 | 13F | Edmond De Rothschild Holding S.a. | 232 345 | -1,62 | 19 877 | 7,17 | ||||
| 2026-02-04 | 13F | Rock Point Advisors, LLC | 104 680 | 2,52 | 8 955 | 11,67 |